
Chapter 2: Investigating the Locations of the Planets on the Sky
Science Notebook Assignment
Begin a new note for this investigation. Be sure you are continuing to keep your notebook organized and labeled.
Investigation Question:
Where do we find planets on the sky, and how can we use this information to predict future planet observations?
You have previously observed the Moon and stars in the sky and have used Starry Night to make simulated observations of these same objects. With just your eye, you can see the planets Mercury, Venus, Mars, Jupiter, and Saturn on the sky. With the aid of a telescope, you can also locate Uranus and Neptune. Venus, Jupiter, and Mars can appear particularly bright in the sky and are relatively easy to find. With some practice, you can often teach yourself how to find Mercury and Saturn, too. For this investigation, though, we will again use Starry Night as a data collection tool so that we can easily observe the planets and observe them over longer periods of time than we can in our limited time for this class.
Using Starry Night to observe the planets
Starry Night has several features that will help you identify the planets more easily for this activity. There are also a few other additional features you will likely want to use to help you take note of the sky during your observations.
- The Labels menu allows you to show a label for every object of a certain type, and one option in that menu is “Planets-Moons”. If you choose that menu option, it will label any planet visible in the field of view.
- You can type the name of an object in the search bar on the upper right, and if you double click on the object after it is found, it will shift the view so you can see the object you have just searched for.
- If you place the mouse over an object, it will bring up a bit of information about that object on the screen. If you right click on the object, a menu will pop up allowing you to choose “Show Info”, which will bring up a window with much more information the object.
- If you have the mouse in the main viewer window and type the letter “k” on the keyboard, it will bring up the stick figure overlays on the stars indicating the constellations and list their names.
Data collection with Starry Night
The instructor will assign each group one of the planets (Mercury, Venus, Mars, Jupiter, Saturn, Uranus, or Neptune). Every group should find their planet in the sky on a random day of the current year. Then, in groups, you should discuss:
- What are all the ways in which you can describe the location of your planet on the sky?
As a class you should share your answers to this question, and you should determine several specific observations you will make for each planet observation that are useful to describe the location of that planet on the sky. Returning to your group, you should pick 10 dates separated in time to observe the planet assigned to your group. Your goal is to find a pattern in the changing location of your planet’s appearance on the sky. So you need to pick dates that are separated enough in time so that the pattern becomes evident. If you do not see a pattern, you may wish to pick a few dates far in the past or far in the future to see if those help you identify the pattern for your planet. Another Starry Night feature that may help you is to use the time flow feature to watch many nights go by quickly.
[INSERT STARRY NIGHT MOVIE HERE SHOWING THIS EXAMPLE]
Science Notebook Assignment
Create a table in your notebook that includes 10 rows. In each row, record one observation from one date in time of your group’s assigned planet and list all of the ways you can describe the planet’s location in the table.
Data analysis in small groups
After gathering data on at least 10 dates for the location of your planet, you need to discuss in your small group the pattern that appears to be evident in the location. Depending on how extensive of a list you came up with for what details to consider, you likely have a lot of data — 10 dates times the number of different observations you made that describe the planet’s location. When you have a large quantity of data, one strategy for analyzing it is to search for the simplest pattern you can find. That is, you don’t need to come up with an explanation that includes all of your various observations, but, for example, is there one observation in particular that you can use to describe where to find the planet you studied? If so, you are ready to write your initial claim.
This initial claim should answer where on the sky do we find the planet your group analyzed? At this point, we recommend that initial claims and evidence be shared with the whole class using whiteboards or other presentation technology.
Science Notebook Assignment
Record your group’s initial claim for the one planet you studied. Be sure to describe the data from your table that you used as evidence to determine your claim.
Plotting all of your data to look for a global pattern
In our class at Penn State, at this point in the investigation, we set up new groups to share data. If, for example, all groups studying a planet have four members, we have each group count off from 1 to 4. Then, the new groups will be made up of all the 1s, 2s, 3s, and 4s. Thus, there will be four new groups each having one member who studied one planet.
In your new group, review the initial claims that each group shared about the location of their planet. One way you can try to make sense of all of the data on all of the planets is to try to plot this data on a map of the sky. Because the sky changes over the year, no single sky map will show the whole sky. Since your dates for your observations spanned all of the dates of the year, you need at least two maps that show you the winter sky and the summer sky. Below are two maps made from Starry Night showing the sky on the summer solstice and winter solstice. For the next step of the investigation, you can print out copies of these (or similar maps from any night sky book, like “Nightwatch” by Terrence Dickinson).
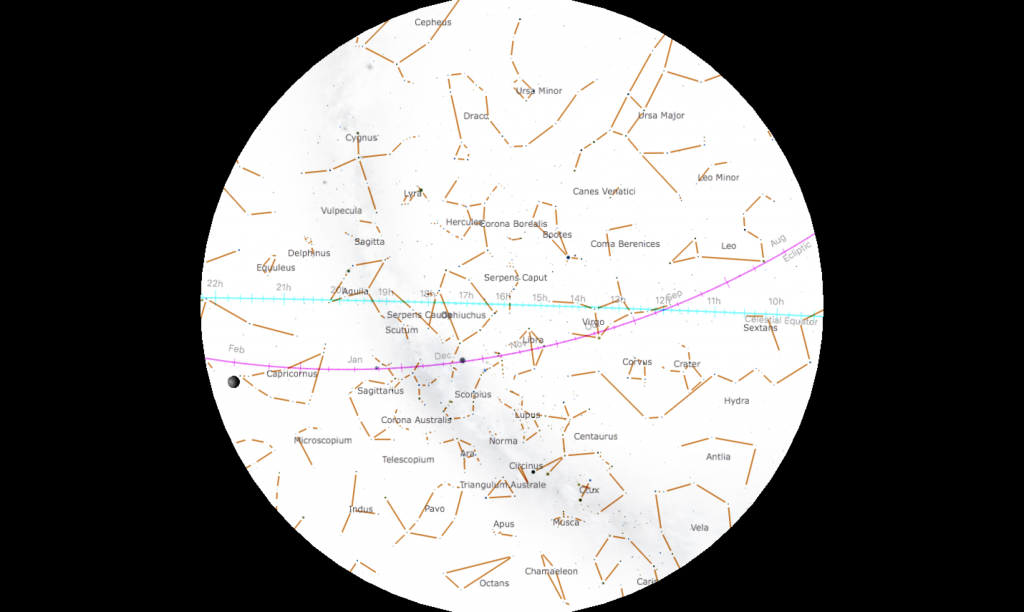
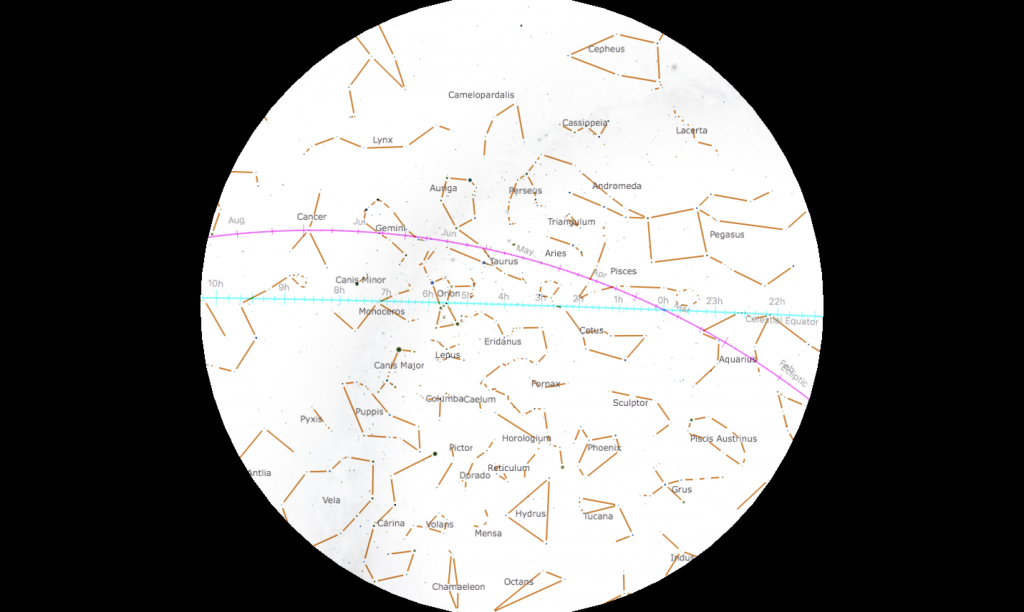
[Add a discussion of what an all sky map is — that is, this circle represents the entire dome of the sky, so the horizon is the edge of the circle and the zenith is the middle]
On hardcopies of these maps, or similar maps, plot the locations of all the planets studied by the members of your group. We recommend color coding the dots for each planet using colored pencils or markers. After plotting the positions of your planets with respect to the stars on the entire sky, consider and discuss the question: Is there a pattern to the location of the planets that can be used to predict their future locations? You should analyze the data on all of the planets and consider if the pattern appears to be the same for all planets. The group’s joint answer to this question should be used to revise your initial claim.
Science Notebook Assignment
Record your group’s revised claim that answers the investigation question for all of the planets. As part of your evidence, we recommend including a photograph of your sky maps in your notebook.
Building a model to provide scientific reasoning to support your claim about the locations of the planets
As part of our effort to provide reasoning to answer our investigation question, we again need to consider shifting our point of view from an Earth-based perspective of the sky (which is what you observed with Starry Night and the sky maps) to a space-based perspective of the Solar System. Using methods similar to those for the Moon investigation and motion of the Sun investigation previously, we will work together as a class to build a 3D model using the classroom space to simulate the locations of the celestial objects we have been studying. Building a model of the Solar System and the stars in a single classroom is not able to be done if you make your model true to scale. That is, if you pick some scale like 1 centimeter = 100,000 km and then scale everything down using that mathematical relationship, you will find that either the planets will be too small and too close, or they will be too big and too widely separated. So in this model, we have to take some liberties with the scale in order to get it to fit into the space we have available (Note, even in a huge open space, like a gymnasium, there is no way to represent the distance to the stars in a model that would also allow the planets and the Sun to be a reasonable size and distance from each other).
To build the model in our class, we begin with locating some of the constellations seen on the sky maps above. Your instructor will provide you with pictures that represent these constellations. Because the planets move with time, we also recommend picking a specific date and building your model to represent the locations of Solar System objects on that particular date. In our class, we use the night of Feb 6, 2015.
In your classroom, you should place a small yellow ball on a tabletop in the center of the room to represent the Sun (we use modeling clay to make our Sun, but you could use wooden craft beads, a tennis ball, or anything else that is handy). Given your knowledge of Earth’s relationship to the Sun, place a smaller ball (we used blue modeling clay) where you expect the Earth to be in relation to the where you put the Sun in the classroom. As a full class, consider the following questions, and come to a class decision about how to answer them:
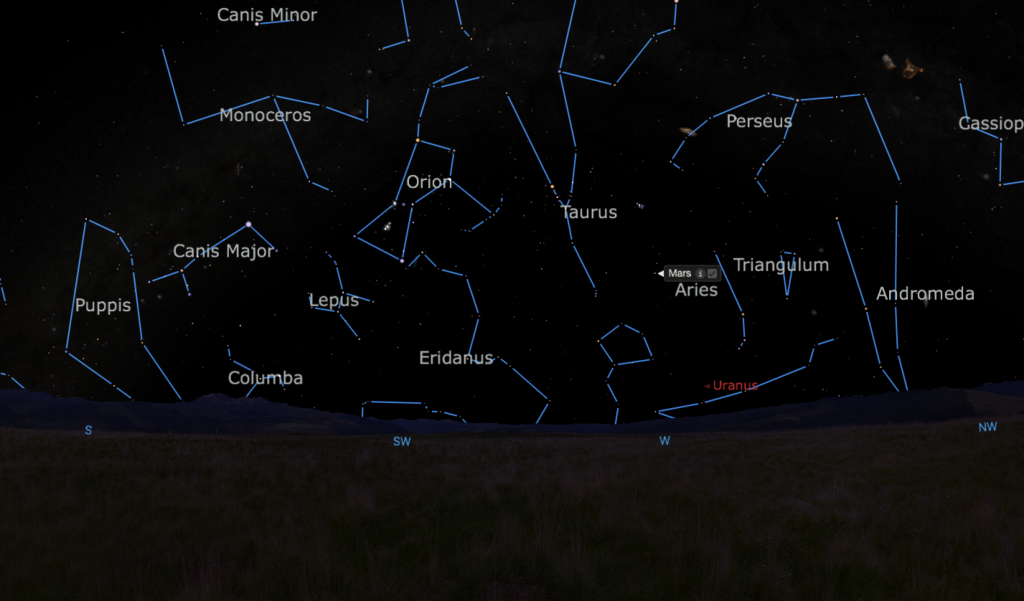
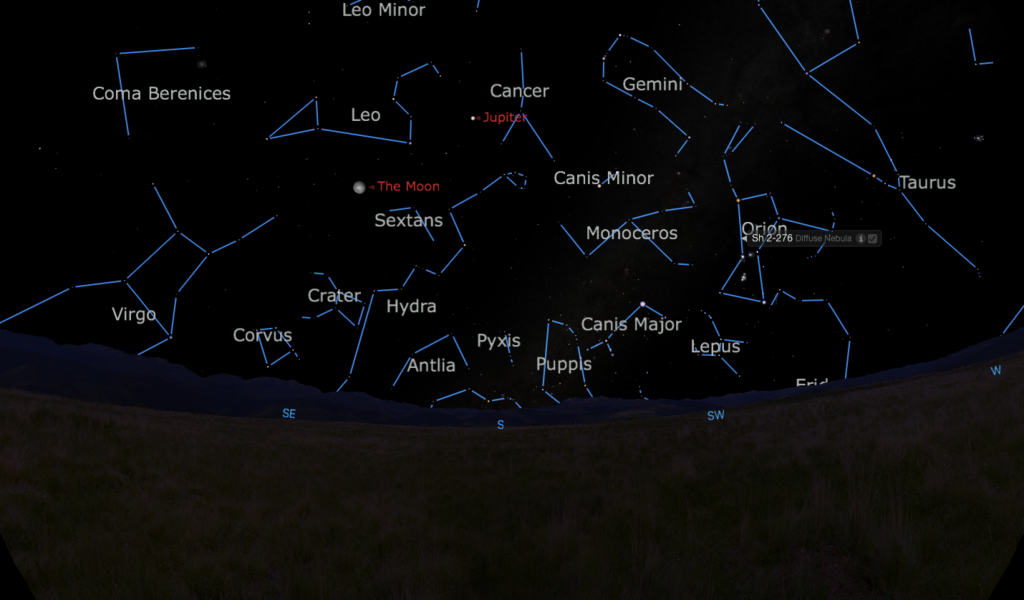
- Referring to the image in Figure 2.1.4 that shows your view of Jupiter from the Earth-based perspective, can you infer where you should place another ball of clay to represent Jupiter?
- Note the time at which the image in Figure 2.1.4 represents in the figure caption; does that help you determine where to place Earth and Jupiter with respect to the Sun?
Recall that the picture in Figure 2.1.4 is showing you the sky as you see it from your perspective on Earth. Consider where Jupiter must be in space compared to where the stars should be. Using the pictures of the constellations provided by the instructor, hang the pictures for Leo, Cancer, and Gemini in the classroom where you predict they should be based on where you put Jupiter and where the stars appear in the image in Figure 2.1.4. At this point, each group should get one or more additional constellations. Using Starry Night or another resource, determine where to place the other constellation(s) given to your group, and hang your image(s) up on the wall. When the exercise is completed, all 12 constellations should be hung up somewhere in the classroom. At this point, you have turned your classroom into a physical model of the location of the Sun, the Earth, the planet Jupiter, and 12 constellations. This is a challenging exercise, and it is likely your first attempt may need some adjustments.
Adjusting your model using additional observations
If you only have the image in Figure 2.1.4 to guide the creation of your model, it was likely not clear exactly where to put all of the additional constellation drawings provided by the instructor. In our class, our first attempt at building the model often has disagreements between the groups about where to put the constellations. In order to improve the model, we consider and discuss the following questions. Discuss these questions in your groups before returning to the model:
- From Earth, where will the Sun appear on the sky at noon on Feb 6, 2015? Can you use Starry Night to answer this question? Can you adjust one of your constellation maps using this answer?
- From month to month, how should Earth move in your model?
- Temporarily move the Earth in your model to where you predict it should be on August 6, 2015. Use Starry Night to observe the sky at noon and at midnight on August 6. Can you explain how the visible constellations on the sky appear different between February and August? Does that help you adjust any more of your constellation maps?
- Can you use Starry Night now to help you decide how to adjust the positions of all of the 12 constellation maps used in the model?
Once you have all of the constellations properly placed around the room, you can return to working out the locations of the planets in your model. Again, using Starry Night determine when and where to look to find the other planets in the sky on Feb 6, 2015. Then, using the same types of logic you used to place Jupiter and the constellations, determine where to place balls of clay to represent Mercury, Venus, Mars, Saturn, Uranus, and/or Neptune.
Finalizing your reasoning in support of your claims and evidence
Now that you have a complete model for the layout of the Solar System and some of the constellations, you should be able to finalize your reasoning to explain the claims your wrote for this investigation. To ensure that you can make the strongest connections between the model and your claims, we recommend you discuss the following questions in your groups:
- How does this model help to answer where we will find the planets on the sky?
- Where do you predict we will always see the planets, and where will you never see the planets, as observed from Earth?
- How does this model and your answers to the two previous questions explain the claims you made previously?
- What does this model tell you about the three-dimensional layout of the Solar System?
You can revisit your claims now that you have completed the model if you would like to add or revise any of your group’s ideas.
Science Notebook Assignment
Record your final claim(s), evidence in support, and the reasoning from your model in your notebook to answer the investigation question about where we find planets on the sky and how we can use this information to predict their future locations. Record the final group claim in your evidence bucket as one more piece of information you can use to build your understanding of the Solar System as a whole.
Resources for further reading
If you are interested in creating a scale model of the Solar System that does use a proper scale to represent the size of the objects and their true separations from each other, you can use this on-line scale model generator: Exploratorium Build a Solar System
