
Private: Chapter Twelve
Collision Theory (12.5)
OpenStax
Learning Objectives
By the end of this section, you will be able to:
- Use the postulates of collision theory to explain the effects of physical state, temperature, and concentration on reaction rates
- Define the concepts of activation energy and transition state
- Use the Arrhenius equation in calculations relating rate constants to temperature
We should not be surprised that atoms, molecules, or ions must collide before they can react with each other. Atoms must be close together to form chemical bonds. This simple premise is the basis for a very powerful theory that explains many observations regarding chemical kinetics, including factors affecting reaction rates.
Collision theory is based on the following postulates:
- The rate of a reaction is proportional to the rate of reactant collisions:
reaction rate ∝ [latex]\frac{\text{# collisions}}{\text{time}}[/latex]
- The reacting species must collide in an orientation that allows contact between the atoms that will become bonded together in the product.
- The collision must occur with adequate energy to permit mutual penetration of the reacting species’ valence shells so that the electrons can rearrange and form new bonds (and new chemical species).
We can see the importance of the two physical factors noted in postulates 2 and 3, the orientation and energy of collisions, when we consider the reaction of carbon monoxide with oxygen:
2CO(g) + O2(g) ⟶ 2CO2(g)
Carbon monoxide is a pollutant produced by the combustion of hydrocarbon fuels. To reduce this pollutant, automobiles have catalytic converters that use a catalyst to carry out this reaction. It is also a side reaction of the combustion of gunpowder that results in muzzle flash for many firearms. If carbon monoxide and oxygen are present in sufficient amounts, the reaction will occur at high temperature and pressure.
The first step in the gas-phase reaction between carbon monoxide and oxygen is a collision between the two molecules:
CO(g) + O2(g) ⟶ CO2(g) + O(g)
Although there are many different possible orientations the two molecules can have relative to each other, consider the two presented in Figure 12.13. In the first case, the oxygen side of the carbon monoxide molecule collides with the oxygen molecule. In the second case, the carbon side of the carbon monoxide molecule collides with the oxygen molecule. The second case is clearly more likely to result in the formation of carbon dioxide, which has a central carbon atom bonded to two oxygen atoms (O = C = O). This is a rather simple example of how important
the orientation of the collision is in terms of creating the desired product of the reaction.
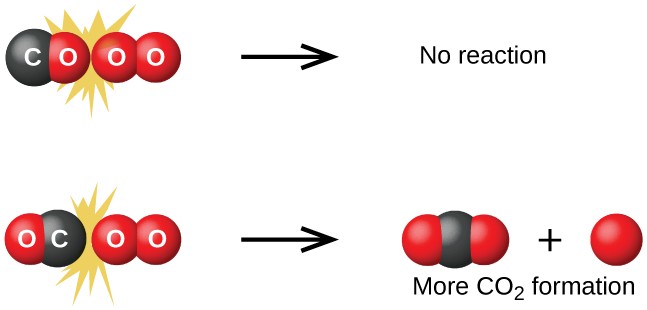
Figure 12.13 Illustrated are two collisions that might take place between carbon monoxide and oxygen molecules. The orientation of the colliding molecules partially determines whether a reaction between the two molecules will occur.
If the collision does take place with the correct orientation, there is still no guarantee that the reaction will proceed to form carbon dioxide. In addition to a proper orientation, the collision must also occur with sufficient energy to result in product formation. When reactant species collide with both proper orientation and adequate energy, they combine to form an unstable species called an activated complex or a transition state. These species are very short lived and usually undetectable by most analytical instruments. In some cases, sophisticated spectral measurements have been used to observe transition states.
Collision theory explains why most reaction rates increase as concentrations increase. With an increase in the concentration of any reacting substance, the chances for collisions between molecules are increased because there are more molecules per unit of volume. More collisions mean a faster reaction rate, assuming the energy of the collisions is adequate.
Activation Energy and the Arrhenius Equation
The minimum energy necessary to form a product during a collision between reactants is called the activation energy (Ea). How this energy compares to the kinetic energy provided by colliding reactant molecules is a primary factor affecting the rate of a chemical reaction. If the activation energy is much larger than the average kinetic energy of the molecules, the reaction will occur slowly since only a few fast-moving molecules will have enough energy to react. If the activation energy is much smaller than the average kinetic energy of the molecules, a large fraction of molecules will be adequately energetic and the reaction will proceed rapidly.
Figure12.14 shows how the energy of a chemical system changes as it undergoes a reaction converting reactants to products according to the equation
A + B ⟶ C + D
These reaction diagrams are widely used in chemical kinetics to illustrate various properties of the reaction of interest. Viewing the diagram from left to right, the system initially comprises reactants only, A + B. Reactant molecules with sufficient energy can collide to form a high-energy activated complex or transition state. The unstable transition state can then subsequently decay to yield stable products, C + D. The diagram depicts the reaction’s activation energy, Ea, as the energy difference between the reactants and the transition state. Using a specific energy, the enthalpy (see chapter on thermochemistry), the enthalpy change of the reaction, ΔH, is estimated as the energy difference between the reactants and products. In this case, the reaction is exothermic (ΔH < 0) since it yields a decrease in system enthalpy.
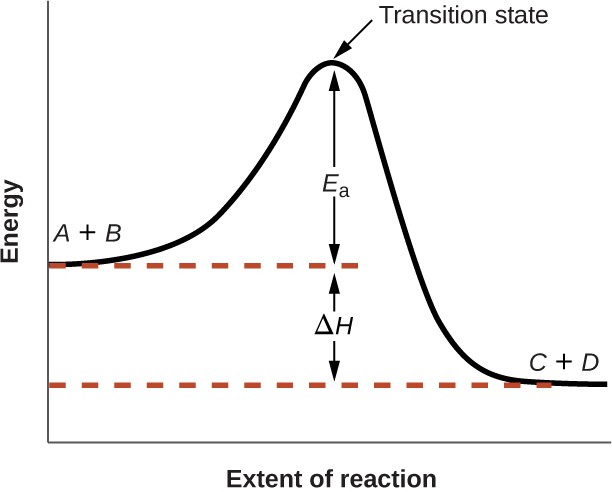
Figure 12.14 Reaction diagram for the exothermic reaction A + B ⟶ C + D.
The Arrhenius equation relates the activation energy and the rate constant, k, for many chemical reactions:
k = Ae−Ea /RT
In this equation, R is the ideal gas constant, which has a value 8.314 J/mol/K, T is temperature on the Kelvin scale, Ea is the activation energy in joules per mole, e is the constant 2.7183, and A is a constant called the frequency factor, which is related to the frequency of collisions and the orientation of the reacting molecules.
Postulates of collision theory are nicely accommodated by the Arrhenius equation. The frequency factor, A, reflects how well the reaction conditions favor properly oriented collisions between reactant molecules. An increased probability of effectively oriented collisions results in larger values for A and faster reaction rates.
The exponential term, e−Ea/RT, describes the effect of activation energy on reaction rate. According to kinetic molecular theory (see chapter on gases), the temperature of matter is a measure of the average kinetic energy of its constituent atoms or molecules. The distribution of energies among the molecules composing a sample of matter at any given temperature is described by the plot shown in Figure 12.15 (a). Two shaded areas under the curve represent the numbers of molecules possessing adequate energy (RT) to overcome the activation barriers (Ea). A lower activation energy results in a greater fraction of adequately energized molecules and a faster reaction.
The exponential term also describes the effect of temperature on reaction rate. A higher temperature represents a correspondingly greater fraction of molecules possessing sufficient energy (RT) to overcome the activation barrier (Ea), as shown in Figure 12.15 (b). This yields a greater value for the rate constant and a correspondingly faster reaction rate.
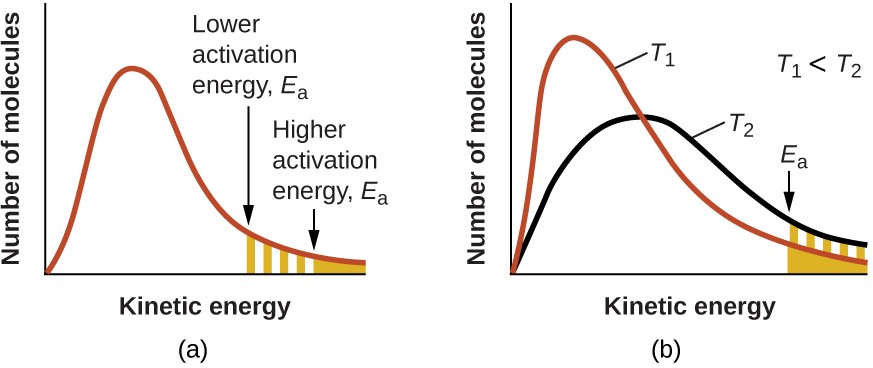
Figure 12.15 Molecular energy distributions showing numbers of molecules with energies exceeding (a) two different activation energies at a given temperature, and (b) a given activation energy at two different temperatures.
A convenient approach for determining Ea for a reaction involves the measurement of k at two or more different temperatures and using an alternate version of the Arrhenius equation that takes the form of a linear equation
[latex]\begin{array}{r @{{}\;{}} l} \text{ln}\;k = & (\frac{-E_{\text{a}}}{R})(\frac{1}{T})\;+\;\text{ln}\;A \\[0.5em] y = & mx\;+\;b \end{array}[/latex]
A plot of ln k versus [latex]\frac{1}{T}[/latex] is linear with a slope equal to [latex]\frac{-E_{\text{a}}}{R}[/latex], and a y-intercept equal to ln A.
Example 12.13
Determination of Ea
The variation of the rate constant with temperature for the decomposition of HI(g) to H2(g) and I2(g) is given here. What is the activation energy for the reaction?
2HI(g) ⟶ H2(g) + I2(g)
|
T (K) |
k (L/mol/s) |
|
555 |
3.52 × 10⁻⁷ |
|
575 |
1.22 × 10⁻⁶ |
|
645 |
8.59 × 10⁻⁵ |
|
700 |
1.16 × 10⁻³ |
|
781 |
3.95 × 10⁻² |
Solution
Use the provided data to derive values of [latex]\frac{1}{T}[/latex] and ln k and ln k:
|
[latex]\frac{1}{\text{T}}[/latex] (K-1) |
ln k |
|
1.80 × 10⁻³ |
−14.860 |
|
1.74 × 10⁻³ |
−13.617 |
|
1.55 × 10⁻³ |
−9.362 |
|
1.43 × 10⁻³ |
−6.759 |
|
1.28 × 10⁻³ |
−3.231 |
Figure 12.16 is a graph of ln k versus 1 . In practice, the equation of the line (slope and y-intercept) that best fits these plotted data points would be derived using a statistical process called regression. This is helpful for most experimental data because a perfect fit of each data point with the line is rarely encountered. For the data here, the fit is nearly perfect and the slope may be estimated using any two of the provided data pairs. Using the first and last data points permits estimation of the slope.
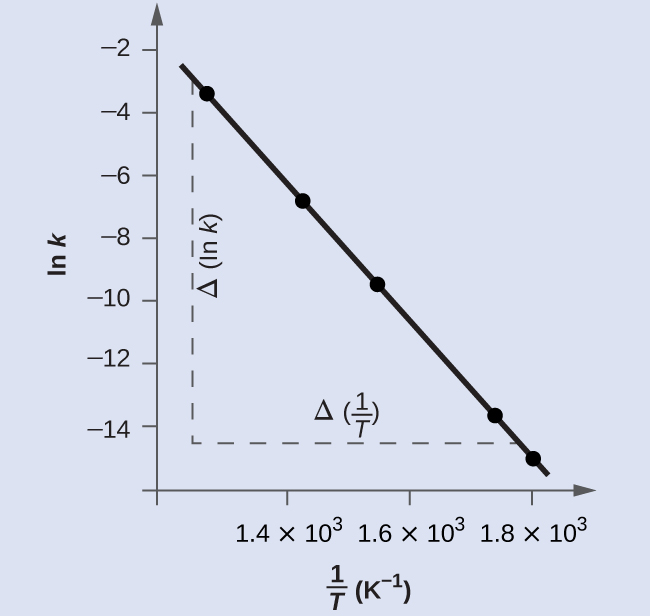
[latex]\begin{array}{r @{{}\;{}} l} \text{Slope} = & \frac{{\Delta}(\text{ln}\;k)}{{\Delta}(\frac{1}{T})} \\[0.5em] = & \frac{(-14.447)\;-\;(-2.593)}{(1.78\;\times\;10^{-3}\text{K}^{-1})\;-\;(1.25\;\times\;10^{-3}\text{K}^{-1})} \\[0.5em] = & \frac{-11.854}{0.53\;\times\;10^{-3}\;\text{K}^{-1}} = 2.2\;\times\;10^4\;\text{K} \\[0.5em] = & -\frac{E_{\text{a}}}{R} \end{array}[/latex]
[latex]\text{ln}\;\frac{k_1}{k_2} = \frac{E_{\text{a}}}{R}\;(\frac{1}{T_2}\;-\;\frac{1}{T_1})[/latex]
[latex]E_{\text{a}} = -R\;\left(\frac{\text{ln}\;k_2\;-\;\text{ln}\;k_1}{(\frac{1}{T_2})\;-\;(\frac{1}{T_1})}\right)[/latex]
Any two data pairs may be substituted into this equation—for example, the first and last entries from the above data table:
[latex]E_{\text{a}} = -8.314\;\text{J mol}^{-1}\;\text{K}^{-1}\;(\frac{-3.231\;-\;(-14.860)}{1.28\;\times\;10^{-3}\;\text{K}^{-1}\;-\;1.80\;\times\;10^{-3}\;\text{K}^{-1}})[/latex]
and the result is Ea = 185,900 J/mol.
This approach yields the same result as the more rigorous graphical approach used above, as expected. In practice, the graphical approach typically provides more reliable results when working with actual experimental data.
Check Your Learning
The rate constant for the rate of decomposition of N2O5 to NO and O2 in the gas phase is 1.66 L/mol/s at 650 K and 7.39 L/mol/s at 700 K:
2N2O5(g) ⟶ 4NO(g) + 3O2(g)
Assuming the kinetics of this reaction are consistent with the Arrhenius equation, calculate the activation energy for this decomposition.
Answer: 1.1 × 10⁵ J mol−1 or 110 kJ mol−1
