
3 Supply and Demand
3.1 Demand
Review Activities
Directions: Drag the labels to their proper locations.
Directions: Which shifter would be affected for each change?
Directions: What impact will the following situations have on demand?
Problems
Problem 3.1.1: Draw a properly labeled demand graph. Show what would happen if the price of the good represented by the demand graph increased.
Answer: See video
Problem 3.1.2: Draw a properly labeled demand graph. Show what would happen if the demand for the good increased.
Answer: See video
Problem 3.1.3: Complete the following table to complete the market demand schedule.
| P | QD1 | QD2 | QD3 | QM |
| $1 | 12 | 30 | 24 | |
| $2 | 9 | 27 | 20 | |
| $3 | 7 | 21 | 16 | |
| $4 | 6 | 17 | 12 | |
| $5 | 5 | 11 | 4 |
Answer: 66, 56, 44, 35, 20
External Resources
Khan Academy - Law of Demand
Khan Academy - Market versus Individual Demand
Khan Academy - Price of Related Goods
Khan Academy - Demand Expectations
Khan Academy - Shift in Demand (Income, population, and preferences)
Khan Academy - Income Part I
Khan Academy - Income Part II
3.2 Supply
Review Activities
Directions: Drag the labels to their proper locations.
Directions: Which shifter will be affected by each of the following issues?
Directions: What impact will each of the following scenarios have on supply?
Problems
Problem 3.2.1: Draw a properly labeled supply graph. Show what would happen if the price of the good represented by the supply graph increased.
Answer: See video
Problem 3.2.2: Draw a properly labeled supply graph. Show what would happen if the supply for the good increased.
Answer: See video
External Resources
Khan Academy - Law of Supply
Khan Academy - Change in Supply versus Change in Quantity Supplied
Khan Academy - Factors Affecting Supply
3.3 putting supply and demand together
Review Activities
Problems
Problem 3.3.1: Draw a properly labeled graph that is in equilibrium.
Answer: See video
Problem 3.3.2: Consider the market described by the following demand and supply equations:
[latex]Q_D=210-6P[/latex]
[latex]Q_S=-30+2P[/latex]
- Calculate the equilibrium price and quantity in this market.
- Suppose that the market price is set to $20. Is there a shortage or surplus? How large of one?
- Suppose that the market price is set to $35. Is there a shortage or surplus? How large of one?
Answers: P*=$30, Q*=30; Shortage of 80; Surplus of 40
Problem 3.3.3: Consider the market described by the following demand and supply equations:
[latex]Q_D=2000-6P[/latex]
[latex]Q_S=-400+2P[/latex]
- Calculate the equilibrium price and quantity in this market.
- Suppose that the market price is set to $250. Is there a shortage or surplus? How large of one?
- Suppose that the market price is set to $325. Is there a shortage or surplus? How large of one?
Answers: P*=$300, Q*=200; Shortage of 400; Surplus of 200
Problem 3.3.4: [Hard question...not indicative of exam questions] Consider the market described by the following demand and supply equations:
[latex]Q_D=a-bP[/latex]
[latex]Q_S=-c+dP[/latex]
[latex]a,b,c,d>0[/latex]
Calculate the equilibrium price and quantity in this market.
Answers: P*=(a+c)/(b+d); Q*=(ad-bc)/(b+d)
Problem 3.3.5: Consider the market described in the demand and supply schedules below:
| P | QD | QS |
| $1 | 58 | 9 |
| $2 | 52 | 14 |
| $3 | 47 | 18 |
| $4 | 41 | 21 |
| $5 | 36 | 26 |
| $6 | 30 | 30 |
| $7 | 24 | 35 |
| $8 | 16 | 39 |
- Find the equilibrium price and quantity in this market.
- Suppose that the market price is set to $2. Is there a shortage or surplus? How large of one?
- Suppose that the market price is set to $7. Is there a shortage or surplus? How large of one?
Answers: P*=$6, Q*=30; Shortage of 38; Surplus of 11
External Resources
Khan Academy - Market Equilibrium
3.4 modeling market disequilibrium
Review Activities
No review activities for section 3.4.
Problems
Problem 3.4.1: For each of the following I have given you an event and a market. Start by drawing a market in initial equilibrium with proper labels. Then, decide whether supply or demand is being impacted and for what reason (demand: income, number of consumers, expectations (demand), price of related goods, taste, taxes or supply: input prices, number of suppliers, expectations (supply), price of alternative goods, technology, taxes). Which market failure occurs after the shift? How does the market return to equilibrium? Finally, compare the original equilibrium price and quantity (pre-shift) to the new equilibrium price and quantity.
- Event: A recession occurs which causes income levels to fall nationally. Market: Fast food, which people view as an inferior good
Answer: Increase in demand (income level for inferior good), shortage, upward price pressure, price and quantity increase
- Event: A new licensing requirement reduces the number of barbers and hair stylists. Market: Haircuts
Answer: Decrease in supply (decrease in number of suppliers), shortage, upward price pressure, increase in price and decrease in quantity
- Event: After Oprah makes an economics book her book of the month, economics texts become wildly popular and everyone wants to have one. Market: Economic books
Answer: Increase in demand (tastes), shortage, upward price pressure, increase in price and quantity
- Event: Two local fast food restaurants close, Market: fast food
Answer: Decrease in supply (number of suppliers down), shortage, upward price pressure, increase in price, decrease in quantity
- Event: Parachute pants come back into style, Market: parachute pants
Answer: Decrease in demand (taste), Surplus, downward price pressure, decrease in price and quantity
- Event: People expect the price of gasoline to fall in the coming days, Market: gasoline (today)
Answer: Decrease in demand (expected future price will be lower), surplus, downward price pressure, decrease in price and quantity
- Event: The price of Pepsi increases, Market: Coca-Cola (a competitor of Pepsi)
Answer: Increase in demand for Coca-Cola (price of substitute increases), shortage, upward price pressure, increase in price and quantity
- Event: A new planting method increases crop yield of beets, Market: beets
Answer: Increase in supply (technology), Surplus, downward price pressure, decrease in price, increase in quantity
Problem 3.4.2: Consider these situations where two things are changing. Start with a supply and demand graph in equilibrium (properly labeled.) Next, show the effect of each change on the given curve. Finally, show the new equilibrium after both shifts and compare the initial equilibrium price and quantity to the new equilibrium price and quantity.
- Events: Income levels fall and input costs rise, Market: Cars (normal good)
Answer: End result is an ambiguous change in price and a decrease in quantity.
- Events: Population declines and popularity diminishes, Market: Roller skating rinks
Answer: The end result is a decrease in price and quantity.
- Events: Price of Coca-Cola increases and Pepsi-Cola can now fill bottles 20% faster, Market: Pepsi-Cola (a substitute of Coca-Cola).
Answer: The final result is a decrease in price and an ambiguous change in quantity.
External Resources
Khan Academy - Changes in Market Equilibrium
Khan Academy - Changes in equilibrium price and quantity when supply and demand changes
3.5 price controls
Review Activities
Problems
Problem 3.5.1:
Consider the market described by the following demand and supply equations:
[latex]Q_D=210-6P[/latex]
[latex]Q_S=-30+2P[/latex]
- Calculate the equilibrium price and quantity in this market. (You have already done this, but it may be helpful to have it again.)
- Suppose that the government institutes a price floor of $20. Is the market in equilibrium? If not, what market failure is occurring? How large is it?
- Suppose that the government institutes a price ceiling of $20. Is the market in equilibrium? If not, what market failure is occurring? How large is it?
- Suppose that the government institutes a price floor of $35. Is the market in equilibrium? If not, what market failure is occurring? How large is it?
- Suppose that the government institutes a price ceiling of $35. Is the market in equilibrium? If not, what market failure is occurring? How large is it?
Answers: P*=$30, Q*=30; equilibrium; shortage of 80; surplus of 40; equilibrium
Problem 3.5.2:
Consider the market described by the following demand and supply equations:
[latex]Q_D=2000-6P[/latex]
[latex]Q_S=-400+2P[/latex]
- Calculate the equilibrium price and quantity in this market. (You have already done this, but it may be helpful to have it again.)
- Suppose that the government institutes a price floor of $250. Is the market in equilibrium? If not, what market failure is occurring? How large is it?
- Suppose that the government institutes a price ceiling of $250. Is the market in equilibrium? If not, what market failure is occurring? How large is it?
- Suppose that the government institutes a price floor of $325. Is the market in equilibrium? If not, what market failure is occurring? How large is it?
- Suppose that the government institutes a price ceiling of $325. Is the market in equilibrium? If not, what market failure is occurring? How large is it?
Answers: P*=$300, Q*=200; equilibrium; shortage of 400; surplus of 200; equilibrium
Problem 3.5.3:
Consider the market described by the following demand and supply schedules:
| Price | QD | QS |
| 1 | 300 | 200 |
| 2 | 290 | 230 |
| 3 | 270 | 270 |
| 4 | 240 | 350 |
| 5 | 200 | 450 |
| 6 | 150 | 650 |
| 7 | 90 | 900 |
| 8 | 10 | 1,200 |
- What is the equilibrium price and quantity in the market?
- How many units will be sold if there is a price floor of $2? Is the market in equilibrium? If not, is there a shortage or a surplus? How large?
- How many units will be sold if there is a price ceiling of $2? Is the market in equilibrium? If not, is there a shortage or a surplus? How large?
- How many units will be sold if there is a price floor of $5? Is the market in equilibrium? If not, is there a shortage or a surplus? How large?
- How many units will be sold if there is a price ceiling of $5? Is the market in equilibrium? If not, is there a shortage or a surplus? How large?
Answers: P*=3, Q=270; 270 units sold, market in equilibrium; 230 units sold, shortage of 60; 200 units sold, surplus of 250; 270 units sold, market in equilibrium.
Problem 3.5.4:
Consider the market show by the demand and supply graph below:
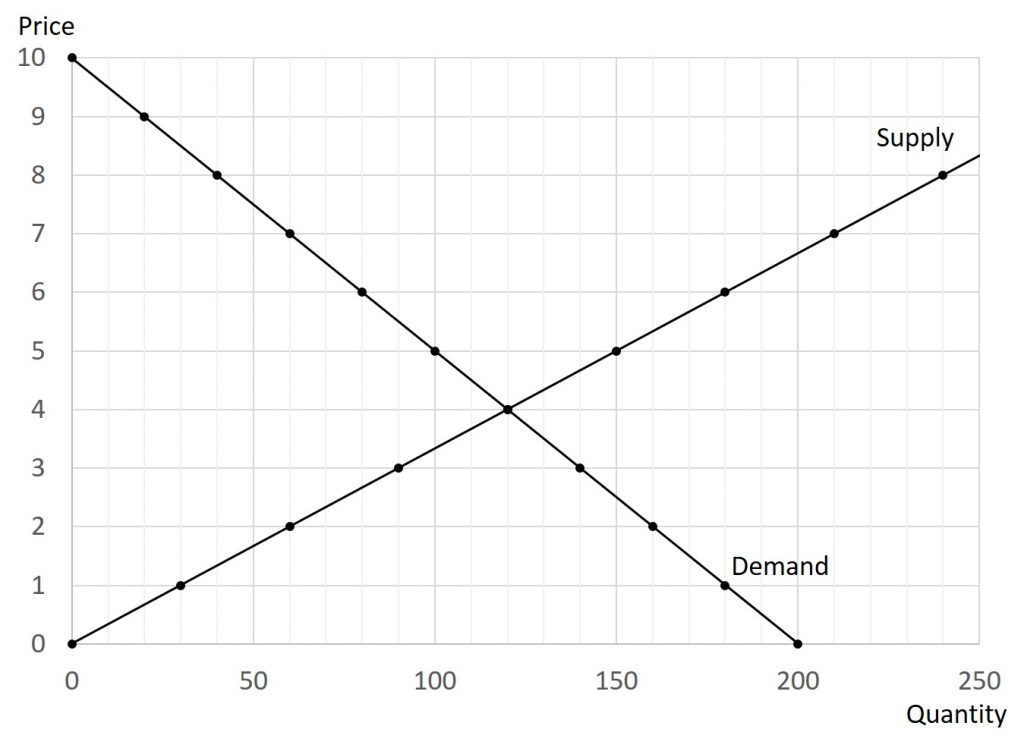
- What is the equilibrium price and quantity in this market?
- Suppose that the price of the good is set at $3. How many units will be sold? Is the market in equilibrium? If not, what market failure is occurring? How large is it?
- How many units will be sold if there is a price floor of $6? Is the market in equilibrium? If not, what market failure is occurring? How large is it?
- How many units will be sold if there is a price ceiling of $6? Is the market in equilibrium? If not, what market failure is occurring? How large is it?
- How many units will be sold if there is a price floor of $2? Is the market in equilibrium? If not, what market failure is occurring? How large is it?
- How many units will be sold if there is a price ceiling of $2? Is the market in equilibrium? If not, what market failure is occurring? How large is it?
Answers: P*=$4, Q*=120; 90 units sold, shortage of 50 units; 80 units sold, surplus of 100 units; 120 units sold, equilibrium; 120 units sold, equilibrium; 60 units sold; shortage of 100 units
