
7 Perfect Competition
7.1 An Introduction to market structures
Review Activities
No review activities for this section. Note: A summary of market structures can be found in chapter 10.
Problems
No problems for this section.
External Resources
No videos for this section.
7.2 An introduction to perfect competition
Review Activities
Problems
No problems for this section.
External Resources
Khan Academy: Introduction to Perfect Competition
7.3 profit in perfect competition in the short-run
Review Activities
Problems
Problem 7.3.1: Consider a perfectly competitive market where the market price is $9. Complete the revenue table below.
| Quantity | Price | Total Revenue | Average Revenue | Marginal Revenue |
| 0 | XX | XX | ||
| 1 | ||||
| 2 | ||||
| 3 | ||||
| 4 | ||||
| 5 |
Solutions: $9, $0; $9, $9, $9, $9; $9, $18, $9, $9; $9, $27, $9, $9; $9, $36, $9, $9; $9, $45, $9, $9
Problem 7.3.2: A perfectly competitive firm sells its products for $10. Complete the table below. Find the following: profit-maximizing price, profit-maximizing quantity, and greatest possible profit. Be sure to use the profit-maximization condition to find the profit-maximizing quantity.
| Q | P | TR | TC | Tπ | MR | MC |
| 0 | 40 | XX | XX | |||
| 1 | 42 | |||||
| 2 | 48 | |||||
| 3 | 56 | |||||
| 4 | 66 | |||||
| 5 | 78 | |||||
| 6 | 93 | |||||
| 7 | 113 | |||||
| 8 | 143 |
Solutions: See video for table. P=$10, Q=4, π=-$26
Problem 7.3.3: A perfectly competitive firm sells its products for $30. Complete the table below. Find the following: profit-maximizing price, profit-maximizing quantity, and greatest possible profit. Be sure to use the profit-maximization condition to find the profit-maximizing quantity.
| Q | P | TR | TC | Tπ | MR | MC |
| 0 | 40 | |||||
| 1 | 45 | |||||
| 2 | 55 | |||||
| 3 | 70 | |||||
| 4 | 90 | |||||
| 5 | 115 | |||||
| 6 | 145 | |||||
| 7 | 185 | |||||
| 8 | 245 |
Solutions: See video for table. P=$30, Q=6, π=$35.
Problem 7.3.4: A perfectly competitive firm sells its products for $300. Complete the table below. Find the following: profit-maximizing price, profit-maximizing quantity, and greatest possible profit. Be sure to use the profit-maximization condition to find the profit-maximizing quantity.
| Q | P | TR | TC | Tπ | MR | MC |
| 0 | 100 | |||||
| 1 | 200 | |||||
| 2 | 400 | |||||
| 3 | 700 | |||||
| 4 | 1,100 | |||||
| 5 | 1,600 | |||||
| 6 | 2,200 | |||||
| 7 | 2,900 |
Solutions: See video for table. P=$300, Q=3, π=$200.
Problem 7.3.5: Use the graph below to calculate the following: total revenue, total cost, and profit. To accomplish this, you do need to find the profit-maximizing price and quantity.
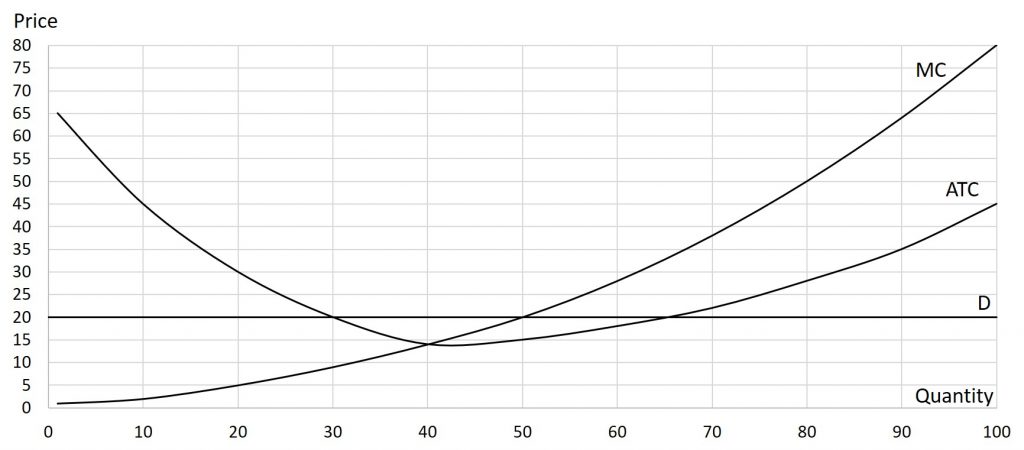
Solutions: P=$20, Q=50, TR=$1,000, TC=$750, Tπ=$250
Problem 7.3.6: Use the graph below to calculate the following: total revenue, total cost, and profit. To accomplish this, you do need to find the profit-maximizing price and quantity.
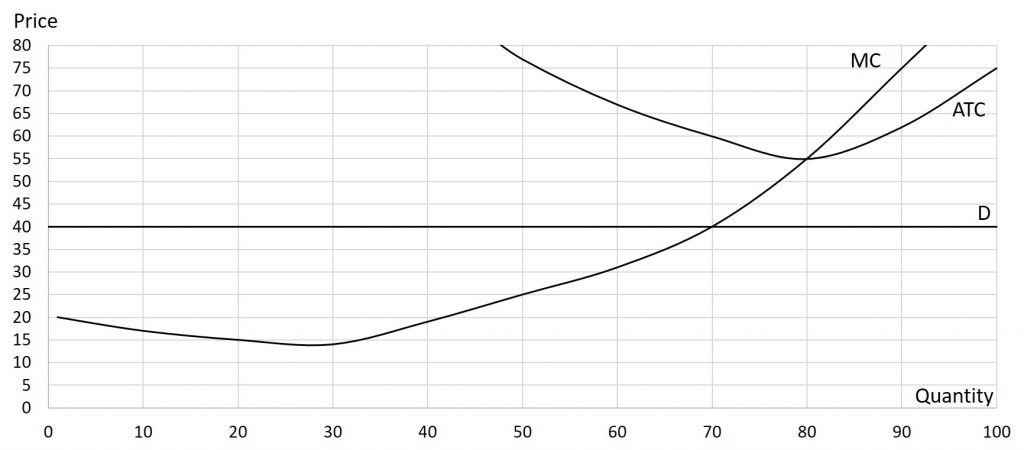
Solutions: P=$40, Q=70, TR=$2,800, TC=$4,200, Tπ=-$1,400
Problem 7.3.7: Use the graph below to calculate the following: total revenue, total cost, and profit. To accomplish this, you do need to find the profit-maximizing price and quantity.
Solutions: P=30, Q=40, TR=$1,200, TC=$1,200, Tπ=$0
External Resources
Khan Academy: Economic Profit for Firms in Perfectly Competitive Markets
7.4 shutdown in the short-run
Review Activities
Problems
Problem 7.4.1: Use the graph below to determine if the firm is earning a profit. If the firm is not earning a profit, should they remain open or temporarily shutdown? Finally, sketch the supply curve on the graph.
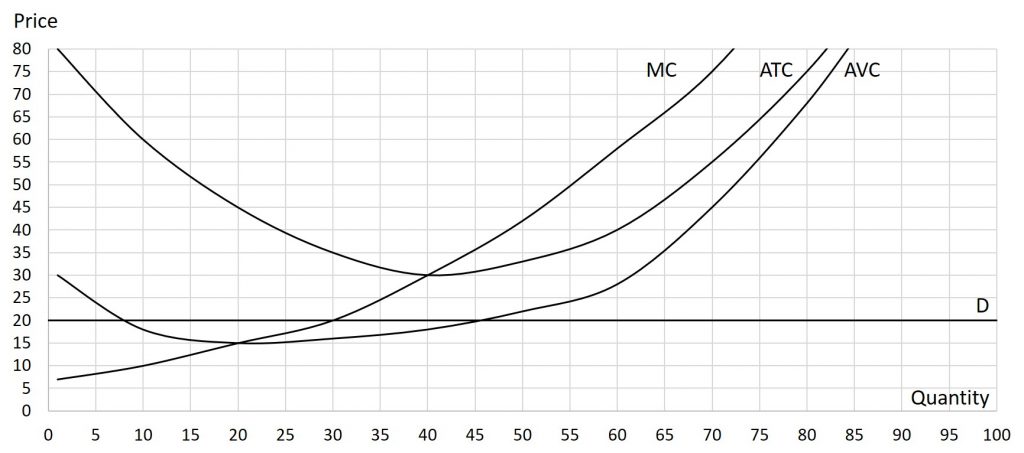
Solutions: Q=30, firm is earning an economic loss but should remain open.
Problem 7.4.2: Use the graph below to determine if the firm is earning a profit. If the firm is not earning a profit, should they remain open or temporarily shutdown? Finally, sketch the supply curve on the graph.
Solutions: Q=55, firm is earning a profit (thus should remain open).
Problem 7.4.3: Use the graph below to determine if the firm is earning a profit. If the firm is not earning a profit, should they remain open or temporarily shutdown? Finally, sketch the supply curve on the graph.
Solutions: Q=50, firm is earning an economic loss and should temporarily close.
External Resources
Khan Academy: Exit Decisions
7.5 entry and exit decisions in the long-run
Review Activities
Problems
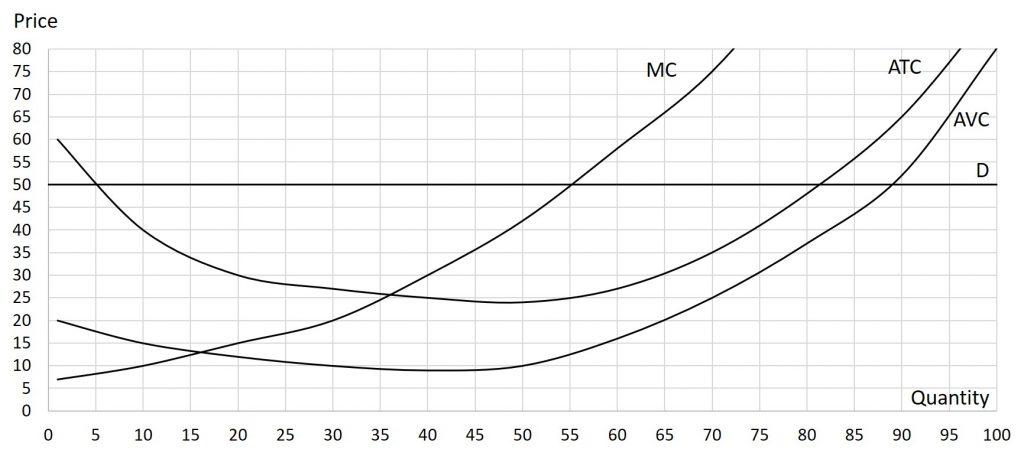
Problem 7.5.1: Determine what will happen to the number of firms in this industry in the long-run. Show the impact of this on the market supply and demand curves in addition to the impact on the market price. What will happen to the graph below when these changes occur.
Solutions: Q=50, Firms are earning an economic profit so new firms will enter the market. This causes an increase in supply in the good. An increase in supply leads to a reduction to the market price. This causes the demand curve to shift downward until it intersects at the intersection of MC and ATC. At this point firms are earning no economic profit so no new firms enter the market.
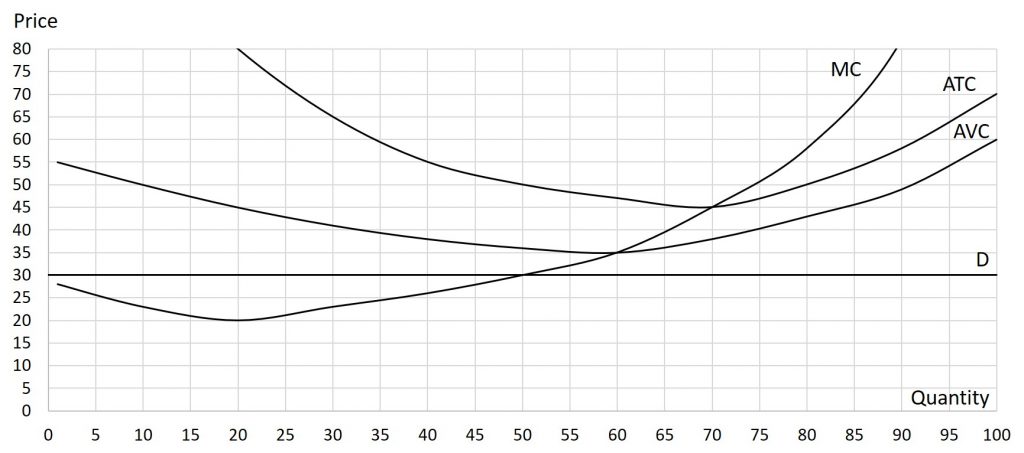
Problem 7.5.2: Determine what will happen to the number of firms in this industry in the long-run. Show the impact of this on the market supply and demand curves in addition to the impact on the market price. What will happen to the graph below when these changes occur.
Solutions: Q=70, Firms are losing money so firms exit the market. This causes a decrease in supply in the good. A decrease in supply leads to an increase in the market price. This causes the demand curve to shift upward until it intersects at the intersection of MC and ATC. At this point firms are earning no economic profit so no additional firms exit the market.
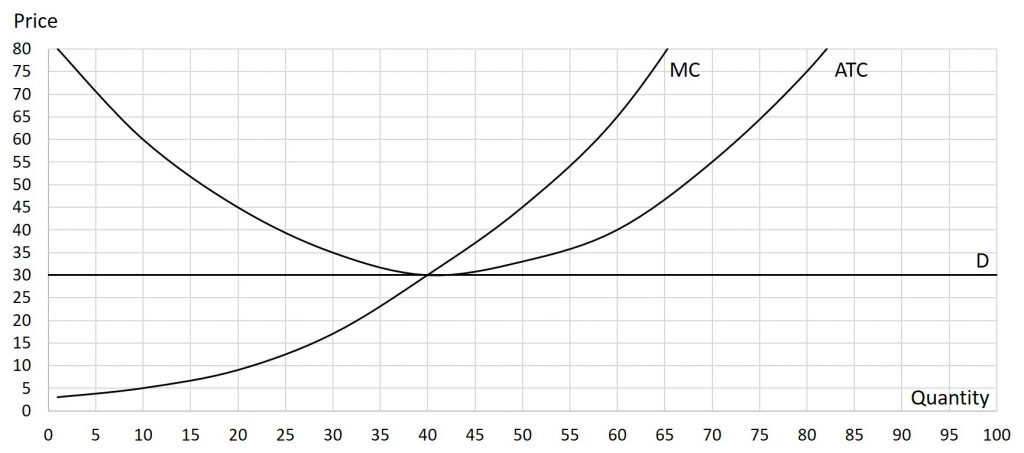
Problem 7.5.3: Determine what will happen to the number of firms in this industry in the long-run. Show the impact of this on the market supply and demand curves in addition to the impact on the market price. What will happen to the graph below when these changes occur.
Solutions: Q=40. At this point, firms are earning zero economic profit, so no new firms enter the market nor do any firms leave the market. The market supply is not affected.
External Resources
Khan Academy: Long-run Economic Profit for Perfectly Competitive Firms
