
1.4 Functions: Domain & Range
Learning Objectives
In this section, you will:
Find the domain of a function defined by an equation.
Relating Set-builder Notation to Interval Notation
Finding Domain and Range from a Graph
Finding Domain and Ranges of ToolKit Functions
Graph piecewise-defined functions.
This section discuses the important concept of domain and range for a function. In addition, the section reviews interval notation and set-builder notation which is used to mathematically communicate the domain and range for functions.
Interval Notation Review
Before we begin, let us review the conventions of interval notation:
- The smallest term from the interval is written first.
- The largest term in the interval is written second, following a comma.
- Parentheses, ( or ), are used to signify that an endpoint is not included, called exclusive.
- Brackets, [ or ], are used to indicate that an endpoint is included, called inclusive.
See Figure 3 for a summary of interval notation.
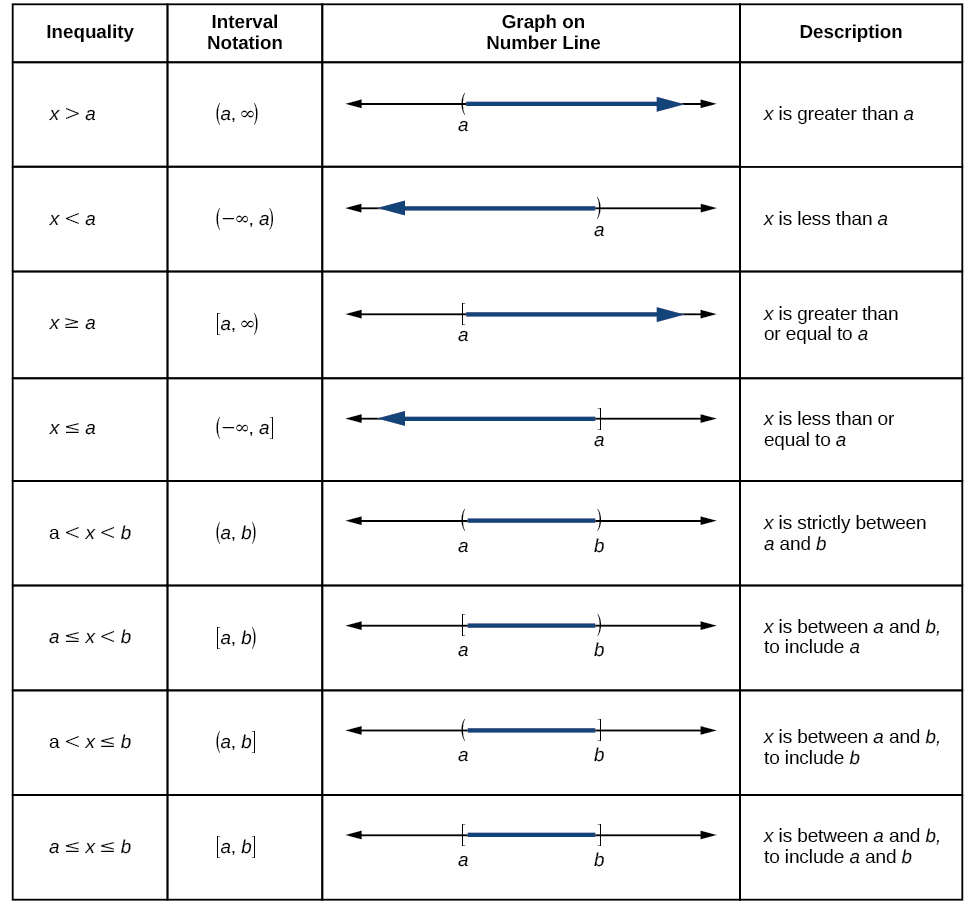
Figure 3
Finding the Domain of a Function Defined by an Equation
In Functions: Notation and Representations, we were introduced to the concepts of domain and range. In this section, we will practice determining domains and ranges for specific functions. Keep in mind that, in determining domains and ranges, we need to consider what is physically possible or meaningful in real-world examples. We also need to consider what is mathematically permitted. For example, we cannot include any input value that leads us to take an even root of a negative number if the domain and range consist of real numbers. Or in a function expressed as a formula, we cannot include any input value in the domain that would lead us to divide by 0.
We can visualize the domain as a “holding area” that contains “raw materials” for a “function machine” and the range as another “holding area” for the machine’s products. See Figure 2.
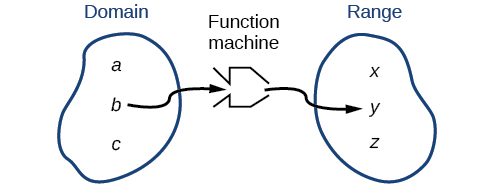
Figure 2
We can write the domain and range in interval notation, which uses values within brackets to describe a set of numbers. In interval notation, we use a square bracket [ when the set includes the endpoint and a parenthesis ( to indicate that the endpoint is either not included or the interval is unbounded. For example, if a person has $100 to spend, they would need to express the interval that is more than 0 and less than or equal to 100 and write (0, 100].
Let’s turn our attention to finding the domain of a function whose equation is provided. Oftentimes, finding the domain of such functions involves remembering three different forms.
- If the function has no denominator or an odd root, consider whether the domain could be all real numbers.
- If there is a denominator in the function’s equation, exclude values in the domain that force the denominator to be zero.
- If there is an even root, consider excluding values that would make the radicand negative.
Example 1: Finding the Domain of a Function as a Set of Ordered Pairs
Find the domain of the following function:
Solution
First identify the input values. The input value is the first coordinate in an ordered pair. There are no restrictions, as the ordered pairs are simply listed. The domain is the set of the first coordinates of the ordered pairs.
[latex]\{2,3,4,5,6\}[/latex]
Try It #1
Find the domain of the function: [latex]\{(-5,4),(0,0),(5,-4),(10,-8),(15,-12)\}[/latex]
How to Find the Domain of Function in Equation Form
Given a function written in equation form, find the domain.
- Identify the input values.
- Identify any restrictions.
- If there is a denominator in the function’s formula, set the denominator equal to zero and solve for . If the function’s formula contains an even root, set the radicand greater than or equal to 0, and then solve.
- If there is an even root, exclude any real numbers that result in a negative number in the radicand. Set up an inequality with the radicand greater than or equal to zero and solve for the unknown.
- Exclude values found in Step 2 from the domain.
- Write the domain in interval form, if possible.
Example 2: Finding the Domain of a Function (No restrictions found)
Find the domain of the function
Solution
The input value, shown by the variable, x in the equation, is squared and then the result is lowered by one. Any real number may be squared and then be lowered by one, so there are no restrictions on the domain of this function. The domain is the set of real numbers.
In interval form, the domain of [latex]f \text { is }(-\infty, \infty) \text {. }[/latex]
Try It #2
Find the domain of the function: [latex]f(x)=5-x+x^{3} .[/latex]
Example 3: Finding the Domain of a Function Involving a Denominator (Restriction #1)
Find the domain of the function
Solution
When there is a denominator, we want to include only values of the input that do not force the denominator to be zero. So, we will set the denominator equal to 0 and solve for x.
Now, we will exclude 2 from the domain. The answers are all real numbers where [latex]x<2 \text { or } x>2[/latex]
We can use a symbol known as the union, [latex]\cup[/latex]
to combine the two sets. In interval notation, we write the solution: [latex](-\infty, 2) \cup(2, \infty)[/latex]
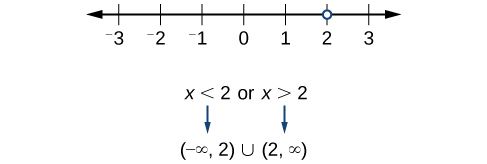
Figure 4
In interval form, the domain of [latex]f \text { is }(-\infty, 2) \cup(2, \infty) \text {. }[/latex]
Try It #3
Find the domain of the function: [latex]f(x)=\frac{1+4 x}{2 x-1}[/latex]
Example 4: Finding the Domain of a Function with an Even Root (Restriction #2)
Find the domain of the function [latex]f(x)=\sqrt{7-x}[/latex]
Solution
When there is an even root in the formula, we exclude any real numbers that result in a negative number in the radicand.
Set the radicand greater than or equal to zero and solve for x.
[latex]\begin{array}{l} 7-x \geq 0 \\ -x \geq-7 \\ x \leq 7 \end{array}[/latex]
Now, we will exclude any number greater than 7 from the domain. The answers are all real numbers less than or equal to
Try It #4
Find the domain of the function: [latex]f(x)=\sqrt{5+2 x}[/latex]
Quick Question: Can there be functions in which the domain and range do not intersect at all?
Yes. For example, the function [latex]f(x)=-\frac{1}{\sqrt{x}}[/latex] has the set of all positive real numbers as its domain but the set of all negative real numbers as its range.
As a more extreme example, a function’s inputs and outputs can be completely different categories (for example, names of weekdays as inputs and numbers as outputs, as on an attendance chart), in such cases the domain and range have no elements in common.
Relating Set Builder Notation to Interval Notation
In the previous examples, we used inequalities, lists and interval notation to describe the domain of functions. We can also use inequalities, or other statements that might define sets of values or data, to describe the behavior of the variable with set-builder notation. Let's look at the anatomy or set-builder notation with the example below:
[latex]\{x \mid 10 \leq x<30\}[/latex]
- The x indicates the variable in the set-builder notation.
- The braces {} are read as “the set of,”
- The vertical bar | is read as “such that,”
Thus, we would read the above example as “the set of x-values such that 10 is less than or equal to
Figure 5 compares inequality notation, set-builder notation, and interval notation.
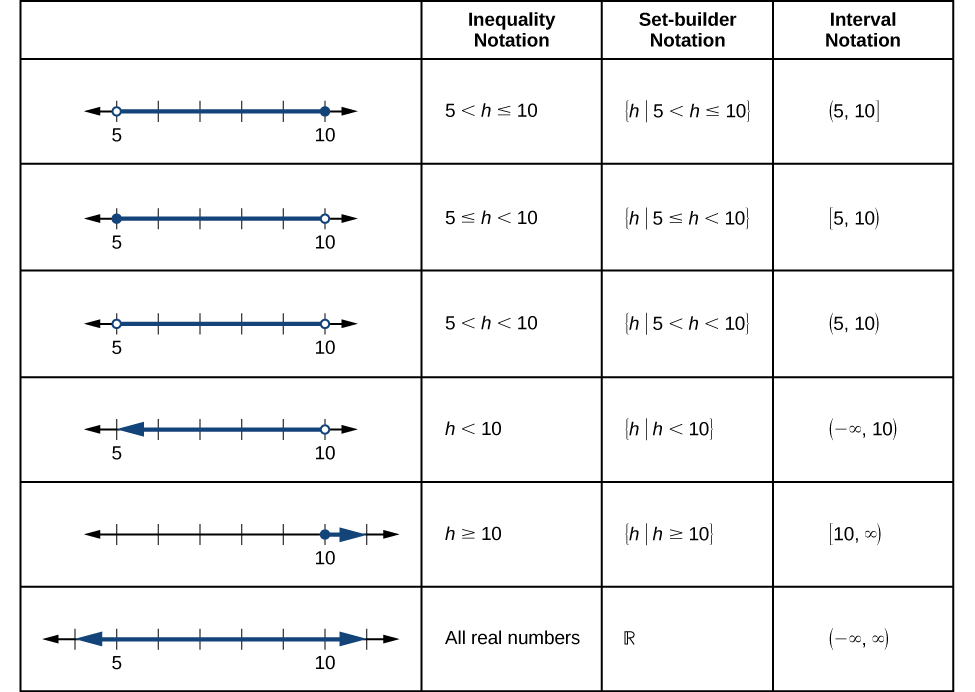
Figure 5
To combine two intervals using inequality notation or set-builder notation, we use the word “or.” As we saw in earlier examples, we use the union symbol,[latex]\cup[/latex], to combine two unconnected intervals. For example, the union of the sets [latex]\{2,3,5\} \text { and }\{4,6\}[/latex] is the set [latex]\{2,3,4,5,6\}[/latex]. It is the set of all elements that belong to one or the other (or both) of the original two sets.
For sets with a finite number of elements as above, the elements do not have to be listed in ascending order of numerical value. If the original two sets have some elements in common, those elements should be listed only once in the union set. For sets of real numbers on intervals, another example of a union is [latex]\{x| |x| \mid \geq 3\}=(-\infty,-3] \cup[3, \infty)[/latex].
Set-Builder Notation and Interval Notation
Set-Builder Notation and Interval Notation
Set-builder notation is a method of specifying a set of elements that satisfy a certain condition. It takes the form [latex]\{x \mid \text { statement about } x\}[/latex] which is read as, “the set of all x such that the statement about x is true.” For example,
[latex]\{x \mid 4 < x \leq 12\}[/latex]
Interval notation is a way of describing sets that include all real numbers between a lower limit that may or may not be included and an upper limit that may or may not be included. The endpoint values are listed between brackets or parentheses. A square bracket indicates inclusion in the set, and a parenthesis indicates exclusion from the set. The set-builder notation example would be written as [latex](4,12][/latex] in interval notation.
How To Use Interval Notation with a Line Graph (Number Line)
Given a line graph, describe the set of values using interval notation.
- Identify the intervals to be included in the set by determining where the heavy line (drawn line) overlays the real line graph (number line).
- At the left end of each interval, use either a [ or solid dot with each end value to be included in the set or use either a ( or open dot for each excluded end value.
- At the right end of each interval, use either a ] or solid dot with each end value to be included in the set or use either a ) or open dot for each excluded end value.
- If the number line extends to negative or positive infinity, always use parentheses at that end.
- Use the union symbol, [latex]\cap[/latex] to combine all intervals into one set.
Example 5: Describing Sets on the Real-Number Line
Describe the intervals of values shown in Figure 6 using inequality notation, set-builder notation, and interval notation.
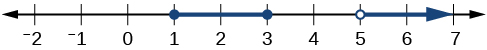
Figure 6
Solution
To describe the values, x, included in the intervals shown, we would say, “x is a real number greater than or equal to 1 and less than or equal to 3, or a real number greater than 5.”
[latex]\begin{array}{|l|l|} \hline \text { Inequality } & 1 \leq x \leq 3 \text { or } x>5 \\ \hline \text { Set-builder notation } & \{x \mid 1 \leq x \leq 3 \text { or } x>5\} \\ \hline \text { Interval notation } & {[1,3] \cup(5, \infty)} \\ \hline \end{array}[/latex]
Remember that, when writing or reading interval notation, using a square bracket means the boundary is included in the set. Using a parenthesis means the boundary is not included in the set.
Try It #5
Given Figure 7, specify the graphed set in
ⓐ words
ⓑ set-builder notation
ⓒ interval notation
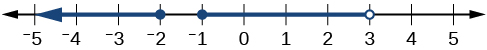
Figure 7
Finding Domain and Range from Graphs
Another way to identify the domain and range of functions is by using graphs. Because the domain refers to the set of possible input values, the domain of a graph consists of all the input values shown on the x-axis. The range is the set of possible output values, which are shown on the y-axis. Keep in mind that if the graph continues beyond the portion of the graph we can see, the domain and range may be greater than the visible values. See Figure 8.
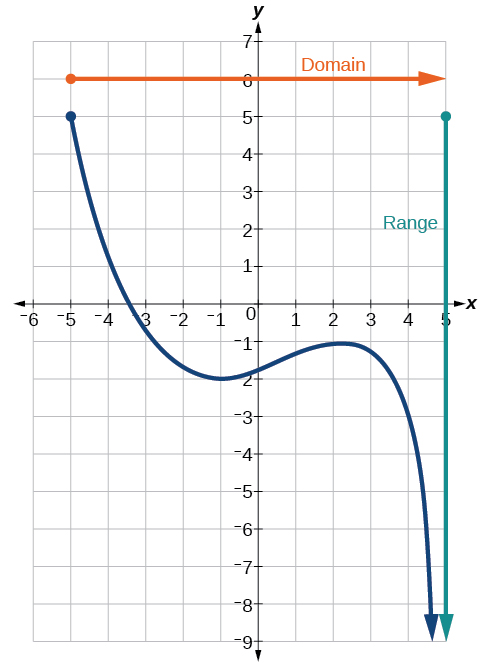
Figure 8
We can observe that the graph extends horizontally from -5 to the right without bound, so the domain is [latex][-5,\infty)[/latex]
The vertical extent of the graph is all range values 5 and below, so the range is [latex](-\infty, 5)[/latex]
Note: The domain and range are always written from smaller to larger values. For the domain, think as if you are reading a book and read from left to right. For the range, think of the phrase, "Bottoms up!" and read from the bottom of the graph to the top of the graph.
Example 6: Finding Domain and Range from a Graph
Find the domain and range of the function f
whose graph is shown in Figure 9.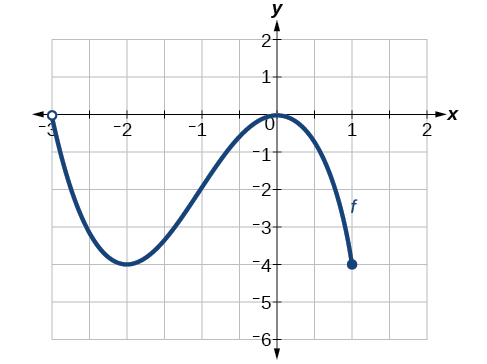
Figure 9
Solution
Reading the location of the function horizontally from left to right on the graph is an open circle at x-coordinate, –3, to a closed circle at x-coordinate, 1, so the domain off is (-3, 1].
eading the location of the function vertically from the bottom to the top of the graph shows an closed circle for y-coordinate, -4, to an open circle for y-coordinate, 0, so the range is [-4, -0)
See Figure 10.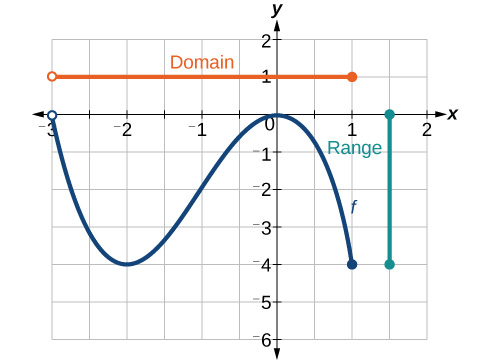
Figure 10
Example 7: Finding Domain and Range from a Graph of Oil Production
Find the domain and range of the function f
whose graph is shown in Figure 11.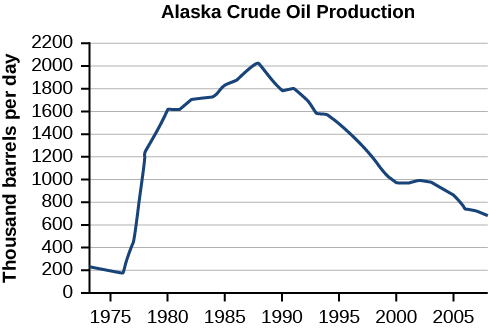
Figure 11 (credit: modification of work by the U.S. Energy Information Administration)
http://www.eia.gov/dnav/pet/hist/LeafHandler.ashx?n=PET&s=MCRFPAK2&f=A
Solution
The input quantity along the horizontal axis is “years,” which we represent with the variable t for time. The output quantity is “thousands of barrels of oil per day,” which we represent with the variable b for barrels. The graph may continue to the left and right beyond what is viewed, but based on the portion of the graph that is visible, we can determine the domain as
In interval notation, the domain is [1973, 2008], and the range is about [180, 2010]. For the domain and the range, we approximate the smallest and largest values since they do not fall exactly on the grid lines.
Quick Question: Can a function’s domain and range be the same?
Yes! For example, the domain and range of the cube root function are both the set of all real numbers.
Finding Domains and Ranges of the Toolkit Functions
We will now return to our set of toolkit functions to determine the domain and range of each.
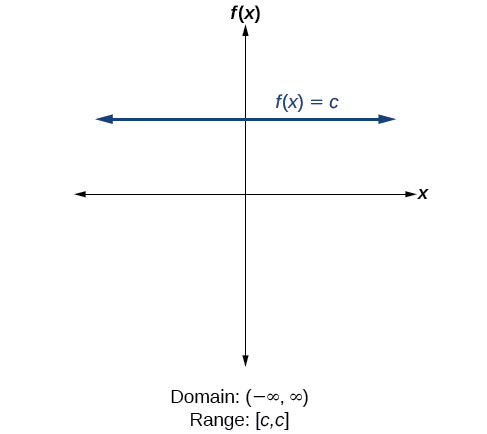
Figure 13
For the constant function [latex]f(x)=c[/latex], the domain consists of all real numbers; there are no restrictions on the input. The only output value is the constant c, so the range is the set {c} that contains this single element. In interval notation, this is written as [c,c], the interval that both begins and ends with c.
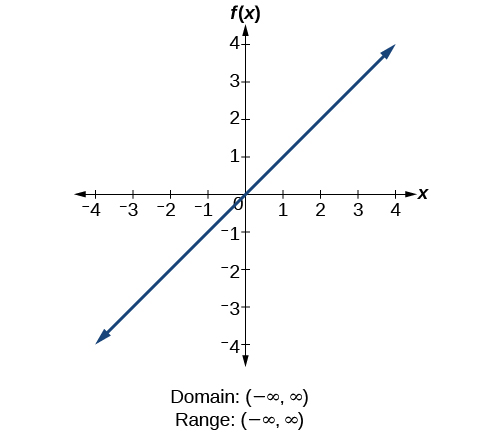
Figure 14
For the identity function [latex]f(x)=x,[/latex] there is no restriction on x. Both the domain and
range are the set of all real numbers.
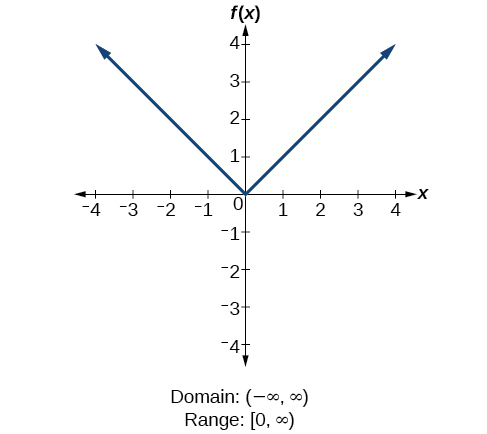
Figure 15
For the absolute value function [latex]f(x)=|x|,[/latex] there is no restriction on x.
However, because absolute value is defined as a distance from 0, the output can only be greater than or equal to 0.
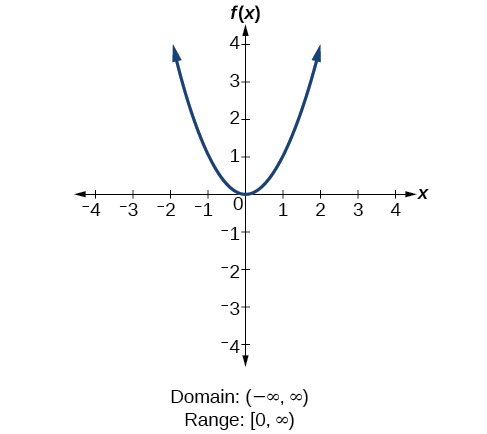
Figure 16
For the quadratic function [latex]f(x)=x^2,[/latex] the domain is all real numbers since the horizontal extent of the graph is the whole real number line. Because the graph does not include any negative values for the range, the range is only nonnegative real numbers.
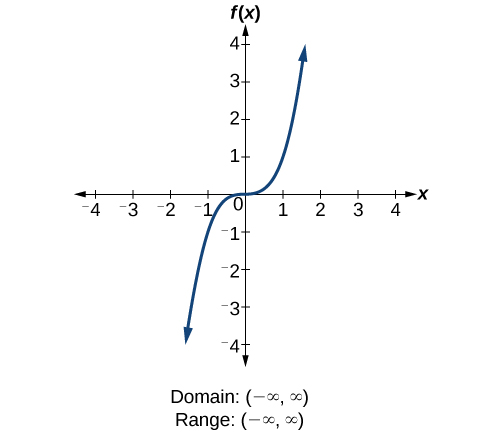
Figure 17
For the cubic function [latex]f(x)=x^3,[/latex] the domain is all real numbers because the horizontal extent of the graph is the whole real number line. The same applies to the vertical extent of the graph, so the domain and range include all real numbers.
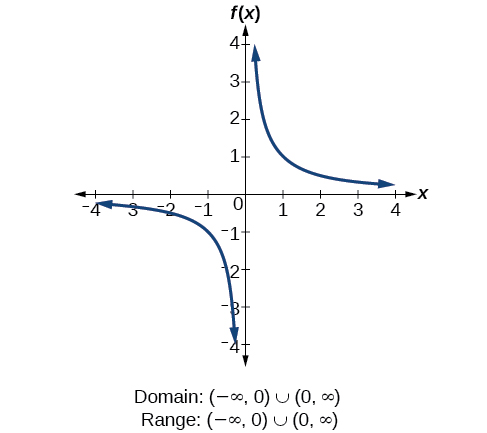
Figure 18 For the reciprocal function [latex]f(x)=\frac{1}{x},[/latex] we cannot divide by 0, so we must exclude 0 from the domain. Further, 1 divided by any value can never be 0, so the range also will not include 0. In set-builder notation, we could also write [latex]\{x \mid x \neq 0\}[/latex],the set of all real numbers that are not zero.
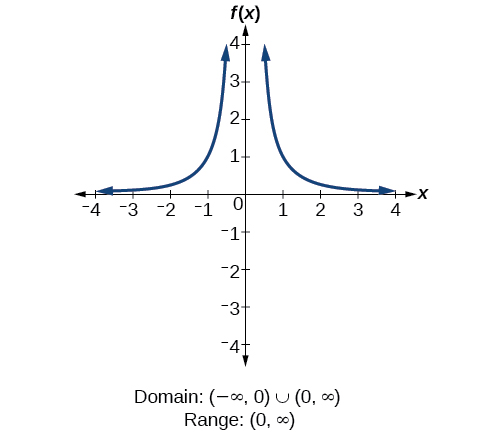
Figure 19
For the reciprocal squared function [latex]f(x)=\frac{1}{x^2}[/latex], we cannot divide by 0, so we must exclude 0 from the domain. There is also no x that can give an output of 0, so 0 is excluded from the range as well. Note that the output of this function is always positive due to the square in the denominator, so the range includes only positive numbers.
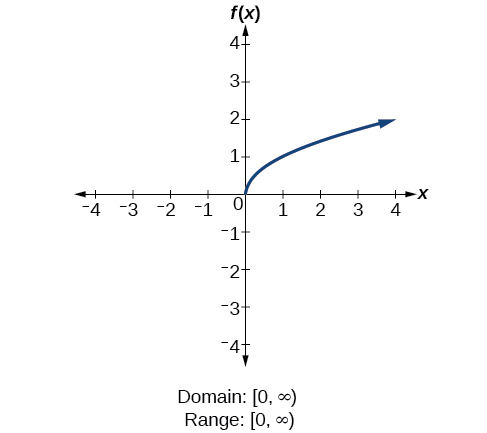
Figure 20
For the square root function [latex]f(x)=\sqrt{x}[/latex] we cannot take the square root of a negative real number, so the domain must be 0 or greater. The range also excludes negative numbers because the square root of a positive number x is defined to be positive, even though the square of the negative number -x also gives us x.
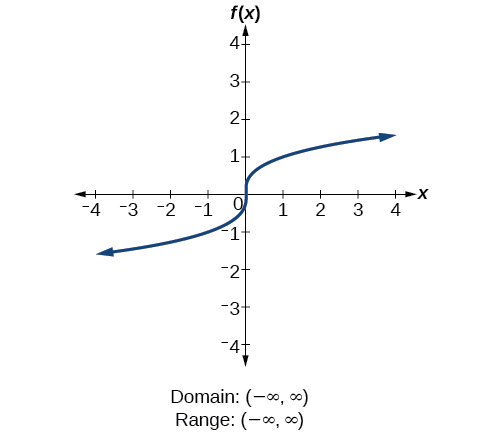
Figure 21
For the cube root function, [latex]f(x)=\sqrt{3}{x}[/latex] the domain and range include all real numbers. Note that there is no problem taking a cube root, or any odd-integer root, of a negative number, and the resulting output is negative (it is an odd function).
Example 8: Finding the Domain and Range Using Toolkit Functions
Find the domain and range of [latex]f(x)=2 x^{3}-x[/latex]
Solution
There are no restrictions on the domain, as any real number may be cubed and then subtracted from the result.
The domain is [latex](-\infty, \infty)[/latex] and the range is also [latex](-\infty, \infty)[/latex]
Example 9: Finding the Domain and Range Using Toolkit Functions
Find the domain and range of [latex]f(x)=\frac{2}{x+1}[/latex].
Solution
In examining this function, we can see it is a variant of the reciprocal function. We cannot evaluate the function at -1 because division by zero is undefined. The domain is [latex](-\infty,-1) \cup(-1, \infty)[/latex]. Because the function is never zero, we exclude 0 from the range. The range is [latex](-\infty, 0) \cup(0, \infty)[/latex].
Example 10
Finding the Domain and Range
Find the domain and range of [latex]f(x)=2 \sqrt{x+4}[/latex]
Solution
This function is a variation of the square root ToolKit function. We cannot take the square root of a negative number, so the value inside the radical must be nonnegative.
[latex]x+4 \geq 0 \text { when } x \geq-4[/latex]
The domain of f(x) is [-4,∞).
We then find the range. We know that f(-4) = 0, and the function value increases as x increases without any upper limit. We conclude that the range of f is [0,∞).
Note: It is helpful when examining a function to look at the graph of the function. We can use a graphing calculator or online tools such as Desmos (https://www.desmos.com/calculator) to help us visualize functions as we learn. Figure 22 represents the function f from Example 10. Domain and Range are often more directly found from a graph.
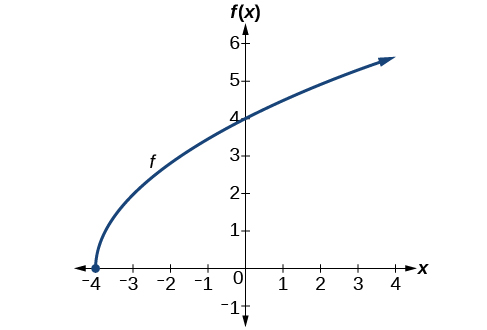
Figure 22
Try It #7
Using your knowledge of the ToolKit functions, find the domain and range of [latex]f(x)=-\sqrt{2-x}[/latex].
Graphing Piecewise-Defined Functions
Sometimes, we come across a function that requires more than one formula in order to obtain the given output. For example, in the toolkit functions, we introduced the absolute value function [latex]f(x)=|x|[/latex]
With a domain of all real numbers and a range of values greater than or equal to 0, absolute value can be defined as the magnitude, or modulus, of a real number value regardless of sign. It is the distance from 0 on the number line. All of these definitions require the output to be greater than or equal to 0.
If we input 0, or a positive value, the output is the same as the input, e.g. f(1) = 1.
[latex]f(x)=x \text { if } x \geq 0[/latex]
If we input a negative value, the output is the opposite of the input, e.g. f(-1)= 1.
[latex]f(x)=-x \text { if } x<0[/latex]
Because this requires two different processes or pieces, the absolute value function is an example of a piecewise function. A piecewise function is a function in which more than one formula is used to define the output over different pieces of the domain.
We use piecewise functions to describe situations in which a rule or relationship changes as the input value crosses certain “boundaries.” For example, we often encounter situations in business for which the cost per piece of a certain item is discounted once the number ordered exceeds a certain value. Tax brackets are another real-world example of piecewise functions. For example, consider a simple tax system in which incomes up to $10,000 are taxed at 10%, and any additional income is taxed at 20%. The tax on a total income S would be given as
[latex]0.1 S \text { if } S \leq \$ 10,000 \text { and } \$ 1000+0.2(S-\$ 10,000) \text { if } S>\$ 10,000 \text {. }[/latex]
Piecewise Function
A piecewise function is a function in which more than one formula is used to define the output. Each formula has its own domain, and the domain of the function is the union of all these smaller domains. We notate this idea like this:
[latex]f(x)=\left\{\begin{array}{ll} \text { formula } 1 & \text { if } x \text { is in domain 1 } \\ \text { formula } 2 & \text { if } x \text { is in domain } 2 \\ \text { formula } 3 & \text { if } x \text { is in domain } 3 \end{array}\right.[/latex]
In piecewise notation, the absolute value function is
[latex]|x|=\left\{\begin{array}{l} x \quad \text { if } x \geq 0 \\ -x \text { if } x<0 \end{array}\right.[/latex]
How to Write the Formula and Find Domain of a Piecewise Function
Given a piecewise function, write the formula and identify the domain for each interval.
- Identify the intervals for which different rules apply.
- Determine formulas that describe how to calculate an output from an input in each interval.
- Use braces and if-statements to write the function.
Example 11: Writing a Piecewise Function
A museum charges $5 per person for a guided tour with a group of 1 to 9 people or a fixed $50 fee for a group of 10 or more people. Write a function relating the number of people, n, to the cost, C.
Solution
Two different formulas will be needed. For n-values under 10, C=5n. For values of n that are 10 or greater, C=50.
[latex]C(n)=\left\{\begin{array}{llc}5 n & \text { if } & 0 < n < 10 \\50 & \text { if } & n \geq 10\end{array}\right.[/latex]
Analysis
The function is represented in Figure 23. The graph is a diagonal line from n=0 to n=10 and a constant after that. In this example, the two formulas agree at the meeting point where n=10, so we can create a single continuous graph. Not all piecewise functions have this property.
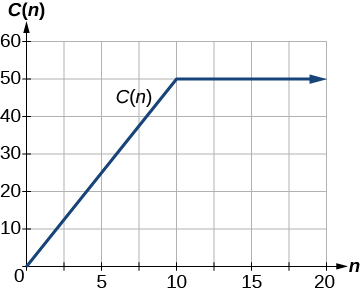
Figure 23
Example 12: Working with a Piecewise Function
A cell phone company uses the function below to determine the cost C in dollars for g gigabytes of data transfer.
[latex]C(g)=\left\{\begin{array}{ccc} 25 & \text { if } & 0 < g < 2 \\ 25+10(g-2) & \text { if } & g \geq 2 \end{array}\right.[/latex]
Find the cost of using 1.5 gigabytes of data and the cost of using 4 gigabytes of data.
Solution
To find the cost of using 1.5 gigabytes of data, C(1.5), we first look to see which part of the domain our input falls in. Because 1.5 is less than 2, we use the first formula.
[latex]C(1.5)=$25[/latex]
To find the cost of using 4 gigabytes of data, C(4), we see that our input of 4 is greater than 2, so we use the second formula.
[latex]C(4)=25+10(4-2)=$45[/latex]
Analysis
The function is represented in Figure 24. We can see where the function changes from a constant to a shifted and stretched identity at g=2.
We plot the graphs for the different formulas on a common set of axes, making sure each formula is applied on its proper domain.
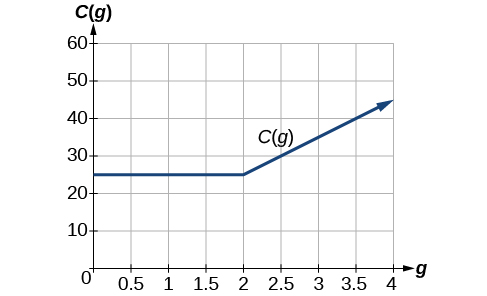
Figure 24
How To Sketch a Graph of a Piecewise Function
Given a piecewise function, sketch a graph.
- Evaluate each piece of the function using the boundary values defined by the intervals on each piece of the domain.
- Taking note of the type of inequality, graph the coordinate pairs for each boundary.
- For inclusive inequalities, use a solid dot.
- For non-inclusive, use an open dot
- If the boundaries overlap, no dot is needed and the function graphs may be drawn continuously.
- Do not graph two functions over one interval because it would violate the criteria of a function.
Example 13: Graphing a Piecewise Function
Sketch a graph of the function.
[latex]f(x)=\left\{\begin{array}{ccc} x^2 & \text { if } & x \leq 1 \\ 3 & \text { if } & 12 \end{array}\right.[/latex]
Solution
Each of the component functions is from our library of toolkit functions, so we know their shapes. We can imagine graphing each function and then limiting the graph to the indicated domain. At the endpoints of the domain, we draw open circles to indicate where the endpoint is not included because of a less-than or greater-than inequality; we draw a closed circle where the endpoint is included because of a less-than-or-equal-to or greater-than-or-equal-to inequality.
Figure 25 shows the three components of the piecewise function graphed on separate coordinate systems. This is solely to demonstrate the separate pieces and is not a necessary step.
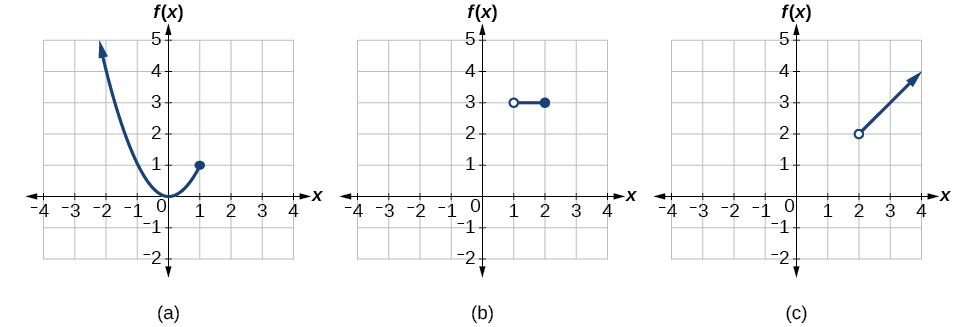
Figure 25 [latex]\text { (a) } f(x)=x^{2} \text { if } x \leq 1 \text {; (b) } f(x)=3 \text { if } 12[/latex]
Now that we have sketched each piece individually, we combine them in the same coordinate plane. See Figure 26.
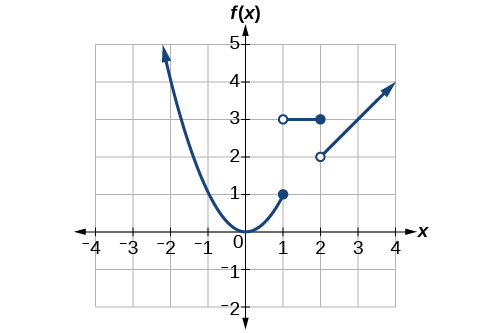
Figure 26
Analysis
Note that the graph does pass the vertical line test even at x=1 and x=2 because the points (1,3) and (2,2) are not part of the graph of the function, though (1,1) and (2, 3) are.
Try It #8
Graph the following piecewise function.
[latex]f(x)=\left\{\begin{array}{ccc} x^3 & \text { if } & x < -1 \\ -2 & \text { if } & -1 < x < 4 \\\ sqrt x & \text { if } & x > 4 \end{array}\right.[/latex]
Quick Question: Can more than one formula from a piecewise function be applied to a value in the domain?
No. Each value corresponds to one equation in a piecewise formula.
