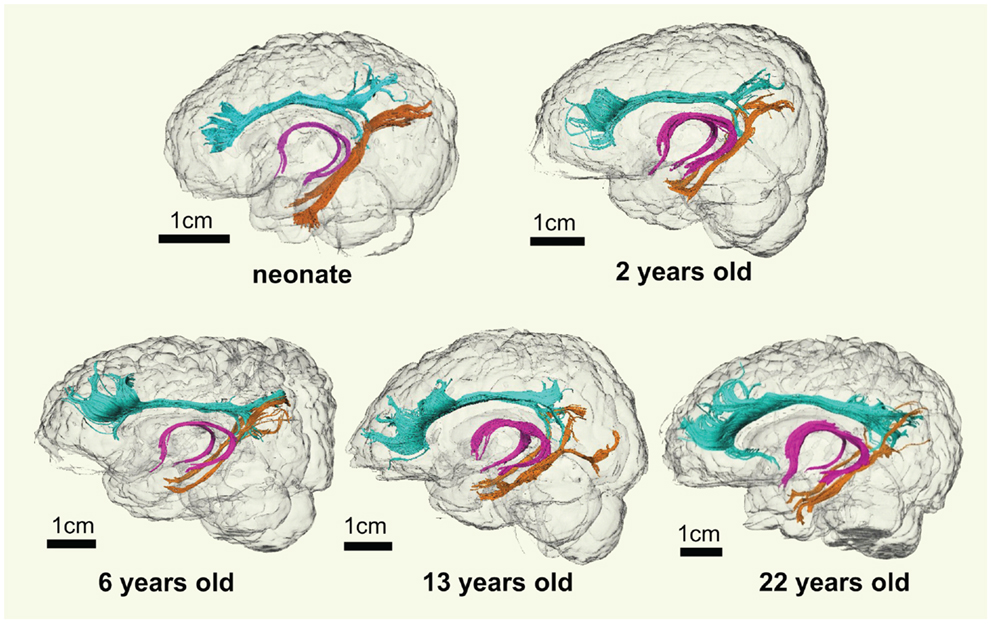
3.2 Post-natal Brain Development
Viewing the shape of brain at birth, reveals an organ that externally looks smaller, but similar in shape to the adult brain. The internal structure, however, is still under construction. The number of synapses continues to dramatically increase after birth. This increase in synaptic growth, called synaptogenesis, results in an increase in synaptic density. There is a relatively rapid period of growth until around the age of two years. This process is strongly influenced by the experiences the individual has. The synapses that are used continue to grow and branch. Other synapses begin to die off. Figure 3.2 shows the changes in relative growth of white and grey matter. Areas related to vision matures rapidly, with rapid growth during infancy and full maturity by age 10. Other areas are much slower to mature. The frontal cortex is the last to fully mature.
Link to Learning
Myelination and other glial development
Glial cells begin to form after most neurons are generated. Glial cells form throughout life. Myelin formation is an important part of learning. Myelinization within the brain is a slow process. It begins after birth and continues until around 18 years of age. Myelin develops in different parts of the brain at different rates. See Figure 3.3 for a visual representation of the pattern of maturation of myelin within the cortex. The frontal lobe is the last region of the brain to be fully myelinated.