Appendix E: Water Properties
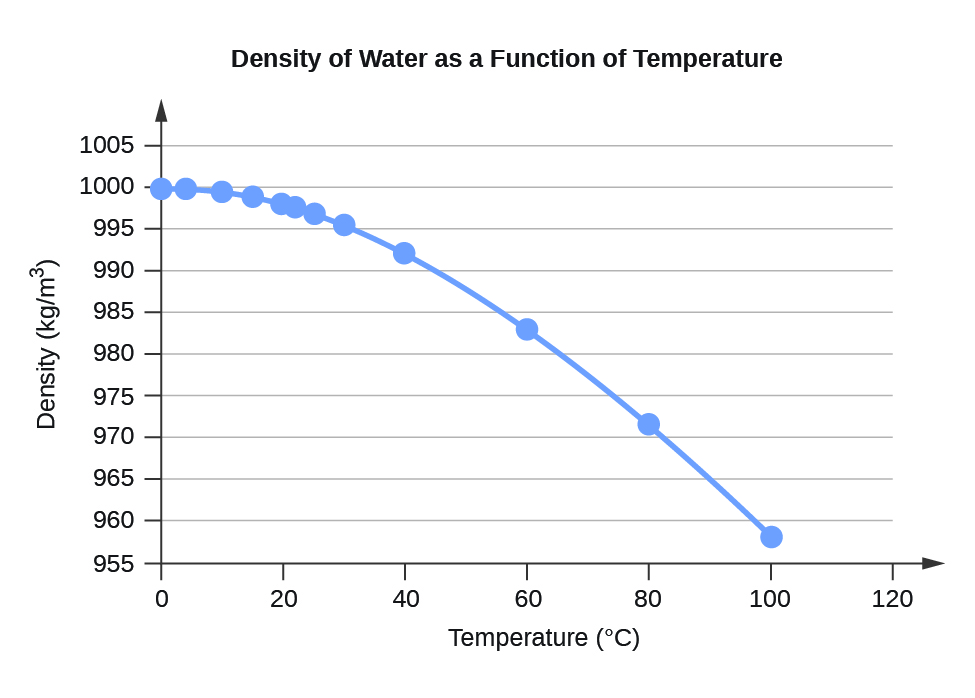
| Water Density (kg/m3) at Different Temperatures (°C) | |
|---|---|
| Temperature[1] | Density |
| 0 | 999.8395 |
| 4 | 999.9720 (density maximum) |
| 10 | 999.7026 |
| 15 | 999.1026 |
| 20 | 998.2071 |
| 22 | 997.7735 |
| 25 | 997.0479 |
| 30 | 995.6502 |
| 40 | 992.2 |
| 60 | 983.2 |
| 80 | 971.8 |
| 100 | 958.4 |
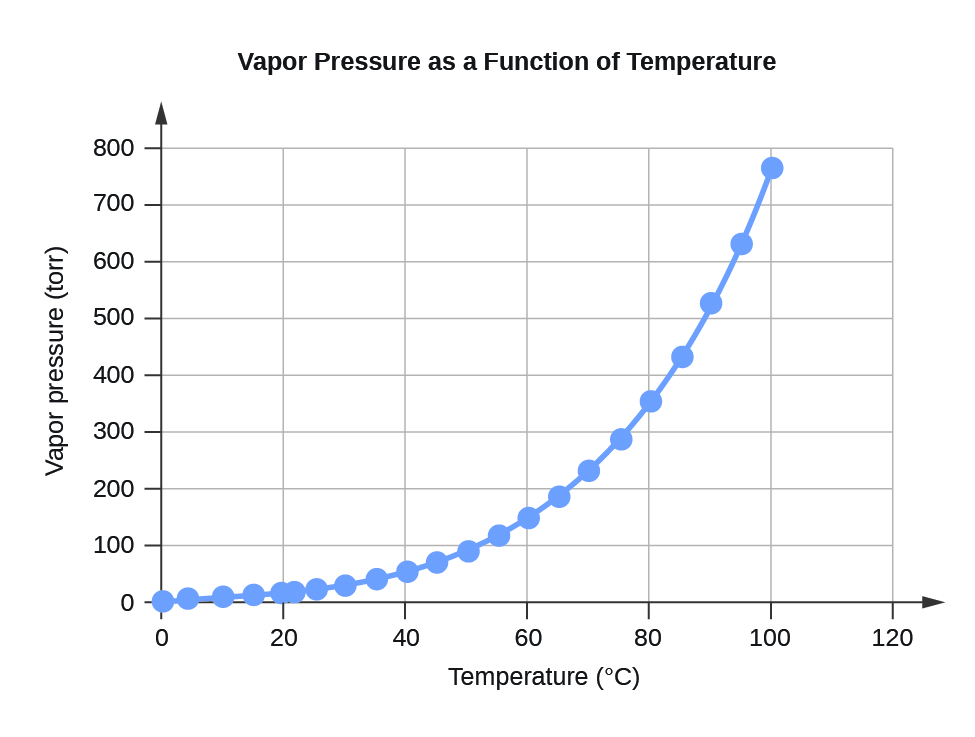
| Water Vapor Pressure at Different Temperatures (°C) | ||
|---|---|---|
| Temperature | Vapor Pressure (torr) | Vapor Pressure (Pa) |
| 0 | 4.6 | 613.2812 |
| 4 | 6.1 | 813.2642 |
| 10 | 9.2 | 1226.562 |
| 15 | 12.8 | 1706.522 |
| 20 | 17.5 | 2333.135 |
| 22 | 19.8 | 2639.776 |
| 25 | 23.8 | 3173.064 |
| 30 | 31.8 | 4239.64 |
| 35 | 42.2 | 5626.188 |
| 40 | 55.3 | 7372.707 |
| 45 | 71.9 | 9585.852 |
| 50 | 92.5 | 12332.29 |
| 55 | 118.0 | 15732 |
| 60 | 149.4 | 19918.31 |
| 65 | 187.5 | 24997.88 |
| 70 | 233.7 | 31157.35 |
| 75 | 289.1 | 38543.39 |
| 80 | 355.1 | 47342.64 |
| 85 | 433.6 | 57808.42 |
| 90 | 525.8 | 70100.71 |
| 95 | 633.9 | 84512.82 |
| 100 | 760.0 | 101324.7 |
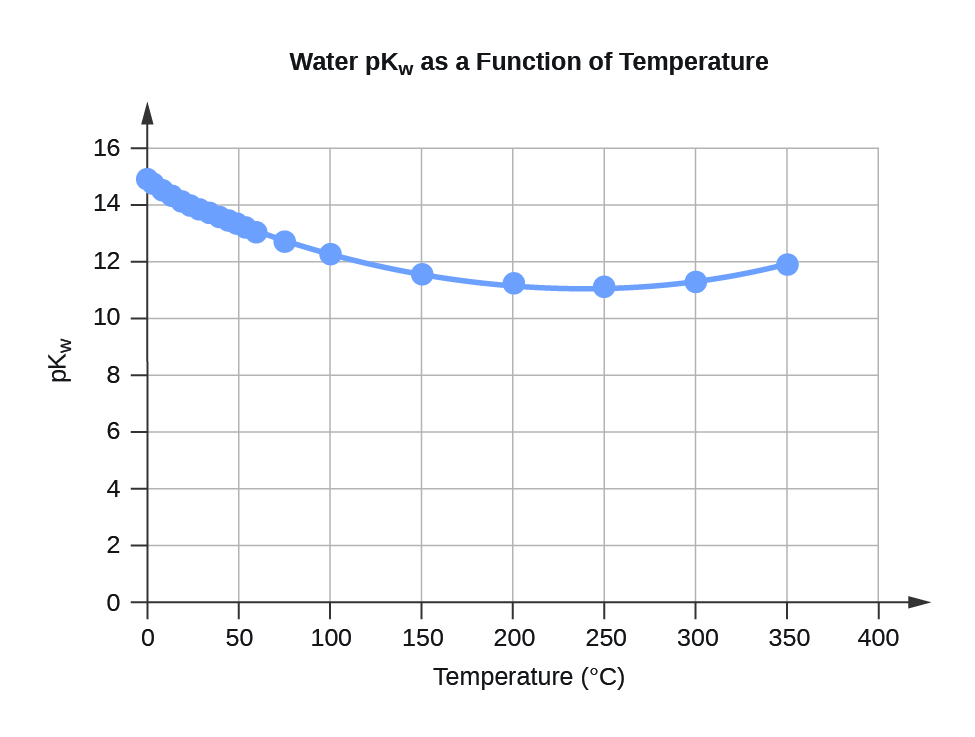
| Water Kw and pKw at Different Temperatures (°C) | ||
|---|---|---|
| Temperature | Kw 10–14 | pKw[2] |
| 0 | 0.112 | 14.95 |
| 5 | 0.182 | 14.74 |
| 10 | 0.288 | 14.54 |
| 15 | 0.465 | 14.33 |
| 20 | 0.671 | 14.17 |
| 25 | 0.991 | 14.00 |
| 30 | 1.432 | 13.84 |
| 35 | 2.042 | 13.69 |
| 40 | 2.851 | 13.55 |
| 45 | 3.917 | 13.41 |
| 50 | 5.297 | 13.28 |
| 55 | 7.080 | 13.15 |
| 60 | 9.311 | 13.03 |
| 75 | 19.95 | 12.70 |
| 100 | 56.23 | 12.25 |
| Specific Heat Capacity for Water |
|---|
| C°(H2O(l)) = 4184 J∙K−1∙kg−1 = 4.184 J∙g-1∙°C-1 |
| C°(H2O(s)) = 1864 J∙K−1∙kg−1 |
| C°(H2O(g)) = 2093 J∙K−1∙kg−1 |
| Standard Water Melting and Boiling Temperatures and Enthalpies of the Transitions | ||
|---|---|---|
| Temperature (K) | ΔH (kJ/mol) | |
| melting | 273.15 | 6.088 |
| boiling | 373.15 | 40.656 (44.016 at 298 K) |
| Water Cryoscopic (Freezing Point Depression) and Ebullioscopic (Boiling Point Elevation) Constants |
|---|
| Kf = 1.86°C∙kg∙mol−1 (cryoscopic constant) |
| Kb = 0.51°C∙kg∙mol−1 (ebullioscopic constant) |