
6.2 Core Description: Sedimentology, Petrology and More
All Hands on deck!: Collaboration at sea
Over nearly four decades, JOIDES Resolution sailed more than 538,000 nautical miles, drilled over 2,500 holes, and recovered more than 322 kilometers of core samples from oceans worldwide. Studying such a diversity of rocks and sediments required an international team of specialists for each of its nearly 200 scientific expeditions. In this section, you’ll meet these experts, learn about their methods and understand how what information they contributed to the core descriptions.
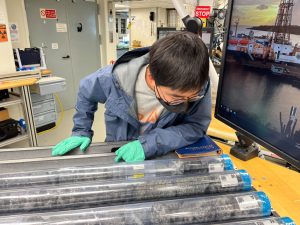
Core description was a team effort, often involving sedimentologists, paleontologists, petrologists, and structural geologists, depending on what type of material was recovered. Observations and measurements were made on both the whole core and the half that would be archived, while the other ‘working half’ was reserved for sampling and deeper analyses. Scientists examined the split cores visually and microscopically, noting structural and depositional features, and making preliminary interpretations of the depositional, diagenetic, and tectonic processes. From the working half, they selected key samples for detailed onboard studies. Digital images, along with physical property data such as color reflectance and magnetic susceptibility, added further insight into the core’s geologic history—layer by layer and even grain by grain.
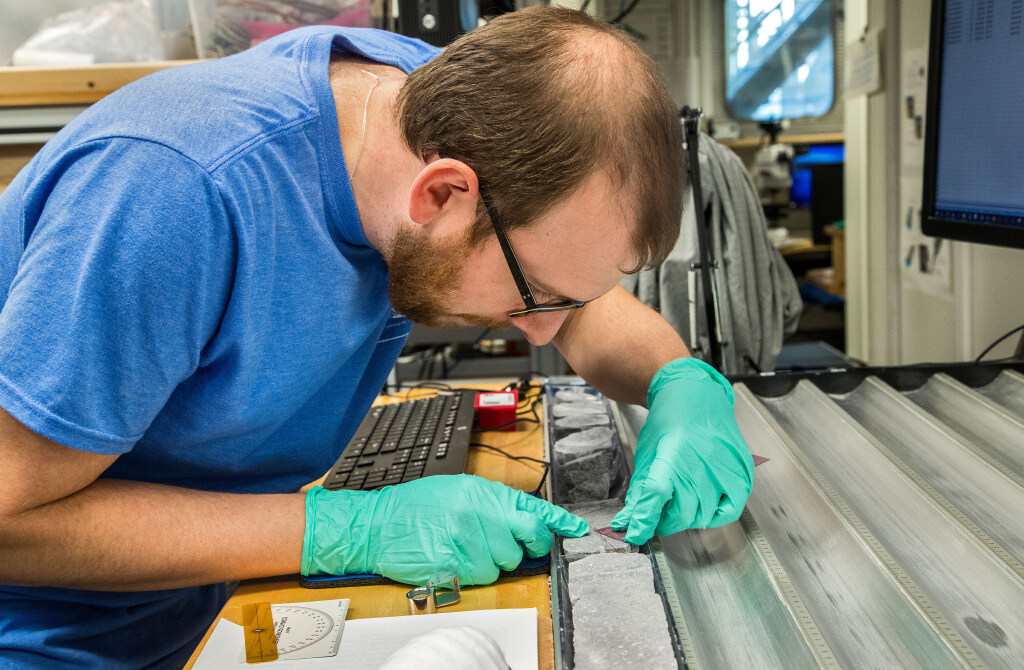
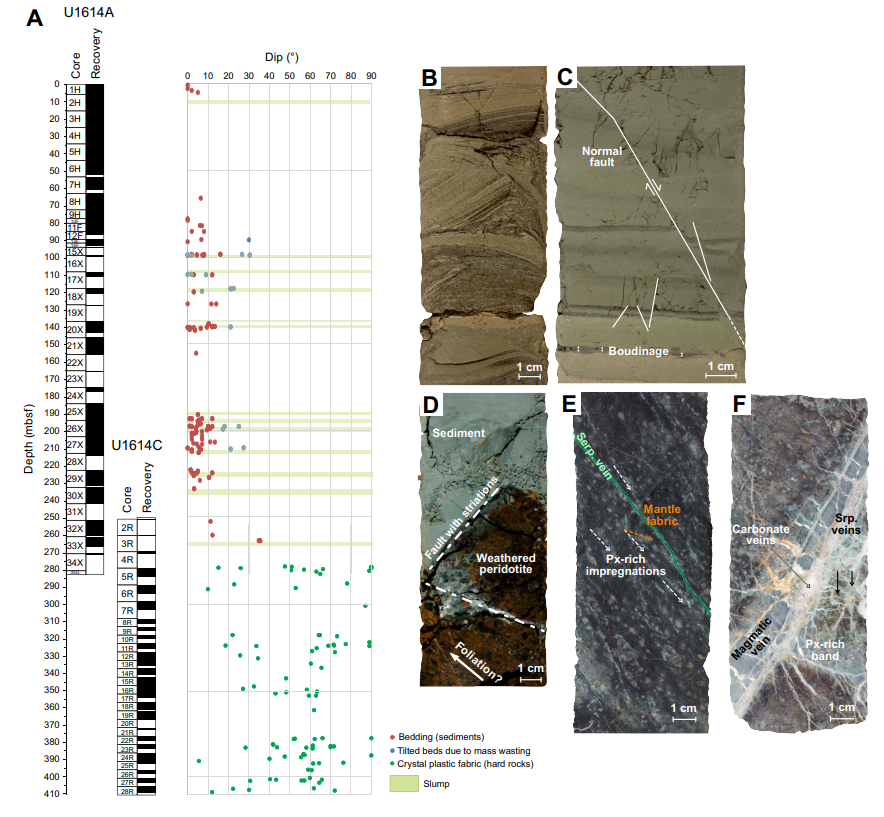
Structural geologists examined cores for alteration as well as signs of strain like folds, fractures, faults, and veins to decipher the forces that made them. Was the stress caused by tectonic movements, gravitational or fluid pressure, thermal changes, or maybe even disturbance from the drilling process itself? These specialists studied features at both small and large scales to answer these questions.
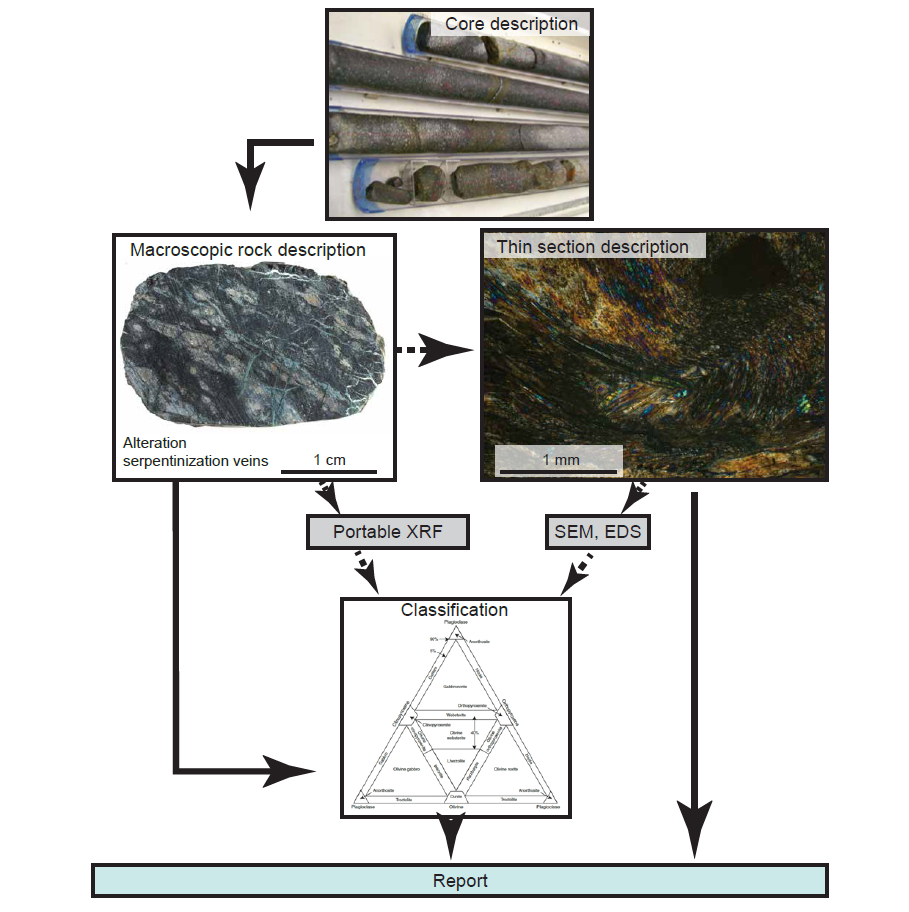
Igneous and Metamorphic Petrologists studied the mineral content, texture relationships and alteration of rocks to understand the history of volcanism and the ocean crust. They followed the Rock Description Flow Chart shown above. This data was used to interpret the geologic history of the core section.
Sedimentologists described and interpreted sedimentary facies, textures, structures, and depositional environments. They inspected the core visually, recorded the grain size, lithology, color and texture and as well as sign of bioturbation. Their work was supported by smear-slide analyses, explained below as well as by X-ray images of the core.
Carbonate analysis was used to measure the calcium carbonate (CaCO₃) content of sediment samples. This information shed light on the biogenic component of the sediment (e.g., from coccolithophores, foraminifera, coral and shelled organisms) and could help to reconstruct the palaeoceanographic, paleoclimatic, and diagenetic conditions.
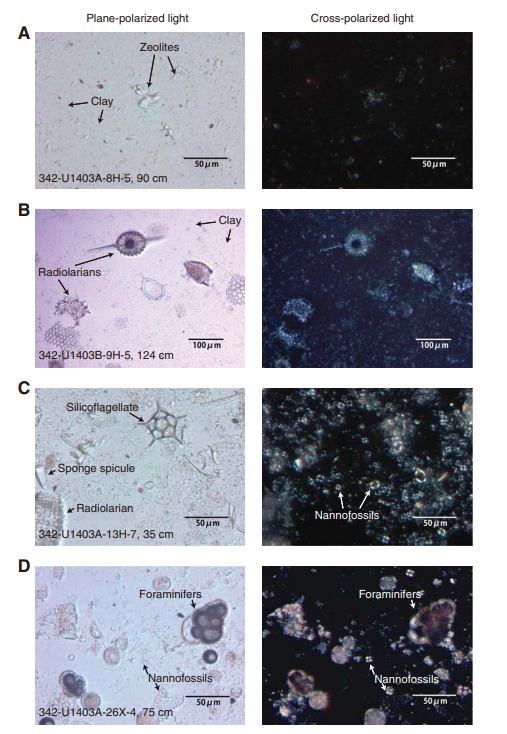
Paleontologists examined microfossils, which are critical for dating the sediments. The next section of this chapter details their methods. Both sedimentologists and paleontologists created smear slides which were useful for identifying the dominant sediment or rock type and microfossil content in a section of the core. A smear slide is a thin film of sediment smeared onto a glass microscope slide, dried, and then examined under a polarizing light microscope. This rapid method allowed scientists to visually estimate the relative abundances of sediment components and microfossils. Smear slides not only augmented an expedition’s core descriptions but they were also archives of information for future scientific study. For this reason, they were boxed and returned to core repositories along with the cores.
What insights do smear slides provide during an expedition? How do sedimentologists decide where to sample a core and how best to preserve it? This video will guide you through the process.
In this spotlight, scientist Larry Krissek discusses how his job as an expedition sedimentologist changed over time.
SciOD Spotlight – Larry Krissek, sedimentologist
The Ohio State University sedimentologist Larry Krissek has sailed onboard both Glomar Challenger and JOIDES Resolution. In this conversation, Larry shares how the process of core description has changed over time, especially with the advancement of track-type scanning systems. Although core description has been strongly influenced by the technology available, Larry has a few take-home messages:
- There is no substitution for the human eye and human brain for interpretation and pattern recognition
- Anyone thinking about getting into this field in the future – come join us!
Cores Contained Surprises!
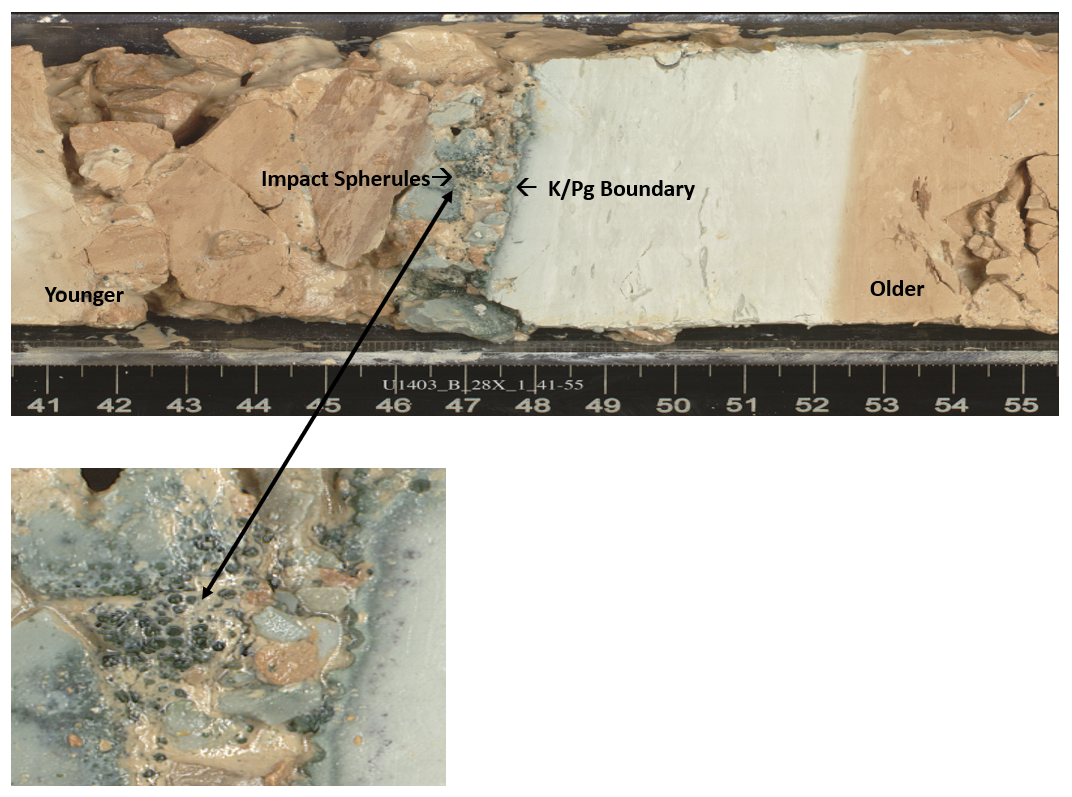
This core from IODP Expedition 342 off the coast of Newfoundland, Canada unexpectedly revealed a well-preserved record of the Cretaceous–Paleogene (K/Pg) boundary, a pivotal moment in Earth’s history marked by a mass extinction event 66 million years ago. Just above the boundary layer, in the younger Paleogene sediments, tiny glassy impact spherules are visible. These spherules likely formed from molten rock ejected during the Chicxulub asteroid impact, then cooled and rained back to Earth. Their presence provides direct evidence of the global effects of the impact that ended the reign of the non-avian dinosaurs.
details matter: Rock Visualization on JOIDES Resolution
The JR’s Imaging Specialist was an expert at bringing out the details and the nuance in the rocks and sediments through photographs. This video shows the technology developed to capture microscopic and macroscopic views of the samples. Click on the image below to be taken to a video.
This video follows IODP Expedition 390 as scientists cross the Atlantic and work to describe 900 meters of sediment cores collected on an earlier cruise. By examining nanofossils and subtle or abrupt changes in color and texture, sedimentologists uncover clues to past shifts in ocean circulation and climate.
This video further explores sediment core description on IODP Expedition 390 and how scientists use smear slides to examine the sediment under the microscope to better define its type and the kind of microfossils present. Click on the image below to be taken to the video.

Exercise: Expedition 398: A Story Told in 34 Stunning Core Photographs
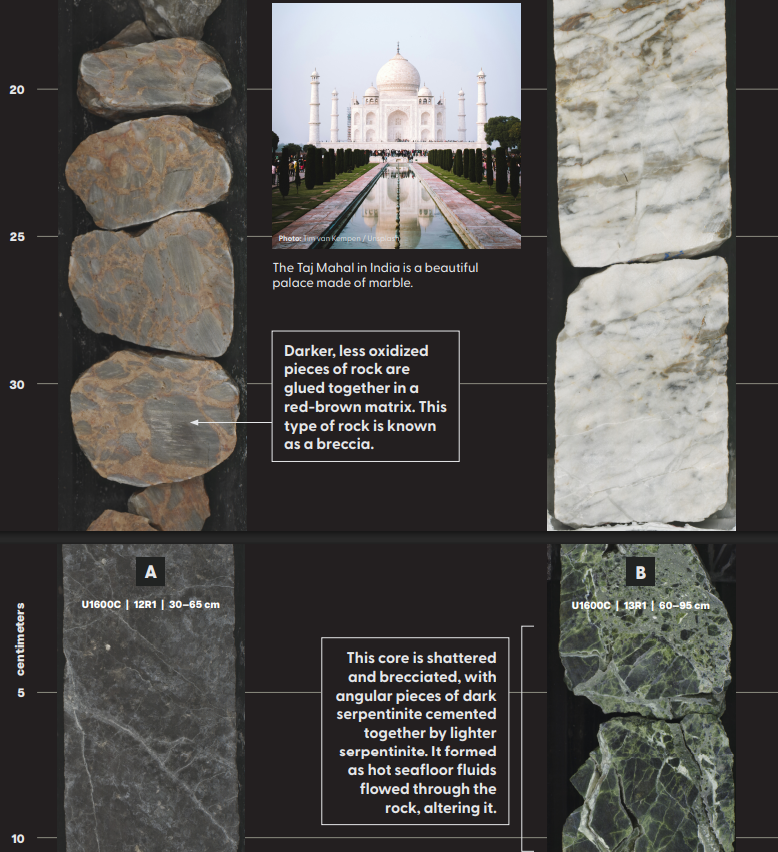
IODP Expedition 398 sailed in and around the Greek island of Santorini, a large volcanic caldera known for historically explosive eruptions. Scientists retrieved a range of core samples- from volcanic rock and debris to marbles, evaporites and serpentinites. Open this Booklet and select a section of core that strikes you as interesting. Examine the section, read the description and answer the following questions:
a) What geologic story does the core tell?
b) How does this core connect to the Expedition 398 Science Questions?
Sources:
Smear Slides: Marsaglia, Milliken and Doran, IODP Smear Slides Digital Reference for Sediment Analysis; https://www.marum.de/Binaries/Binary9798/A.-Smear-Slides-Part-I-Sept252013.pdf
