
6.1 Core Flow
From Bottom to Bench: Core Flow
In scientific ocean drilling, core flow is the step-by-step path for processing core samples, usually sediments or rocks. Once they were retrieved from the seafloor they passed through the JR’s Core Deck to a series of scientific and curatorial labs. By collecting a broad set of measurements, expedition scientists aimed to correlate cores across multiple drill sites and reconstruct the region’s geologic setting. This brief video provides an overview of the JR’s core flow process. Click on the image below to be taken to the video.

Core flow on JOIDES Resolution expeditions typically included:
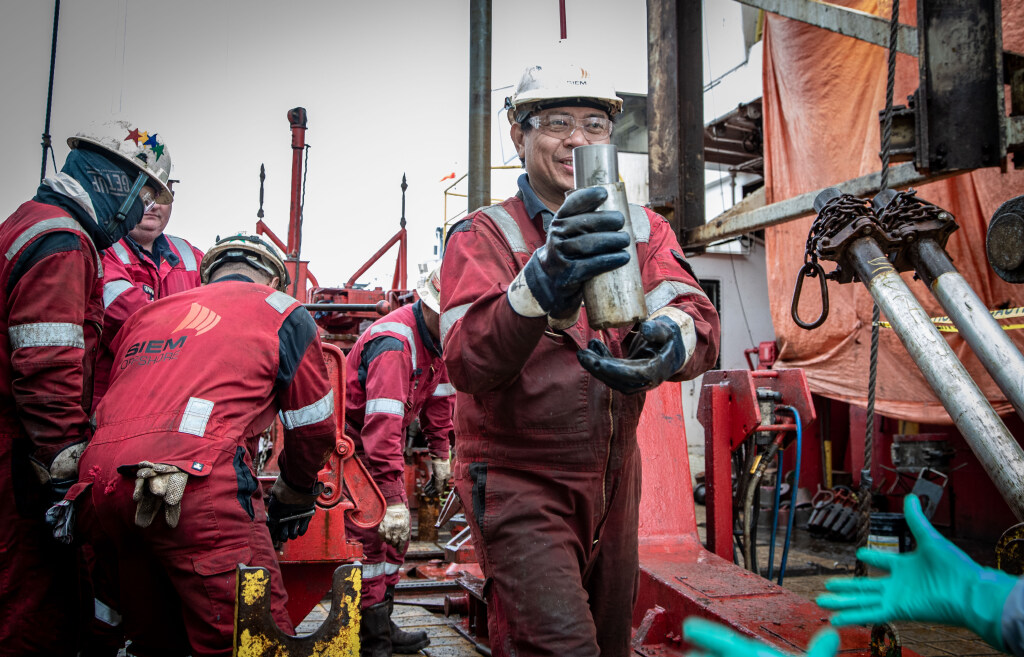
The Catwalk: After being brought up inside the drill string, the core was carried to a receiving platform called the catwalk, a narrow, metal-grated walkway connecting the Rig Floor to the labs on the Core Deck. The name “catwalk” comes from the need for careful, cat-like footing in this narrow space.

Catwalk samples were taken by microbiologists, geochemists and micropaleontologists. For sediment cores, organic geochemists also routinely sampled the headspace, the zone just above the sediment surface where volatile compounds can collect. These headspace gases were checked for hydrocarbons, which can be flammable or even explosive under the right conditions, making early detection essential for safety onboard. At the base of each core, a device called the core catcher traps the deepest sediment. Samples from this section are often rich in microfossils, which helped the micropaleontologists estimate the age of the layers being drilled and could aid in correlating core sections across the study area’s drilling sites.
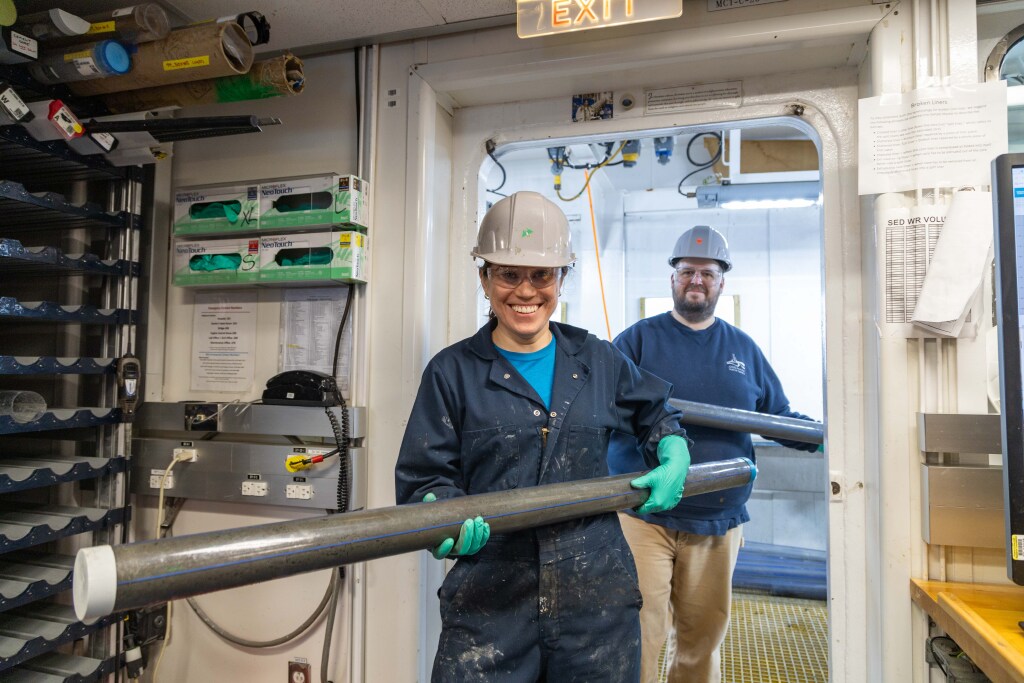
Core Cutting and Labeling: The cores were long, between 9.5 and 10 meters (about 32 feet!), heavy and unwieldy. On the catwalk, each core was laid down, washed and then cut into manageable 1.5-meter (~5 foot) sections. They were then brought into the lab. Here they were laser engraved with essential identification details directly onto the core liner. Laser markings are resistant to environmental factors that could degrade paper labels. The cores were then left to equilibrate to room temperature. This was an important step to ensure consistent conditions for subsequent measurements. This video presents the JR’s laser engraving process.
eXAMINING THE “WHOLE ROUND”
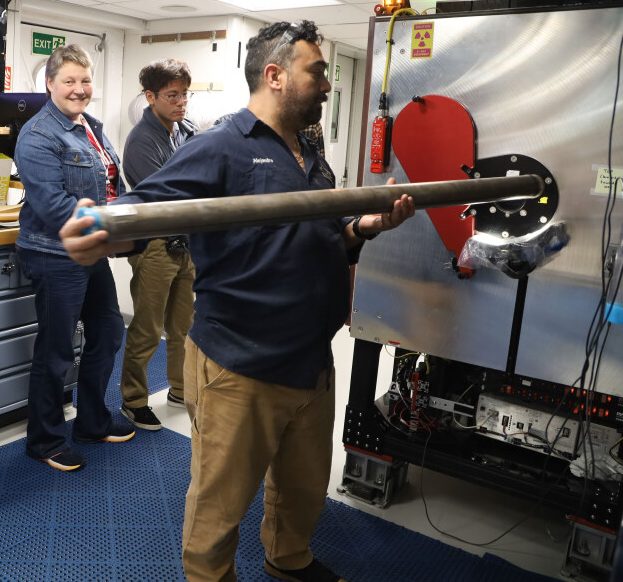
Petrophysics of the Whole Round: By now, the core had cooled to ambient (room) temperature, but before scientists cut it open, they put the intact “whole round” through a series of tests to measure the petrophysical traits of the core. Petrophysics is the study of physical properties and behavior of rocks, including density, porosity, water content, clay minerals, and even magnetic susceptibility. This last term is a measure of how much a material can be temporarily magnetized when exposed to an external magnetic field. These properties helped scientists correlate data from different cores, boreholes, and downhole tools. They also measured heat flow, a key to understanding how fluids move through the seafloor.
X-Ray Imager: The ship’s X-Ray Linescan Image Logger (XSCAN) high-tech scanner took crisp, high-resolution images of both whole cores and split sections. The instrument could rotate 180 degrees around the core, allowing scientists to view internal structures from multiple angles. Layering, small burrows, empty spaces, or subtle shifts in composition all became visible in the X-ray images, even if the core looked plain on the outside. These images worked hand-in-hand with other measurements and visual observations which helped scientists decide exactly where to take samples for further study.
THE “BIG REVEAL,” more measurements and pinning down the core’s age
Core Splitting and Further Sampling:
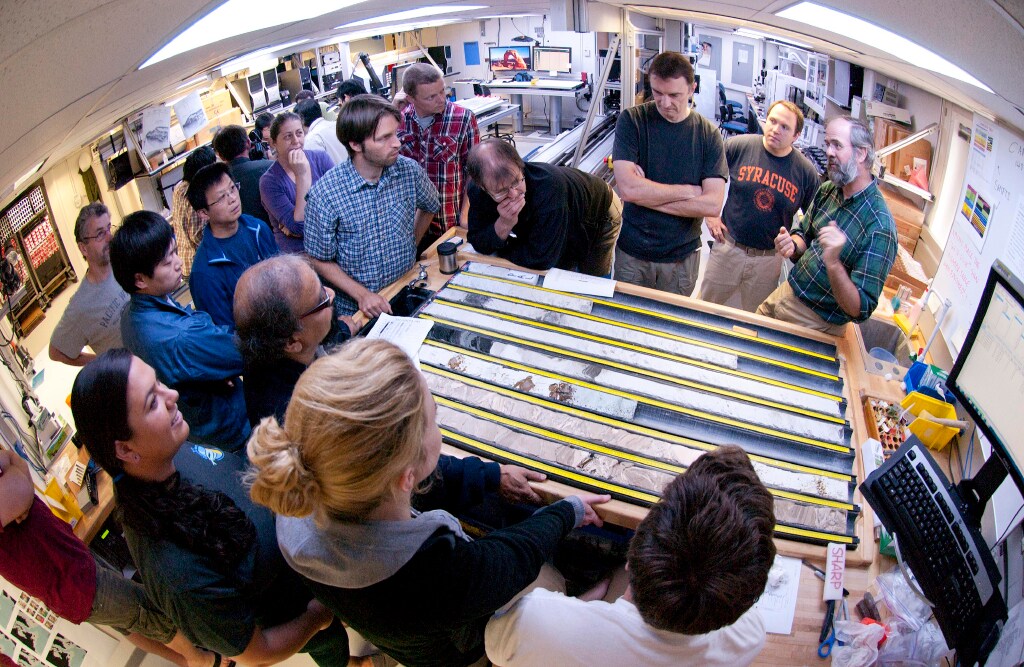
Until now, the whole core had only hinted at its content, offering images and measurements but with no direct look inside. That changed the moment it was split lengthwise, revealing layers that had lain undisturbed beneath the seafloor for millions of years. Scientists crowded around the Core Description tables, scanning the fresh surface for distinct laminations, unusual textures, or unexpected bursts of color.
One half, the archive half was preserved for future research. The working half became the focus of immediate study. From it, small samples were taken. Some were bound for the Microscopy Lab for paleontological study and others were sent for analysis to the Geochemistry and Microbiology labs on the Fo’c’s’le Deck, the ship’s forward section.
Paleontology Sample Prep and Microscopy:
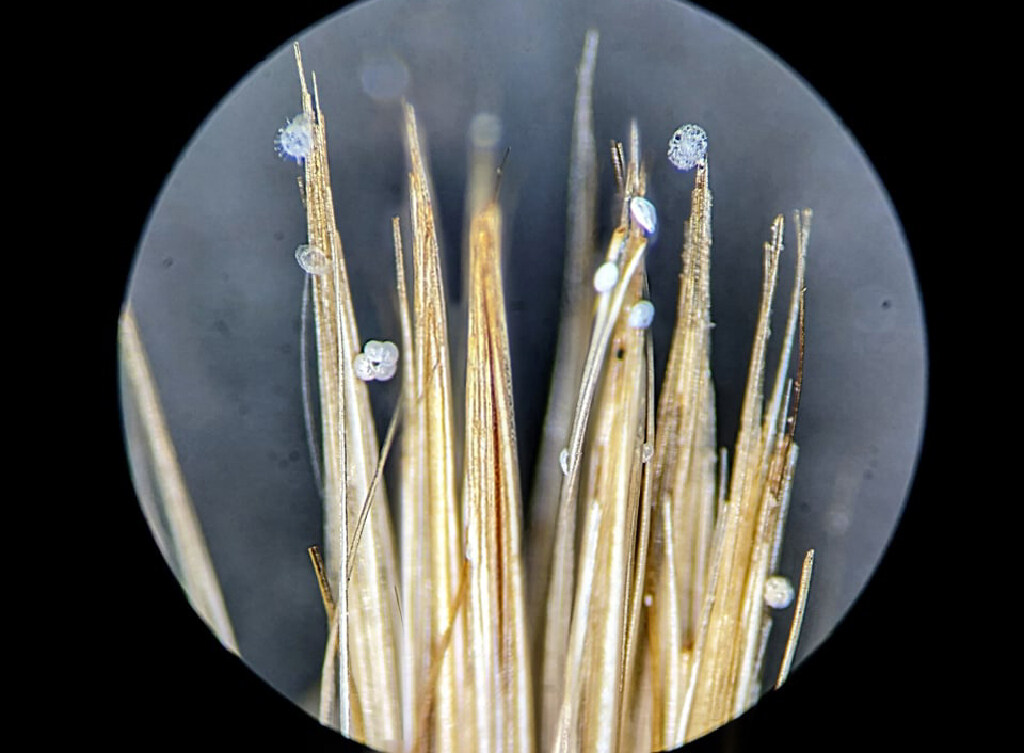
“The mud! Ye gods… In this the naturalists paddle and wade about, putting spadefuls into successively finer and finer sieves, till nothing remains but the minute shells…”
—Lord George Campbell, Log-Letters from the Challenger, 1877
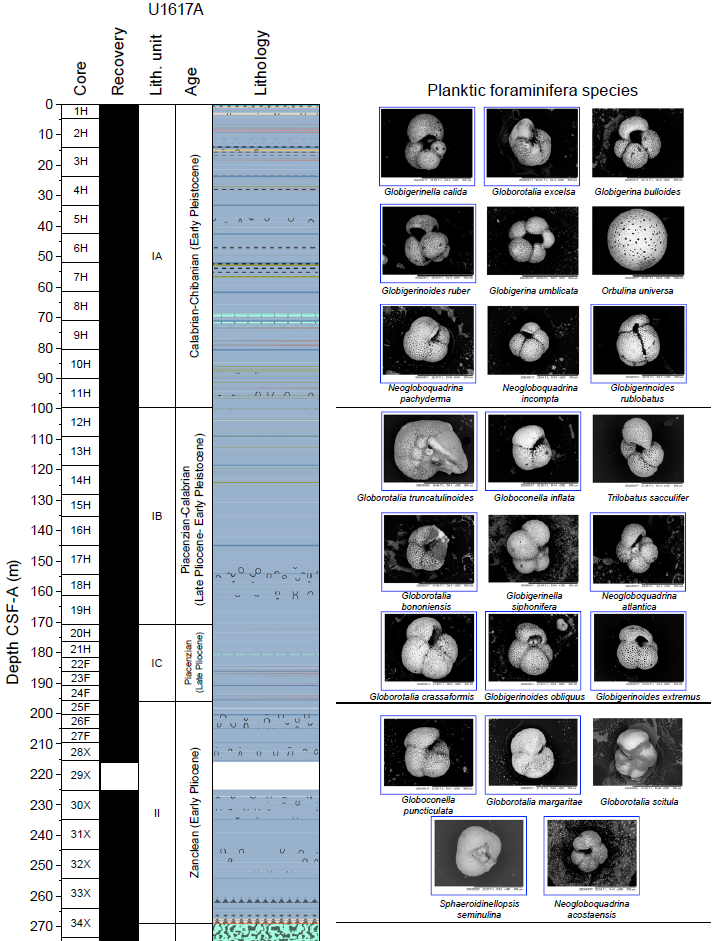
Nearly 150 years later, little has changed in the basic approach to sample preparation first described aboard the HMS Challenger (see 2.1 Early Ocean Exploration). In the Paleontology Sample Prep Lab, scientists still washed and sieved sediment again and again, separating out the tiny but essential “timestamps” of Earth’s history—microfossils. In the adjoining Microscopy Lab, paleontologists studied these fossils under powerful microscopes. They identified each species and used their known ranges in geologic time to pinpoint the age of specific core intervals. The image below shows how microfossil assemblages created the preliminary timeline of sediment layers in a core section. To narrow down the likely window of time in which the core material formed, data from another specialty- paleomagnetism-would be integrated into this scheme.
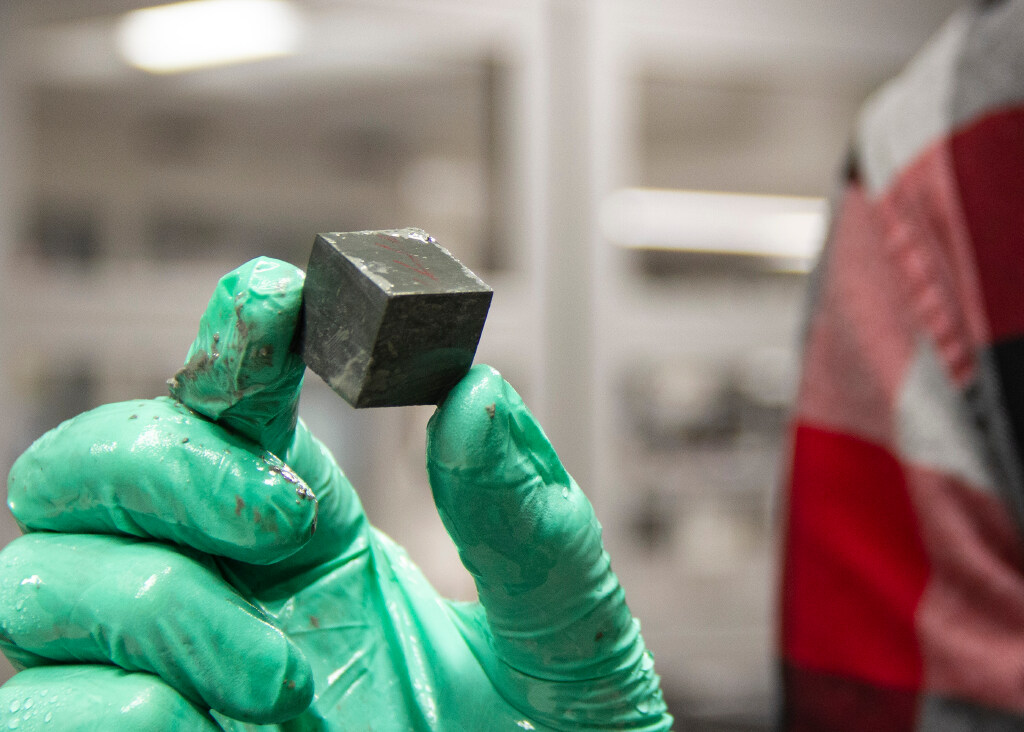
Petrophysics of the Split Core: Once the core was split, additional petrophysical measurements were taken. Because these properties are well defined and can be quantified they gave insight into mineral formation or alteration as well as the the complex fluid circulation in the seafloor. This lab’s data was often correlated with similar downhole measurements data and both datasets could be matched to seismic reflection records of the study area. Bringing these different datasets into alignment allowed scientists to build a more complete and reliable picture of the geology beneath the seafloor.
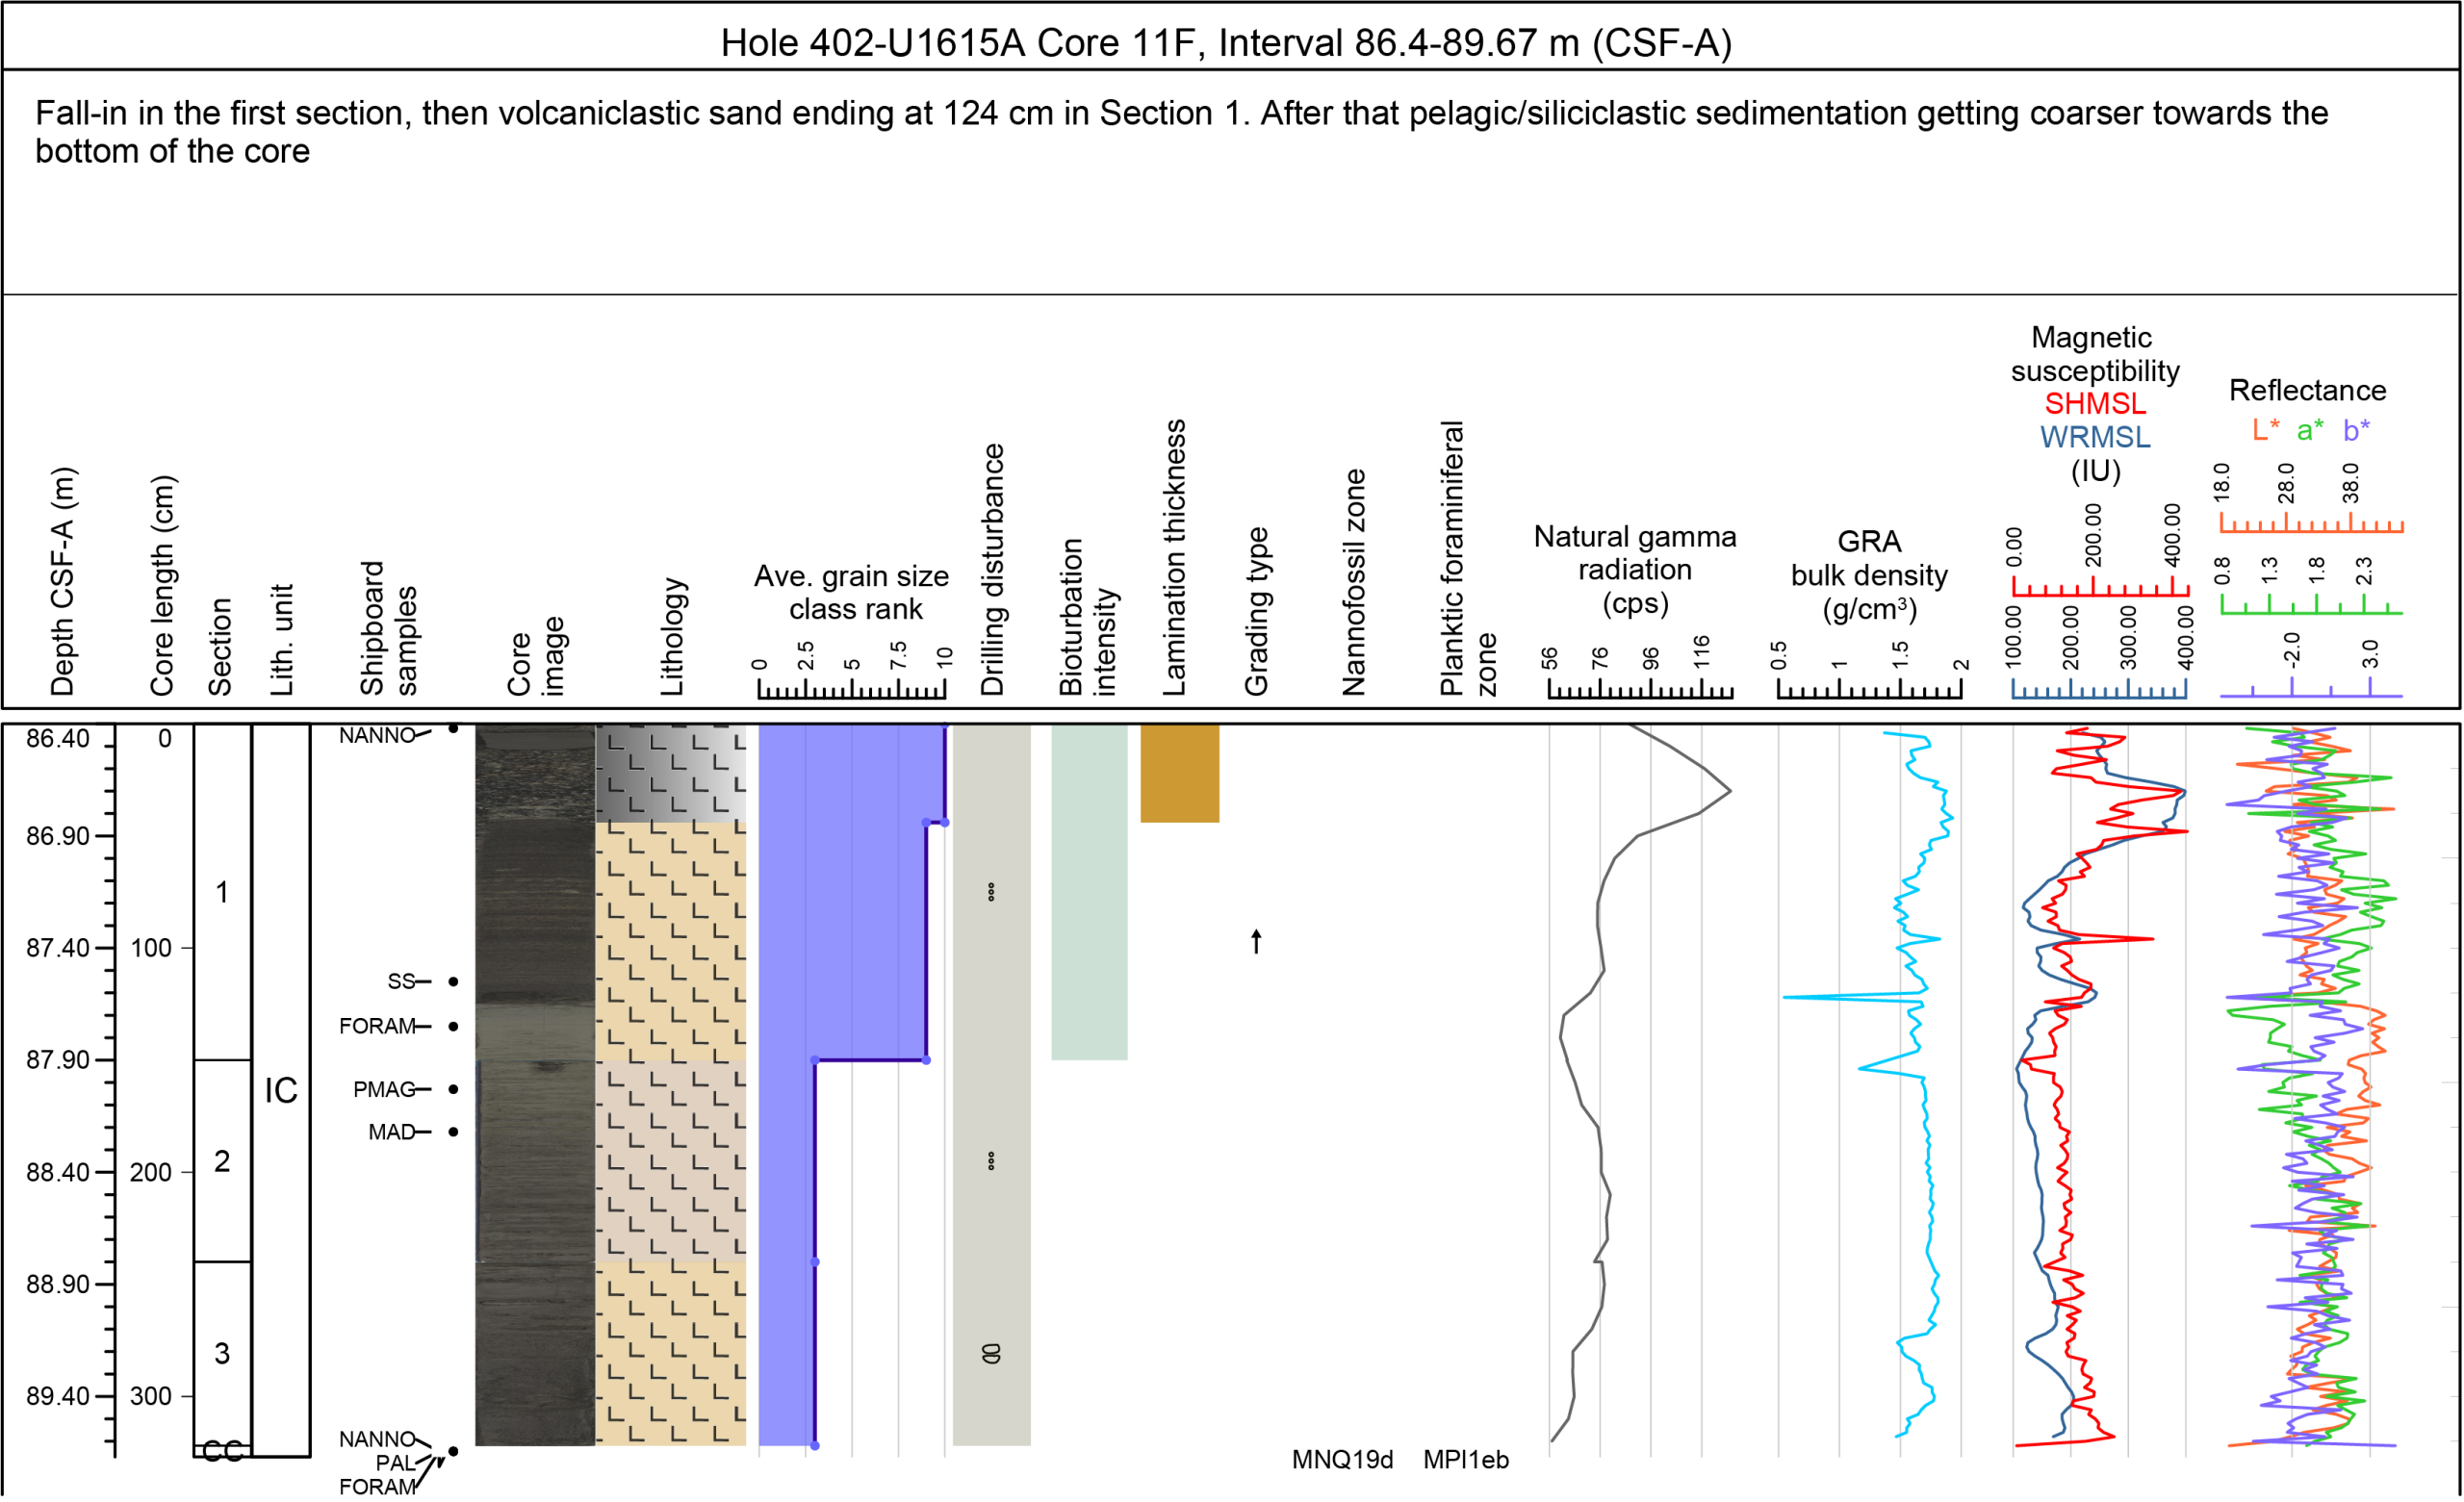
Core Description: Scientists examined the core visually and described in detail the core’s subtle color differences, composition and structures. This step involved multiple specialists and tools. If the core was crystalline rock, either igneous or metamorphic then “hard rock” petrologists were enlisted to examine the core samples and thin sections. Sedimentary rock and sediment cores were studied by stratigraphers, sedimentologists, and paleontologists. Structural geologists analyzed cores for signs of strain, like folds, faults, fractures and veins. They also identified any disruption to the core material that might have been caused by drilling. The image below shows how core description data was paired with the Petrophysics, X-ray and Paleontology data. Along with an image of the core along its entire length, the columns show three main types of information: the core’s original location and depth, the kind of material and features it contains, and petrophysical measurements (natural gamma radiation, gamma ray attenuation, magnetic susceptibility, and reflectance) that describe its physical properties).
Paleomagnetism: The compiled data graphic above held a wealth of information, but it lacked one critical element—a confirmed time scale. Paleontologists, using microfossil “time stamps” provided preliminary age estimates. Paleomagnetists then offered an essential cross-check, especially crucial in intervals where fossils were scarce. By combining their expertise, the two groups narrowed down unlikely ages and identified the most reasonable time intervals represented in a core section.
When sediments settle on the seafloor or crystalline rocks cool, their iron-rich minerals align with the planet’s magnetic field. Over geologic time, this magnetic field has repeatedly “flipped” between normal (north) and reversed (south) polarity. These “flips” are compiled in a “magnetic calendar” called the Global Geomagnetic Polarity Time Scale (GPTS). The GPTS (shown in 6.6: Paleomagnetism) goes back over 180 million years and was a key tool for this lab.
Shipboard paleomagnetists constrained the age of core sections by tracking changes in Earth’s magnetic field recorded in the rock and sediment. They measured these magnetic signatures with depth and plotted intervals of normal and reversed polarity, creating a magnetostratigraphic column. On its own, this column did not give exact ages, but when its reversal pattern was matched to the GPTS and paired with fossil age data, it became a powerful age model. With ages pinned to depths and datasets linked across drill sites, scientists could calculate the pace and duration of geologic events, reconstruct the tectonic and environmental history of the region, and connect their site’s story to known global events.
Back in the borehole for more data
![A Siem Offshore Floorman works with the downhole logging tools (Credit: Angela Slagle, IODP USIO) [Photo ID: exp340_033]](https://psu.pb.unizin.org/app/uploads/sites/427/2025/07/Downhole-Image-logging-for-Preface.jpg)
Downhole Measurements: After coring was complete, the borehole itself became a laboratory. Logging tools attached to a wireline were lowered into the open hole and then slowly pulled back up, transmitting data on the physical, chemical, and structural properties of the surrounding rock. Because core recovery is sometimes incomplete and core samples brought to the surface were no longer at their original temperature and pressure, these measurements helped fill critical knowledge gaps. They also complemented core analyses by providing a continuous, in-situ (in the original place) record of the subseafloor environment.
curation and Guardians of the Core
Archive halves and samples were stored, cataloged, and shipped to one of three global core repositories for long-term preservation (see Chapter 7: Curation On Board and On Shore). Scientists around the world can request sections of these cores for study, sometimes decades later. Curatorial specialists act as both librarians and guardians, carefully cataloging and safely storing each core. In this spotlight, we meet one of IODP’s curatorial specialists whose work preserves the legacy of scientific ocean drilling.
SciOD Spotlight – Chad Broyles, Curatorial Specialist
“I always say we’re in curation, but most people understand that with archaeology and art. Instead of archaeology and art, we have geologic mud and rock. That really is an invaluable thing.”
Chad Broyles served as a curatorial specialist on 19 JOIDES Resolution expeditions over nine years. He is now the Superintendent of the Gulf Coast Repository at Texas A&M University, overseeing cores from the Pacific, Southern Ocean, Gulf of Mexico, and Caribbean. In this exchange Chad talks about his unexpected career path and the global perspective and exposure to scientific disciplines he gained from working at sea. He has a few take-home messages:
- STEM Breadth Matters! Knowledge in geology, chemistry, physics, and math gave him the flexibility to understand and support diverse research projects.
- Cores expand our perspective. Handling sediment cores showed how even small samples capture hundreds of thousands of years of Earth history.
Explore the Labs on the Core Deck
Click on the green circles with the plus symbol to learn about the main functions of each lab. Labs are numbered to show the order of the core flow. Depending on the type of material—rock or sediment—not all labs were used for every core.
Explore the Labs on the Fo’c’s’l’e Deck
Fo’c’s’le is short for “forecastle”, the forward part of the upper deck. Click on the green circles with the plus symbol to learn the main functions of each lab. Depending on the type of material—rock or sediment—not all labs were used for every core.
Detailed Core Flow for Sediment and Basement Material

On the JR, basement material refers to the sedimentary, metamorphic or igneous rock found below the ocean floor sediment. The core flow for this rock differed from sediment core flow primarily in the absence of microbiological, interstitial water, and headspace gas samples. The order of analyses and description is otherwise the same as the chart above.
Sources:
Onboard Outreach Officer Program: Training Manual, 5th Edition, 2022
Scientific Ocean Drilling Vessel, JOIDES Resolution Facilities https://iodp.tamu.edu/labs/ship.html
George Campbell, Log-Letters from “The Challenger” (London: Macmillan, 1877) https://books.google.com/books?id=171EAAAAYAAJ.
