1.1 How Science Works

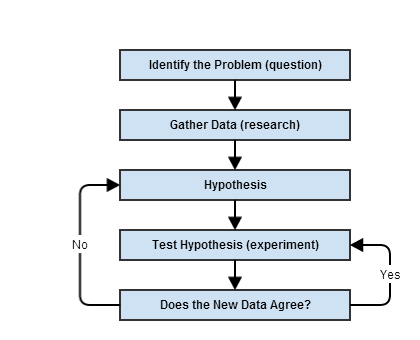
Before diving into learning more about Planet Earth, we begin with a review of the process of science. Many prior textbooks and publications will describe the scientific method as a linear procedure for investigation, as depicted in this flowchart with blue boxes and straight lines. Although science is typically summarized after the completion of the research as a series of steps that build upon one another (starting with a question, moving to gathering data, formulating and testing a hypothesis, etc.), the actual process for how scientific discoveries and advancement are made is much more complex.
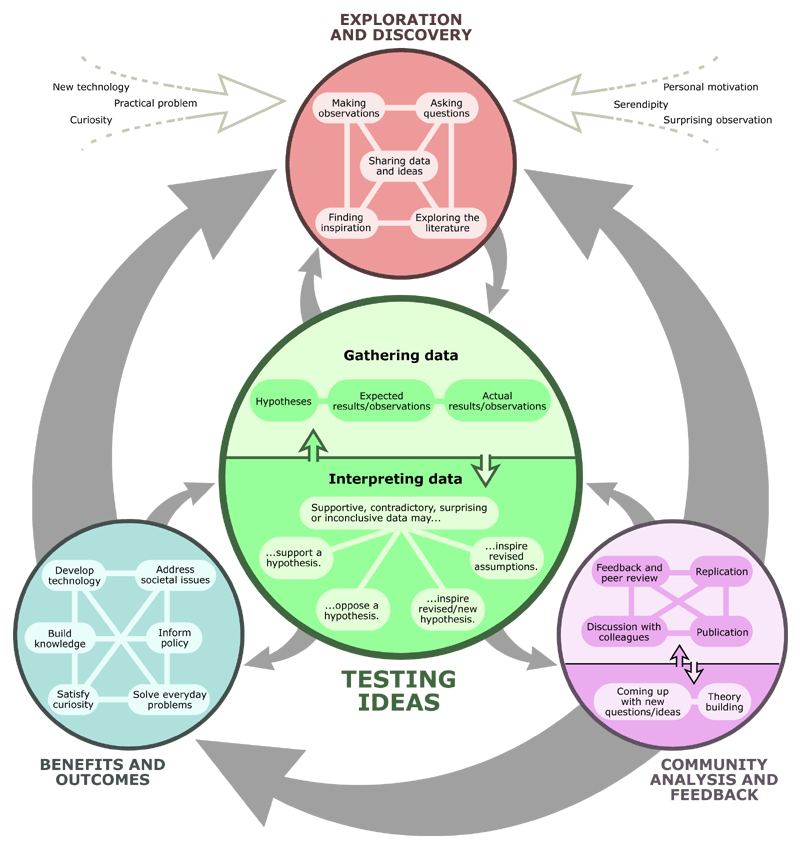
We now acknowledge that a linear visualization is oversimplified and not an accurate representation of how science is actually carried out. The flowchart below represents the process of scientific inquiry as much more dynamic, building new knowledge of and benefits for the natural world not just by individual scientists but through community contributions. Take a moment to review and reflect upon this circular portrayal of science as a non-linear, dynamic, and iterative process.

To view an example of the process of science during a scientific ocean drilling expedition, check out this video from IODP Expedition 342. For two months in 2012, the drill ship JOIDES Resolution collected sequences of sediment and clay in the northwest Atlantic Ocean. With access to deep-sea material and through immediate laboratory testing and analyses on board, scientists find the linear process of the scientific method does not work. Instead, science at sea is filled with changing directions, collaborating with those on board and onshore, and adjusting the original research questions.
Exercise: The Process of Science on Expedition 342
After viewing the video above, please formulate responses to these questions:
a) What was the purpose of Expedition 342? What research question was the expedition trying to address?
b) How were the scientists able to learn about climate history? What materials did they study, and from what were the climate data obtained?
c) As the scientists were carrying out their work, what surprises did they face? What changes did they need to make?
d) Why is this research important?
e) Redraw the scientific flowchart from above, inserting information from the video into the appropriate circles.

