
6.6 Paleomagnetism
Pole Trackers: Paleomagnetism on the JR
Paleomagnetists measure the magnetic signals recorded in rocks and sediments. Earth’s magnetic field undergoes major reversals in polarity, from north to south and vise versa. As rocks crystallize or sediments are deposited, iron-bearing minerals align with Earth’s polarity, and their orientation can later be measured.
Geomagnetic reversals, often called “flips,” do not happen instantly. Most take between 1,000 and 10,000 years and are recorded in a “magnetic calendar” known as the Global Geomagnetic Polarity Time Scale (GPTS). The GPTS extends back over 180 million years and is a key reference for paleomagnetists. This record of polarity changes over time looks like a barcode, with normal polarity (north) shown in black and reversed polarity (south) shown in white. Scientists identify patterns of normal and reverse polarity in the core data, match it to the same pattern in the GPTS and use this comparison to determine the core’s age. Below, an expedition paleomagnetist shows a segment of the GPTS.

Which way is up?
Because expedition paleomagnetists related the sample’s magnetization to Earth’s magnetic field at the time the sediment or rock was formed, they must keep track of the original orientation of the sample before it was retrieved. These specialists have certain conventions to help them, like marking the core and any samples with a red arrow to show the “up” direction of the core. They also oriented all cores on an X-Y-Z axes, where +X is the up core direction. These lab practices (also done in the field, by the way) were critical for taking measurements that were consistent with the geographic and stratigraphic orientation of the cores. The image below illustrates the markings that ensured that everyone recorded measurements from the same reference points on the core.

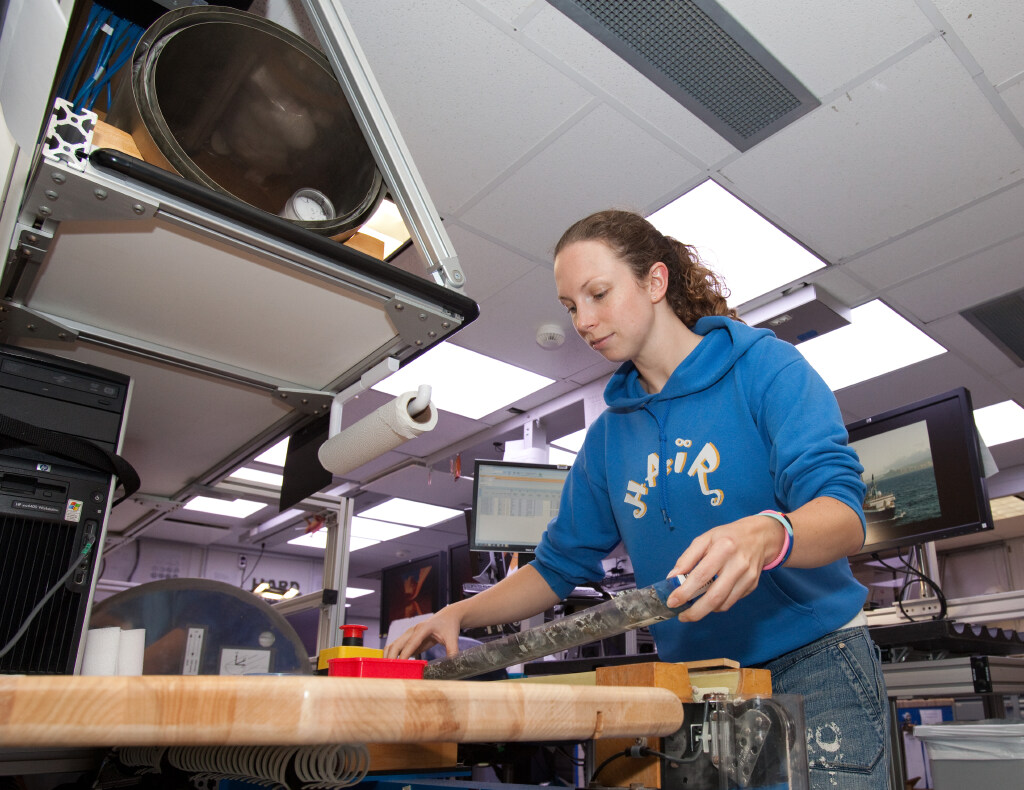
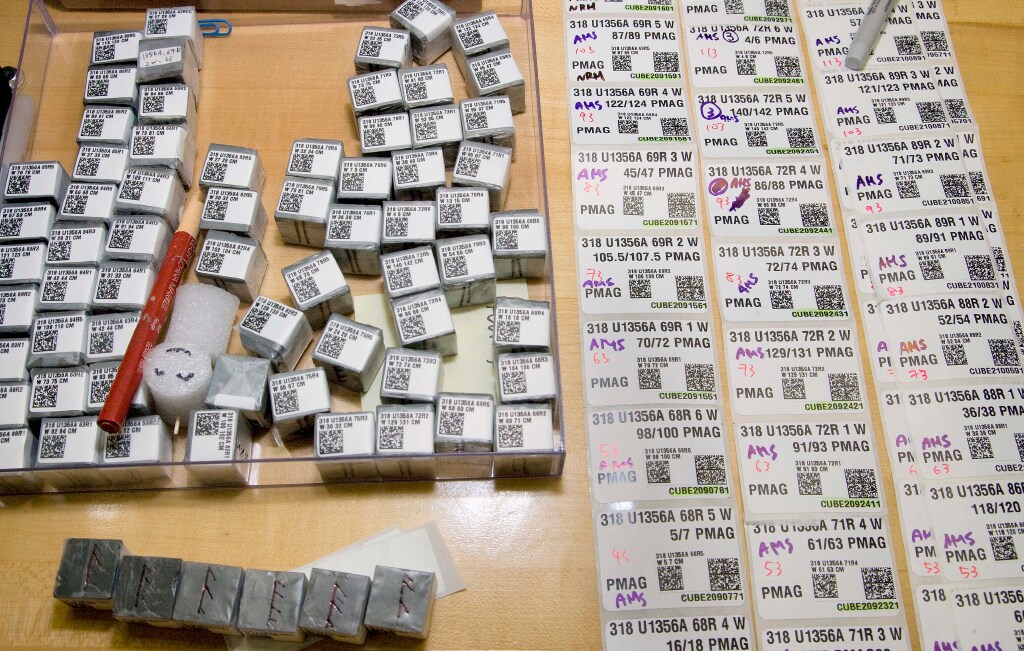
Discrete Samples: from core to cube
A discrete sample is a cube cut from a sediment or rock core. On the JR, each cube, taken from the working half of the core was oriented and measured individually, which allowed scientists to analyze magnetic properties without interference from surrounding material. Discrete samples fit into specialized instruments, like the spinner magnetometer and alternating field demagnetizers, both of which gradually removed secondary magnetizations in small, controlled steps. This process was much harder to do accurately on a full core section.
With these small cube-shaped chunks of a core, expedition paleomagnetists measured their magnetic signals, and carefully removed any extra magnetism picked up during drilling. Step by step, they revealed the rock’s original polarity. The workhorse of the JR’s Paleomagnetism Lab was the Cryogenic Magnetometer. As the discrete samples or the archive half of the core passed through this machine, a high resolution record was collected of its permanent magnetic field properties. One of the ship’s paleomagnetic specialist explains the process in this video.
The Age framework: Fossils merge with Magnetic Reversals
Paleomagnetists created a magnetostratigraphic column by plotting intervals of normal and reversed polarity with core depth. On its own, this column did not give exact ages, but when its reversal pattern was matched to the GPTS and paired with fossil age data, it became a powerful age framework. With ages pinned to depths and datasets linked across drill sites, scientists could calculate the pace and duration of geologic events, reconstruct the tectonic and environmental history of the region, and connect their site’s story to known global events. In this video from Expedition 344 off the coast of Costa Rica, paleontologists and paleomagnetists describe how their datasets merged.
