
Appendix E – Water Properties
Appendix E
Water Properties
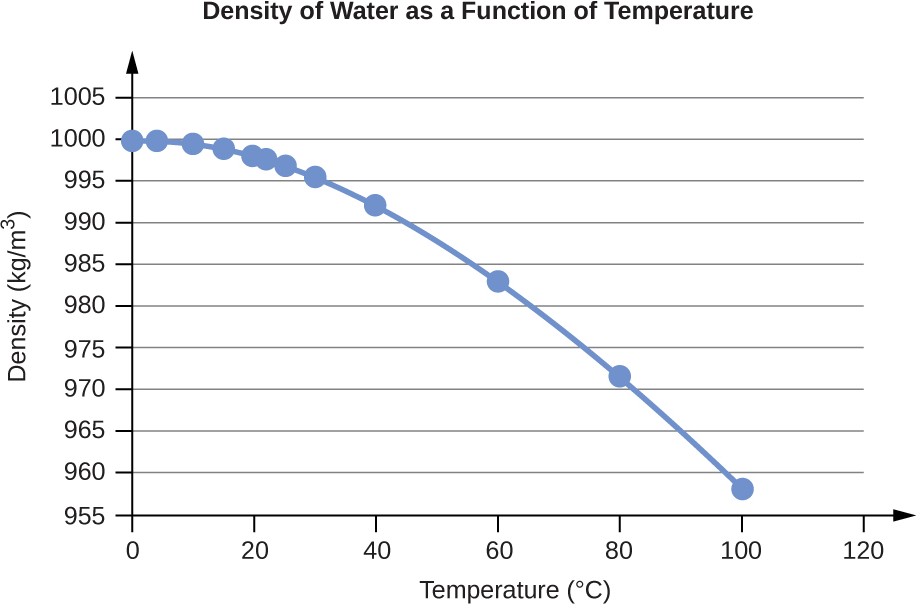
Water Density (g/mL) at Different Temperatures (°C)
|
Temperature |
Density (g/mL) |
|---|---|
|
0 |
0.9998395 |
|
4 |
0.9999720 (density maximum) |
|
10 |
0.9997026 |
|
15 |
0.9991026 |
|
20 |
0.9982071 |
|
22 |
0.9977735 |
|
25 |
0.9970479 |
|
30 |
0.9956502 |
|
40 |
0.9922 |
|
60 |
0.9832 |
|
80 |
0.9718 |
|
100 |
0.9584 |
Table E1
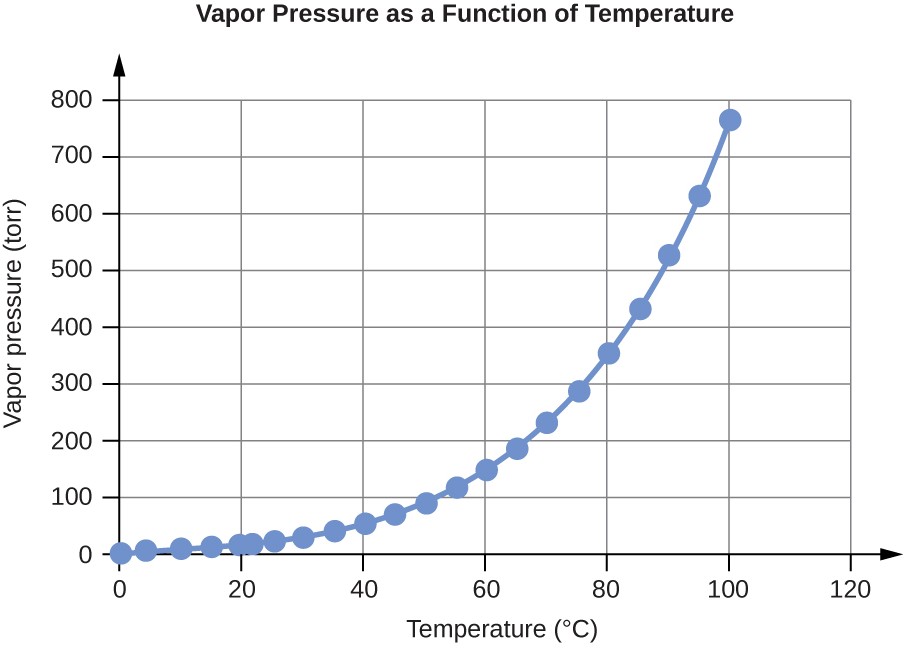
Water Vapor Pressure at Different Temperatures (°C)
|
Temperature |
Vapor Pressure (torr) |
Vapor Pressure (Pa) |
|
0 |
4.6 |
613.2812 |
|
4 |
6.1 |
813.2642 |
|
10 |
9.2 |
1226.562 |
|
15 |
12.8 |
1706.522 |
|
20 |
17.5 |
2333.135 |
|
22 |
19.8 |
2639.776 |
|
25 |
23.8 |
3173.064 |
|
30 |
31.8 |
4239.64 |
|
35 |
42.2 |
5626.188 |
|
40 |
55.3 |
7372.707 |
|
45 |
71.9 |
9585.852 |
|
50 |
92.5 |
12332.29 |
|
55 |
118.0 |
15732 |
|
60 |
149.4 |
19918.31 |
|
65 |
187.5 |
24997.88 |
|
70 |
233.7 |
31157.35 |
|
75 |
289.1 |
38543.39 |
|
80 |
355.1 |
47342.64 |
|
85 |
433.6 |
57808.42 |
|
90 |
525.8 |
70100.71 |
|
95 |
633.9 |
84512.82 |
|
100 |
760.0 |
101324.7 |
Table E2
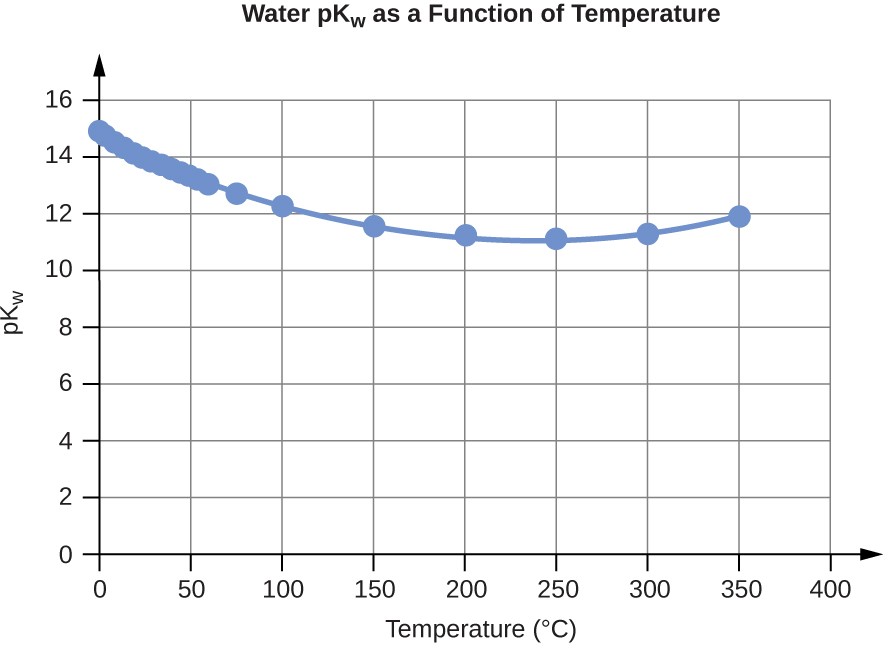
Water Kw and pKw at Different Temperatures (°C)
|
Temperature |
Kw 10–14 |
pKw |
|---|---|---|
|
0 |
0.112 |
14.95 |
|
5 |
0.182 |
14.74 |
|
10 |
0.288 |
14.54 |
|
15 |
0.465 |
14.33 |
|
20 |
0.671 |
14.17 |
|
25 |
0.991 |
14.00 |
|
30 |
1.432 |
13.84 |
|
35 |
2.042 |
13.69 |
|
40 |
2.851 |
13.55 |
|
45 |
3.917 |
13.41 |
|
50 |
5.297 |
13.28 |
|
55 |
7.080 |
13.15 |
|
60 |
9.311 |
13.03 |
|
75 |
19.95 |
12.70 |
|
100 |
56.23 |
12.25 |
Table E3
1. pKw = –log10(Kw)
Specific Heat Capacity for Water
|
C°(H2O(l)) = 4.184 J·g-1·°C-1 |
|
C°(H2O(s)) = 1.864 J·K−1·g−1 |
|
C°(H2O(g)) = 2.093 J·K−1·g−1 |
Table E4
Standard Water Melting and Boiling Temperatures and Enthalpies of the Transitions
|
Temperature (K) |
ΔH (kJ/mol) |
|---|---|
|
Melting – 273.15 |
Boiling – 6.088 |
|
boiling – 373.15 |
40.656 (44.016 at 298 K) |
Table E5
Water Cryoscopic (Freezing Point Depression) and Ebullioscopic (Boiling Point Elevation) Constants
|
Kf = 1.86°C·kg·mol−1 (cryoscopic constant) |
|
Kb = 0.51°C·kg·mol−1 (ebullioscopic constant) |
Table E6
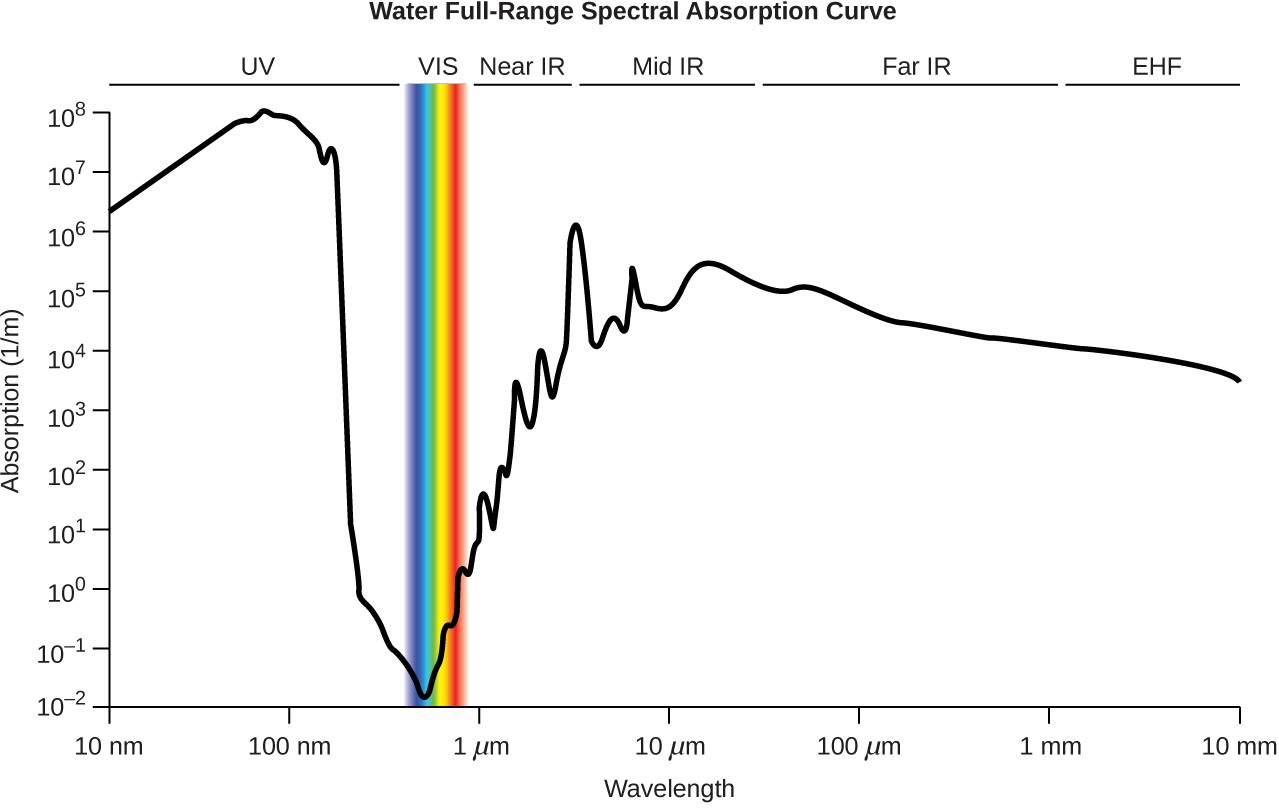
Figure E1 The plot shows the extent of light absorption versus wavelength for water. Absorption is reported in reciprocal meters and corresponds to the inverse of the distance light may travel through water before its intensity is diminished by 1/e (~37%).
