
Chapter 6: Investigating the Physical and Dynamical Properties of Planets and Other Objects in the Solar System
Science Notebook Assignment
Begin a new note for this investigation. Be sure you are continuing to keep your notebook organized and labeled.
Investigation Question:
How can we group objects in the Solar System according to their properties?
If you review the final claims you have been including in your “evidence bucket” after each of the previous investigations, you should have come to several important conclusions about the nature of the Solar System as a whole and the nature of many of the objects in the Solar System. Now, you should be ready to investigate the objects much more deeply by comparing and contrasting many of their specific properties. By the end of this investigation, you should have a large table of data in your notebook that includes information on many of the properties of a large number of objects in the Solar System.
To begin the investigation, your group will be assigned to gather data from internet research on one property for nine objects: the eight planets and Pluto. Properties that will be assigned at this first stage are:
- Mass of the object
- Distance of the object from the Sun
- Diameter of the object
- Mass density of the object
Science Notebook Assignment
Create a table in your notebook where you can record your data and begin to record the data you gather in this table. As the investigation continues, we will add additional properties and additional objects, so you can either create multiple tables or leave empty rows and columns that can be filled in later.
Collecting and recording numerical and other data in a table
As you begin your work collecting data on your first property for these objects, you will find that much of this data is numerical. So you will need to be sure you understand the units being used and the scale of the numbers if the data is presented in scientific notation. We encourage you to work using metric units, as this is what astronomers do, and so you can record data using:
- Mass of the object in kilograms (kg)
- Distance of the object from the Sun in kilometers (km) or in “astronomical units” (AU) where 1 AU is approximately 150 million km
- Diameter of the object in kilometers (km)
- Mass density of the object in kilograms per cubic meter (kg / m3) or grams per cubic centimeter (g / cm3) where 1 g / cm3 = 1000 kg / m3
Some of these values are likely going to be expressed in scientific notation, such as the mass of the Earth, which is often expressed as 5.97 x 1024 kg. This is the abbreviated way of writing 5.97 x 1,000,000,000,000,000,000,000,000 kg or 5,970,000,000,000,000,000,000,000 kg. When tabulating large numbers like this, be sure to pay attention to the scientific notation and to properly compare the magnitude of the difference between values for two objects.
After tabulating your values, you can search for patterns to see if you notice any obvious groupings. You could break your objects up into groupings using ranges like small/medium/large, low/medium/high, or something similar if this helps make patterns more apparent.
Creating a visualization of your data
After your group has collected data for your particular property for these nine objects and has decided on a preliminary set of groupings, you should create a visualization of your data to be shared with the entire class. Some possible visualizations that might work for these data are:
- 2D scatter plot
- bar graph
- illustration
After each group has created their visualization that communicates the information in their data table and the initial set of groups for the nine objects, a class “board meeting” should be held to share these visualizations on white boards, chart paper, or electronically using projected images of slides.
Science Notebook Assignment
Record your visualization in your notebook. Your instructor will create a new note for the entire class and will copy all of the data tables and visualizations there, so every group will have access to all of the data and groupings for all four of the properties explored so far.
Using multiple lines of evidence to create an initial evidence-based claim
The initial grouping that you presented in your visualization based on the pattern from one property is an example of an evidence-based claim that answers the question how you might group the objects in the Solar System according to their properties. However, it is likely that each group had a slightly different grouping based on the one property under study. At this point, each group should compare and contrast all of the data collected so far to arrive at a new claim that groups the nine objects based on multiple lines of evidence using more than one property. That is, can you use some combination of mass, mass density, diameter, and distance from the Sun to divide these nine objects into two or more groups? Discuss until you achieve consensus.
Science Notebook Assignment
Record your claim and evidence in your notebook. Be sure to identify the groups you have identified among the nine objects studied so far and include multiple properties that were used to assign them to these groups.
Adding additional properties and additional objects to your dataset
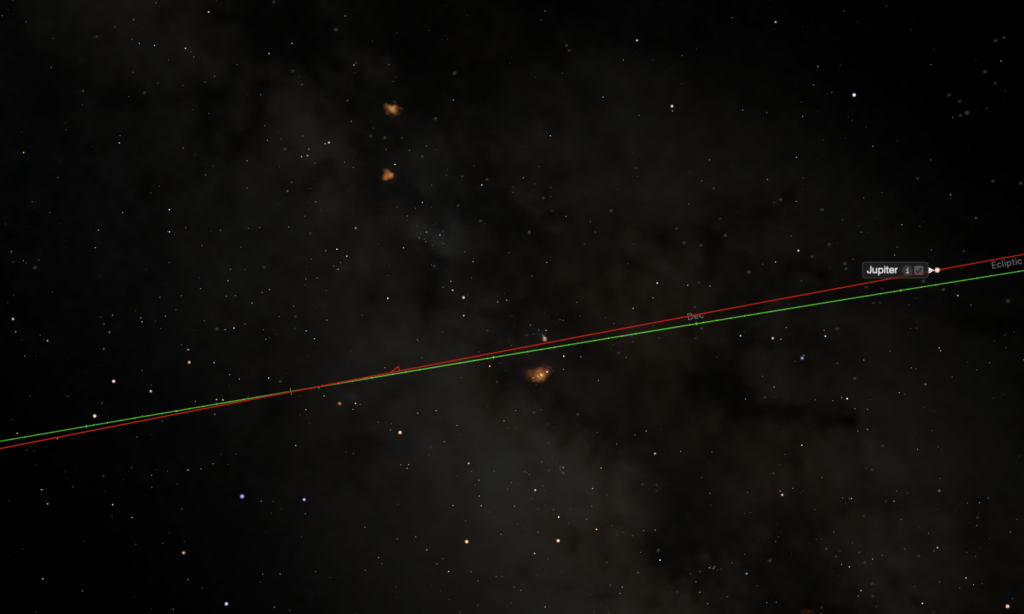
Besides the physical properties of the objects themselves, the motion of the objects in the Solar System can be quantified and used to categorize objects in the Solar System. In a previous investigation, you found that the Solar System appears to be flat, that is, the planets orbit the Sun approximately in the same geometric plane the Earth does. However, upon closer analysis, the planets do not orbit the Sun in exactly the same plane. Thus, one way in which you can quantify the orbit of a Solar System object is by measuring the angle between its orbital plane and that of the Earth’s orbit. This is illustrated in the figure below.
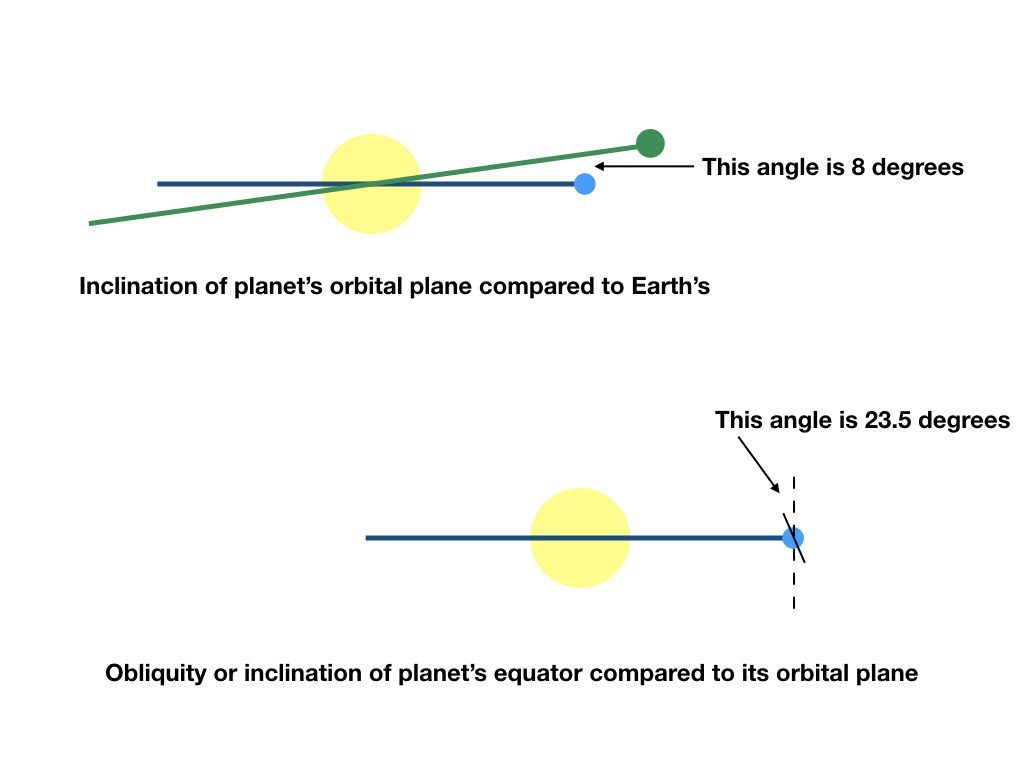
In order to include dynamical properties (that is, those properties that describe the motion of Solar System bodies) in your overall analysis, please go back to your original data table and add in the tilt of the object’s orbit with respect to the Ecliptic, the rotation period (the length of the object’s day), and the tilt of the object’s rotation axis. This second tilt angle describes how “tipped over” the planet or body is compared to the Ecliptic Plane. If the North Pole of the object you are studying points perpendicularly to its orbital plane, then the planet is not tipped over at all, and it has a tilt of its rotation axis (often referred to as its “obliquity”) of 0 degrees. This is equivalent to saying the body’s equator is parallel to its orbital plane. Earth is tipped over by 23.5 degrees, so Earth’s equator is tilted with respect to the Ecliptic by this amount. The difference between the two angles you are being asked to record for each object is illustrated below.
After collecting this data for the nine objects you already have in your table, you want to expand your sample to include six more objects:
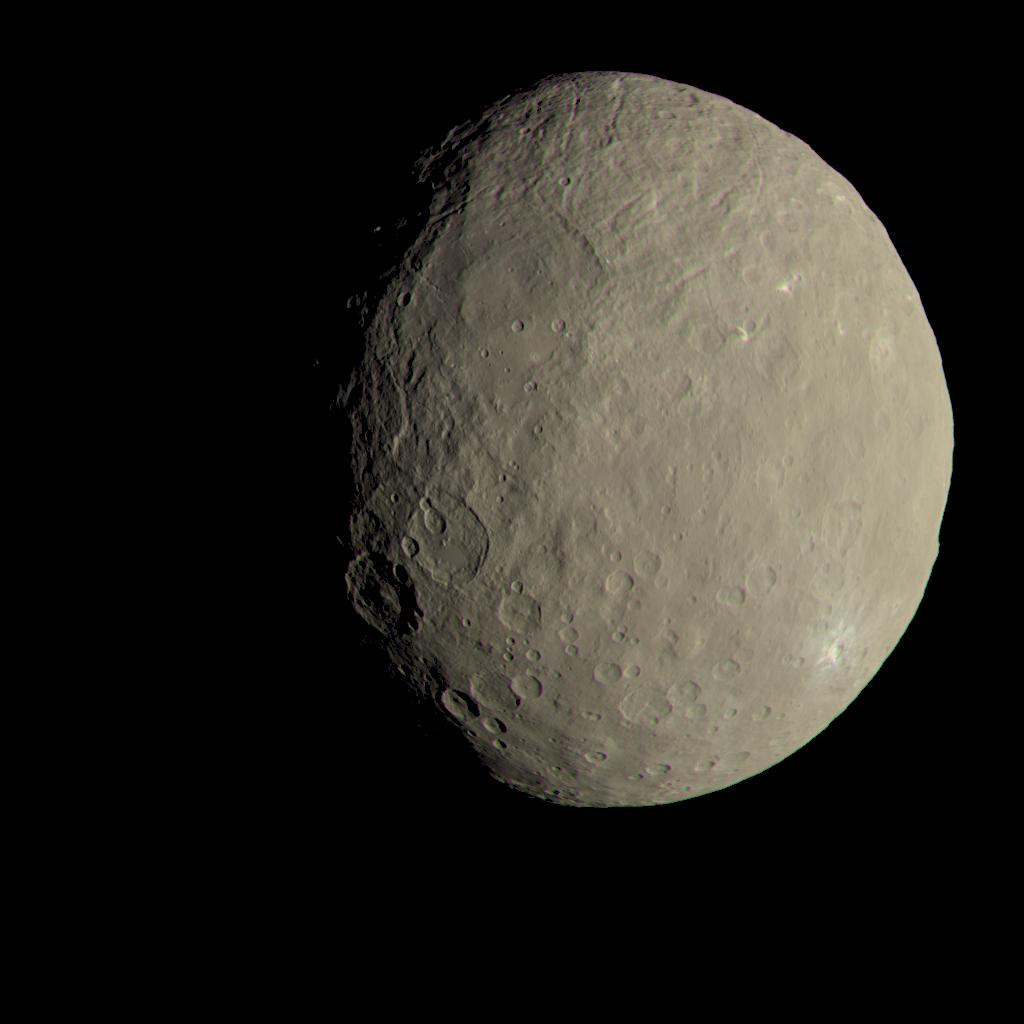
- Ceres
- Eris
- Makemake
- Haumea
- Quaoar
- Vesta
You should collect as much data as possible of the seven properties (mass, mass density, diameter, distance from the Sun, orbital inclination, obliquity, and rotation period) for these additional six objects. When complete, your final data table should be as complete as possible with seven properties (or as many as you can find) for 15 objects.
With the larger table complete, you should again look for patterns in order to group the objects in the Solar System. The challenge is that with many more data points to consider, the patterns may not be as obvious. The data you collected may also not include the properties best suited to sorting the objects into groups. You can certainly consider additional properties if you think they may help with your analysis, and those could include:
- overall composition of the object
- its shape
- presence of, composition of, thickness of an atmosphere
- does it have a moon or moons? rings?
When looking for patterns in such a large set of data, it is likely you are going to find some anomalies. That is, you may find an object or objects that appear in most cases to be very similar to other objects in the group, but they may have one property that is different than every other object, causing uncertainty as to which group they might belong. Scientists often focus on these anomalies, as they can be important cases for figuring out the cause behind the phenomena under investigation. In your analysis, you should assign all 15 objects to a group based on several different properties. However, you should also make note of any object that you feel has some anomalous property that makes it an outlier in its group. You may find that with the new data you have to reconsider the groups you had originally proposed when analyzing the smaller set of objects with fewer properties.
After completing this exercise with your group, write a revised claim that lists the groups you defined and which objects are found in which group, and cite as much evidence as you can from your data table (at least two or more properties) that you used to define your groups.
Science Notebook Assignment
Record your revised claim in your notebook, which should identify the groups you identified and which objects are categorized in each group. You should describe all the evidence used that supports your classifications, and you should note which objects have one or more anomalous properties that make classifying them more challenging than the others.
Up to this point in this investigation, you have been focusing your work on writing your claim and considering all of the evidence that supports that claim. We have not created a model that can be used to provide reasoning for this investigation, and in our course, we actually create this model and discuss the reasoning in our next investigation. As a segue into that investigation, we recommend conducting a final discussion at this point in order to prepare for consideration of the reasoning.
First, each group should present their final claims and evidence in a “board meeting” so that all groups can compare and contrast each claim and evidence. Questions to consider during this discussion are:
- Is the evidence provided by each group sufficient and strong enough to support the claims they made about grouping Solar System objects?
- Are there certain groupings of objects that came up again and again? Are there others that were disputed between groups?
- Which object or objects seemed to be the hardest to classify among all of the groups? What properties were responsible for the difficulty?
- Did other groups use different data than your group did to argue for a similar grouping? Did a group use evidence differently than your group?
After carefully considering all of the claims and evidence, your group may wish to revise your own claim and evidence one last time. If the class feels they have achieved consensus on the claims, it is time to consider the scientific reasoning that may be important for this investigation.
- What types of scientific ideas are important to consider when studying the classification of scientific phenomena?
- Why do you think we study Solar System objects by classifying them into groups?
- Is there some scientific “big idea” in astronomy that may help explain why Solar System objects are able to be classified into distinct groups?
Science Notebook Assignment
Edit your final claim and evidence, if you choose to, after the final class discussion. Record your initial thoughts about reasoning from this discussion in preparation for the next investigation. Record the final group claim in your evidence bucket as one more piece of information you can use to build your understanding of the Solar System as a whole.
Resources for data collection
Your group should use a variety of sources for data collection, and you should consider your assessment of their reliability before including the data in your notebook. The primary resource we recommend for beginning your search for data on objects in the Solar System is the NASA Solar System exploration site:
Astronomy textbooks are good resources for data on planets, and free textbooks including the following are also good sources for data on the objects in this investigation:
Resources for further reading
During this investigation, you likely used a lot of familiar astronomical terms to name the groupings you created. These names are often historical and the way we are using them today is different than how they were used when they were coined. We encourage you to research the origins of these object names. This article is one example that explains some of the history of the term “asteroid”:
Based on the many discussions I have held with students in this course and articles like the one linked above, I wrote an article for “The Conversation” about this topic, and my friends in the Penn State Eberly College of Science communications office recorded a podcast of our conversation about this:
