
Geographers not only are interested in the patterns of physical or social processes on the Earth at a given level of spatial organization (e.g., local, regional, or global), but they also want to know the interactions and feedbacks across different spatial scales. Geographers sometimes also discuss temporal scale, which is the duration or time length of a thing or process. Some examples can help us understand scale. Consider air pollution. This often exists at the scale of a city or metropolitan area. The city will have cars, factories, power plants, and other things that cause air pollution, and the air pollution will affect people who live in the city and breathe the air there. People elsewhere may not be significantly affected. (Note that sometimes the wind sends air pollution further away.) In contrast, climate change largely exists at the global scale. (We’ll discuss climate change in greater detail later in the course.) This is because climate is a process that covers the whole planet. When we change the climate somewhere, we change it everywhere. Scale matters in understanding the interactions between humans and the environment.
A nice depiction of scale can be found in the following video (9:01):
The video shows the same point in space on a broad range of scales, from the subatomic to the astronomical. In geography, we tend to focus on human scales, which are the scales of the world as we experience it. So, you will not need to know any particle physics or astronomy for Geog 30N, even though some of it may be relevant!
It is important to appreciate that phenomena can be considered or observed at multiple scales. For example, we can observe climate change at the global scale, since climate is a global process. However, we can also observe climate change at local scales. Climate change is caused by, among other things, many individual decisions to burn fossil fuels. Also, climate change impacts people and ecosystems in specific local places across the world. The causes and impacts are different in different places. If we only observed climate change at the global scale, we would miss this variation from one location to another. It’s important to observe climate change – and many other important phenomena – at many scales so that we can fully understand what’s going on.
Another example important to Geog 30N is deforestation. As with climate change, it helps to consider deforestation on many scales. An individual living in the Brazilian Amazon might decide to cut down a tree to collect firewood, to sell the wood, or to clear land for farming. If we think of deforestation just at this local scale, then we might understand it as a local event. However, the decision to cut down the tree can be connected to other political, economic, cultural, and environmental processes that operate at national, regional and international scales. For example, the decision to cut the tree is shaped in part by external economic markets: whether the tree could be sold for money, or whether the person could make money from engaging in other activities that require clearing patches of forest, such as raising cattle for beef. Trade agreements between Brazil and other countries shape the systems of economic exchange, and international demand for hardwoods such as mahogany (in the United States and Europe in particular) create incentives to deforest tropical rainforests. Therefore, the simple act of cutting down a tree in Brazil needs to be seen as connected to other economic and political processes that intersect and move across multiple scales.
The deforestation example highlights the important concept of globalization. Globalization is a hotly debated concept, but it is generally understood as the increasing integration of societies around the world through improvements in transportation and communication technologies. The integration can be economic, political, or cultural. Here are some examples:
* Economic Integration: Global freight shipping permits Brazilian trees to be sold to European consumers.
* Political integration: American environmental policies may limit the types or quantities of trees that can be imported from Brazil.
* Cultural integration: Globalized tastes for food can lead people from around the world to desire food products that can be grown in Brazil.
Globalization has impacted societies around the world as the sharing of products has contributed to the perception that cultures are losing their individuality.
One way to approach understanding relationships across scales is through commodity chains. A commodity chain contains the links between the collection of resources to their transformation into goods or commodities and, finally, to their distribution to consumers. Commodity chains can be unique depending on the product types or the types of markets (agriculture versus textiles for example). Different stages of a commodity chain can also involve different economic sectors or be handled by the same business. Figure 1.1 visualizes a simplified commodity chain for the seafood industry.
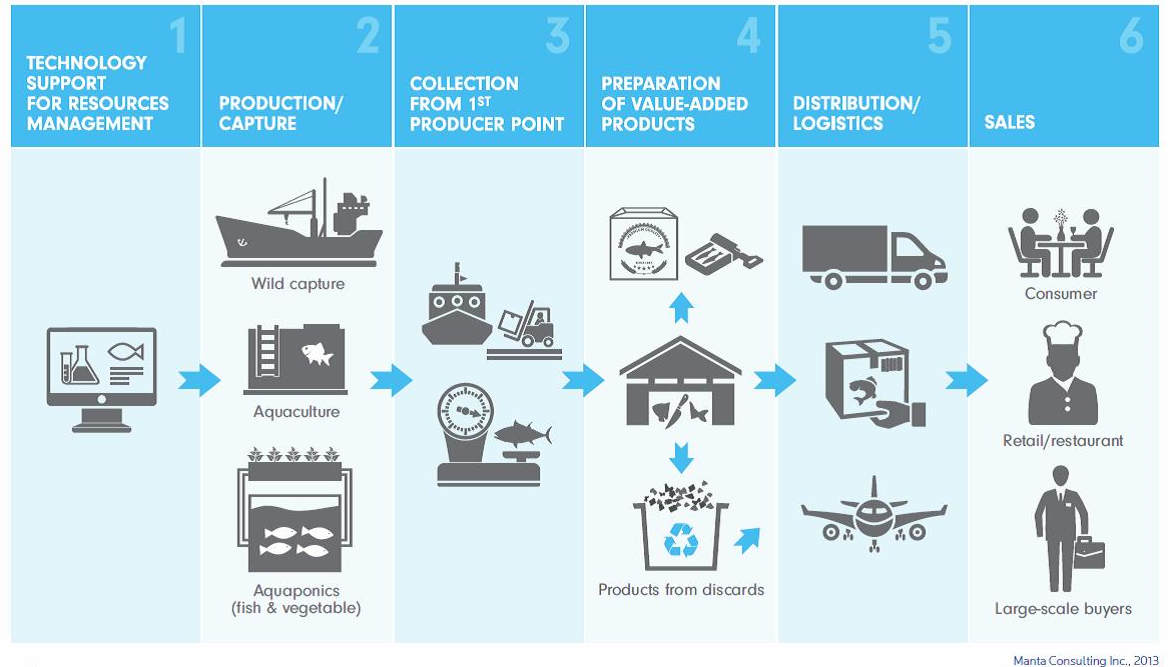
Click here to see a text version of Figure 1.1
Understanding the path that fish took on its way to our plates as it moves across the commodity chain allows us to think about the interconnections between capture/production (wild fisheries vs. aquaculture), generation (converting whole fish to other product forms such as fish fillets or canned fish), distribution and sales (transferring products to locations for consumption and selling products to consumers).
Consider This:
When you buy seafood, do you ask yourself, “Where does my seafood come from and how does it get to me?” Look at Figure 1.1 and try to place yourself on this supply chain. Where do you exist in terms of the production and consumption of seafood?
As we’ll discuss in later modules, the global rise in seafood demand has caused the depletion of fish stocks. Unsustainable overfishing has emerged as a global issue and has its severe and irreversible impacts on human lives and marine biodiversity. As with fishermen catching more fish than the population can replace through natural reproduction, we need to think about our individual decisions and local patterns that contribute to sustainable practice. Our decisions and food choice are also linked to political and economic processes at multiple scales, but we need to think about the types of impacts our individual decisions have for the natural world.
