5 Introduction to Construction Cost Estimating
Learning Objectives
After reading this chapter, you should be able to:
- Define typical cost estimating methods that are used within the Construction Industry
- Describe the types of cost information available to various participants within the industry
- Describe relative levels of accuracy for different estimating approaches
Introduction to Cost Estimation for Construction Projects
Construction cost estimating is both an art and a science. To be an effective estimator, you need to be able to interpret a facility design, and visualize and plan the approach toward building the facility. The best estimators are also very good at understanding previous construction costs and interpreting the conditions that will add or reduce future costs.
Construction cost estimates (‘estimates’) are created at many different points in time throughout a project. The owner may develop very early feasibility estimates to determine if a project is economically viable. A designer or construction manager may develop a series of progressively detailed estimates during the design process to ensure that the project is being designed to the owner’s budget. A general contractor or trade contractor will develop estimates to determine their bid or budget values for a project. And there may be multiple estimates developed to determine the impact of various design options, or develop a cost estimate for a design change during the construction process.
Construction cost estimates are also developed to different levels of detail, and different levels of accuracy. One method of defining levels of detail is to follow the RS Means levels of detail. They define 4 different types of estimates at progressive levels of detail as follows:
Rough Order of Magnitude (or Averaged Square Foot) Estimate
These estimates leverage average statistical values for the cost per unit or cost per square foot for a building. They are projected to be accurate to within +/- 20%, although this accuracy can be highly variable. This estimate can be performed with very limited information, e.g., how many cars for a parking garage or an approximate number of square feet for an office building. This estimate can be performed in the planning phase, and should only take approximately 10 minutes to perform.
Modeled Square Foot Estimate
These estimates leverage predefined model buildings to aim to develop a building that is representative of the future building. This approach is projected to be accurate to within +/- 15%, but again, this can be very variable depending upon the levels of assumptions. The Modeled Square Foot estimating approach requires that you have an approximate building footprint, know the structural system, and know the facade system. This estimating approach can be implemented in the Schematic Design phase and will typically take approximately 1 hour to perform.
Assemblies (or Systems) Estimate
An assemblies estimate is developed by identifying, quantifying, and pricing each of the assemblies within a project. They are projected to be accurate to within 10%. To perform an assemblies estimate, you need to know the system-level design and be able to perform quantity takeoffs for the various systems. This typically can occur within the Design Development phase. It will typically take approximately 1 day to develop this type of estimate, with much of the time spent on performing quantity takeoffs (quantifying the amount of each item).
Unit Price (Detailed) Estimate
A unit price estimate is a very detailed estimating approach where you define each of the items contained within the project, and price these items after defining the specific construction methods that will be used to construct them. This approach can be accurate to within +/- 5% of the cost, although this depends on the complexity of the project. To perform this type of estimate, the design must be quite complete, so it is typically done near or at the end of the construction documents phase. It can take up to 3 weeks to perform a detailed estimate of all items in a building, with a significant amount of time spent on performing quantity takeoffs.
There is a chapter in these notes devoted to each of these estimating methods.
Sources of Estimating Data:
To develop an estimate of the cost to construct a facility, it is important to identify data sources that will be used for the estimate. There are many different potential data sources. They can be divided into the following categories:
1. Actual Cost Data:
Depending upon the level of detail, and time available, you can obtain actual price quotes and actual cost information for some, or many, of the elements that will be included in the estimate. For example, if you are going to subcontract portions of the project, e.g., the concrete or steel trade, you can request quotes from one or multiple potential trade contractors. You can also contact suppliers to get firm quotes on the cost of specific materials and equipment. Finally, you can get actual wage rates for workers on the project, although you will still need to develop estimates for how many hours the work activities will take. If you can get firm quotes from subcontractors and suppliers, with a time period to accept and contract with them for the supplies and equipment, then you have a high degree of confidence in the actual costs for the portions of the project estimate.
2. Historical Cost Data: Company Data
If you can not obtain actual cost quotations, or for work activities that a contractor will directly perform, they can leverage historical data from their own projects. For example, if you are a concrete contractor and you are developing an estimate for the concrete work on the concrete work on a future office building, you can review the actual costs and production rates from previous projects that your company has performed. When doing so, it is critical for the estimating team to fully understand the context of the previous projects, along with how the project team tracked their costs. If a company maintains good records of previous project costs and production rates, then it can relatively easily develop estimates for similar future projects that are quite accurate.
3. Historical Cost Data: National / Regional Averages
For organizations that do not have their own data available, there are organizations that collect cost data, and then report this data through online databases or cost estimating guides/books. These organizations are typically collecting data from many projects that are performed in many locations, and then averaging and modifying this data to represent average national construction costs. The data will also be compiled at different levels of detail, e.g., individual work activities, building systems, and overall building level costs. It is always important to keep in mind that the data in these cost guides/databases are averaged data, and individual site conditions, project complexity, and other factors may significantly impact potential costs. Therefore, these are the easiest source of data to find but are not as reliable as accurate, well-organized company data sources.
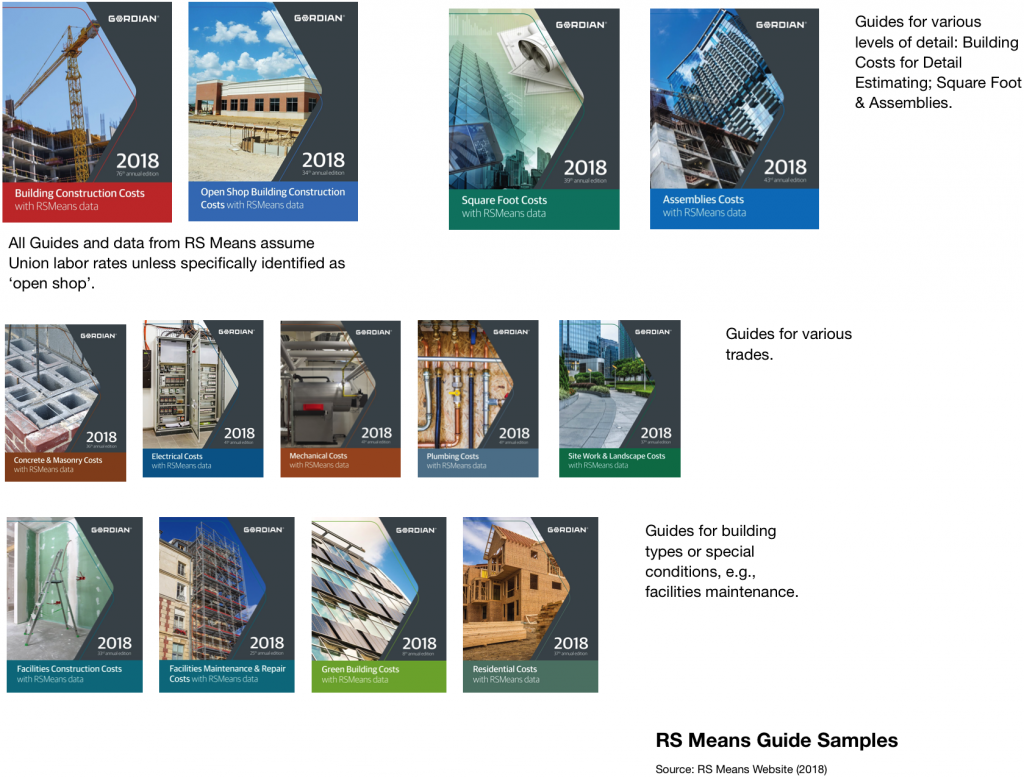
The most broadly used data source for historical data is the information from R.S. Means. R.S. Means has a series of books that outline costs for a variety of project types and levels of detail (see Figure 5.1 for cover pages) For example, they have guides for Unit Price estimating, Square Foot estimating, and Assemblies Estimating. They also have guides for various specific trades, e.g., concrete, steel, masonry, mechanical and electrical. And they have some guides for specific purposes, e.g., renovations, facility management, and green buildings. Finally, they also have guides with cost differentials based upon the labor used, e.g., the Open Shop cost guide for non-union labor. It is important to note that all guides unless specifically noted as ‘Open Shop’ are priced with wage rates for a union or prevailing wage workforce.
Impact of Time on Cost
As time progresses, it is typical for costs to escalate, at least in most economic conditions. Broadly, this is known as inflation, and we typically measure this cost escalation by pricing a series of goods over time and seeing how the price changes from one time period to another. The most typical measure in the US for inflation is the Consumer Price Index (CPI), which is calculated from a typical basket of goods that an average person may buy, e.g., food, gas, etc.
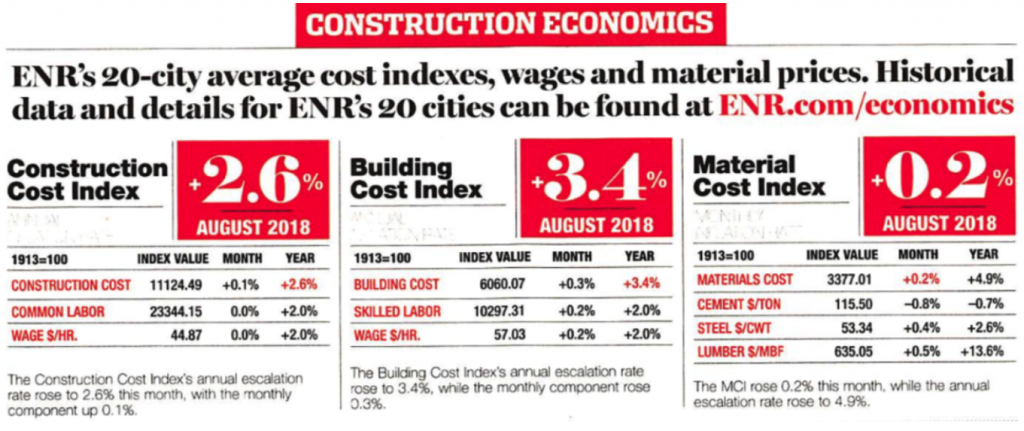
When we estimate projected building costs, there are similar cost escalations that occur, but these escalations are more targeted toward the cost escalation of building materials and the labor cost for construction. Therefore, it is more accurate to consider cost escalation by calculating the escalation of a construction-related ‘basket of goods’. RS Means has developed several specific cost index values, similar to CPI but focused on construction. These include the Building Cost Index (BCI) which contains typical products and labor for building construction; the Construction Cost Index (CCI) which is much broader to cover roads, bridges, and infrastructure; and the Material Cost Index for building materials.
When we perform cost estimates for building projects, we will focus on using the BCI value since it is more targeted to buildings. If you compare BCI values for two periods in time, then you can transition relative economic values between these times with a simple calculation of ratios. The BCI, CCI, and MCI are all reported in the Engineering News Record publication, which is published each week (see Figure 2). Monthly and annual averages are also available on the ENR website and are included in Figure 3.
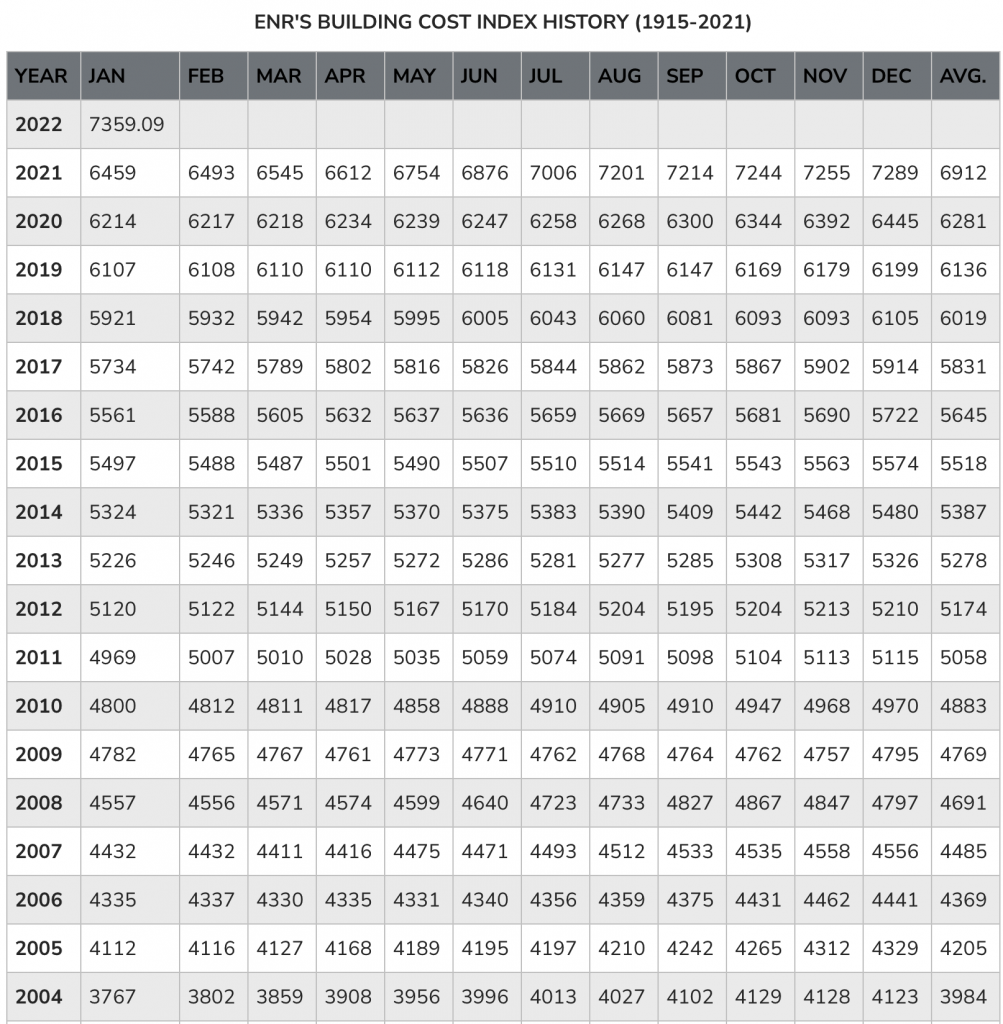
When using the RS Means data, it is valuable to know that the data within a cost guide is updated to be consistent with the index values for January of the year on the cover. For example, if you have a 2021 RS Means Building Construction Cost Guide, all cost data will be statistically modified to be consistent with the January 2021 BCI.
If you are a private organization that maintains your own cost data, you will also want to modify the data based upon the time of construction. Individual companies may maintain their own information to modify these costs. For example, Turner Construction maintains, and even publishes, its own cost index over time which is available online.
The escalation of costs over time can vary significantly, but on average, construction costs have historically risen approximately 3% per year. When we estimate future construction costs, we need to consider the projected future cost increases. Throughout this class, unless otherwise noted, a projected escalation of 3% per year can be used for future construction cost escalation. Companies will be reviewing their recent experience and projected future market conditions to establish the escalation values that they project when developing their cost estimates. This can have a significant impact on their final economic success on certain types of projects, e.g., lump-sum contracts, especially for projects that span several years.
Modify Index Values for Location
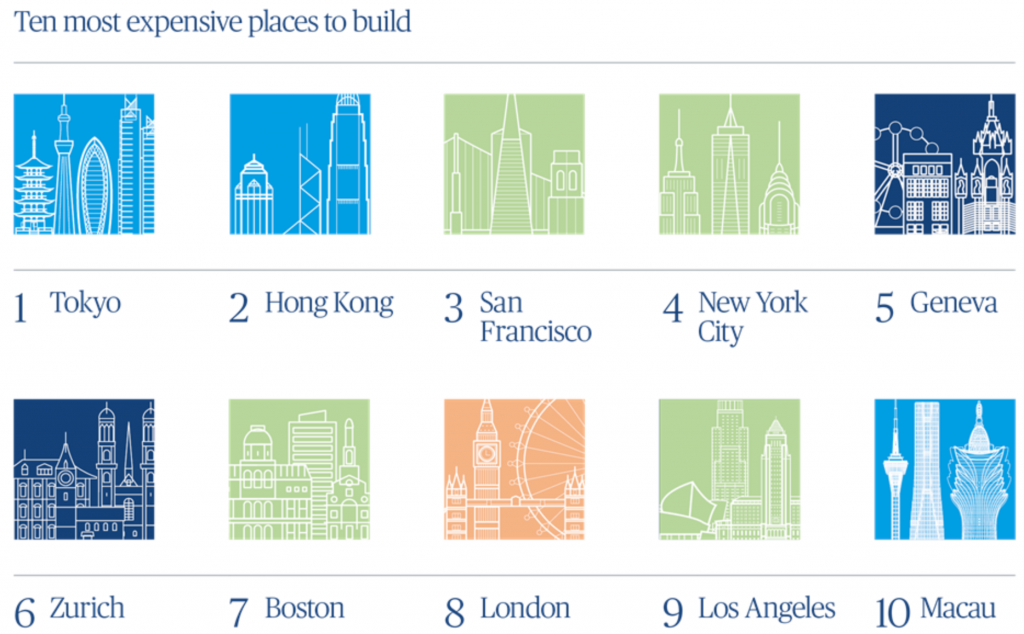
Construction costs vary by geographic location to due differences in material, equipment, and labor costs. These variations can be significant. These cost variations can be caused by many factors, including local costs of resources, site conditions (e.g., urban construction tends to cost more than rural), availability of contractors, taxes, and overall region or country economics. In the 2021 International Construction Market Survey by Turner & Townsend, they found Tokyo, Hong Kong, and San Francisco to be the 3 most expensive cities in the world to build (see Figure 4 for the top 10 most expensive places to build). It is interesting to see that 4 of the top 10 most expensive locations are major cities within the United States.
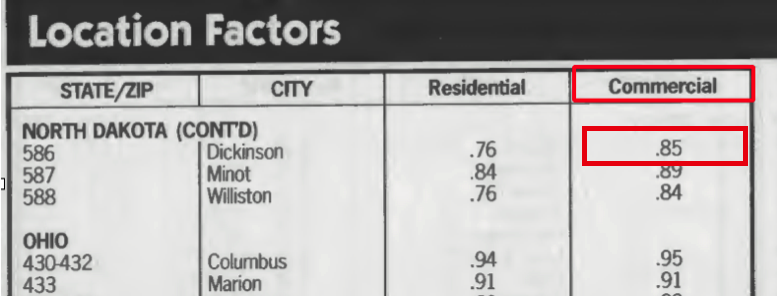
In the RS Means data, they develop all their data into a national average for publishing, and then they publish Location Factors for different cities. For example, a location factor for Dickinson, North Dakota can be identified in the Location Factor table which is included in the back of each of the Gordian Guides with RS Means data (see Figure 5). The national average is 1.0, and the commercial construction location factor for Dickinson is 0.85. Therefore, if a building is estimated from the guide to cost $100 million, then the estimated cost in Dickinson would be $85 million. Gordian publishes both residential and commercial location factors in some tables. Note that the residential location factors are targeted toward single-family detached residential, not residential apartment buildings which would be considered commercial construction. Some guides also publish specific City Indexes which are more specific for altering the cost for both time and location within a given city. RS Means publishes city indexes for 20 large cities in the US.
There are also international indexes that allow estimates to be transitioned from one country to another, although this is certainly not as accurate for many purposes.
Understanding the Audience
One important aspect of cost estimating is to always understand and project your audience for the estimate. If you are developing an estimate for an owner, early in the project, you will want to make sure that the owner is aware of the potential variation, and that you clearly define what is included in the estimate, and which items are not included. For example, if you perform a Rough Order of Magnitude estimate using RS Means, the estimate will include construction costs, but it will not include the design fees, land cost, or extensive site work. These inclusions and exclusions vary by the type of estimate performed.
RS Means – What is Included?
RS Means data is collected from actual projects. This data collection approach, and the statistics performed after collection, can influence their ability to draw future projections from the data. Therefore, each of the 4 estimating methods defined in RS Means approaches has some items excluded. The following items are always excluded from RS Means data estimates due to their high level of variability on projects:
- Land cost
- Detailed site work
- Financing costs
The following additional items may be excluded from some of the types of estimates:
- Designer fee (not in ROM or Unit Cost – unless added)
- Contractor fee and home office overhead (not in Unit Price unless specifically added)
- Contractor general requirements (not in Unit Price unless specifically added)
Review Questions

