
15 Network Scheduling
Learning Objectives
After reading this chapter, you should be able to:
- Define the various terms used in the development of network schedules, e.g., critical path, total float, and free float.
- Develop a network diagram of a schedule and calculate the start/finish times and float values.
- Identify the critical path activities within a network diagram which includes float time values.
Network Scheduling
Network scheduling, sometimes called Critical Path Method (CPM) scheduling, is a detailed method for creating a connected schedule that calculates the schedule duration for a project. These schedules can be developed to incorporate all activities within a project, including design and construction activities, or they can be developed to plan and manage a specific scope of work, e.g., a steel erector developing a schedule for the erection of the steel. CPM schedule allow for determining the length of a project based upon the assumptions incorporated into the schedule, and they also allow a team to look at ‘what-if’ scenarios.
Developing a Network Schedule
There are multiple types of visual notations for representing a schedule. Three approaches include:
- Activity on Arrow
- Precedence Diagram (also known as Activity on Node, although this is not a very common term in the industry)
- Gantt Chart View
Activity on Arrow
The least frequently used visual representation of a schedule is the Activity on Arrow notation. In this visual notation, each activity is represented by an arrow (a line with an arrowhead at the end). The relationships are represented through nodes.
It is important to note that this representation is not frequently used, and is included in this book simply to allow everyone to understand the basics of the representation. We will not use this approach in any calculation examples.
Precedence Diagram
Precedence diagrams are the most common notation used for hand calculating a schedule, and can also help visualize the interactions between activities. In precedence diagrams, each activity is represented as a box. In the most simple form, the box simply contains the name of the activity, but the box can also have other attributes for the activity, e.g., duration, start and end times, or float. We’ll discuss these items when we start calculating schedules. The boxes are connected into the network using relationships which are represented by arrows. Some activities have durations, and others may be a milestone (an activity with no duration to represent a specific point in time). This notation is also sometimes referred to as Activity on Node, since the activities are represented by nodes (boxes) and the relationships are represented by arrows connecting the nodes.
Defining the Activities
In precedence and Gantt chart representations, there are the following two types of activities:
- Standard Activity: Has a duration and represents a task on a project
- Milestone Activity: Represents a point in time, with zero duration. A milestone can be a start (with only a start date) or a finish (with only a completion date) milestone.
One of the first steps in developing a schedule is to clearly define the standard activities to be performed, and the critical milestones that are important to the project. For standard activities, these could be items such as ‘place concrete in slab on grade’, ‘install windows on south face’, ‘paint corridor on 3rd floor’, or ‘erect tower crane’. Note that activities should always start with a verb (action) and include a clear element and/or location for the action, e.g., a building component (window), a location in the building or site, or a scope of work, such as a scope of the design. Activities can also relate to various design tasks such as ‘complete schematic design’, ‘complete foundation design’, or ‘complete reinforcing steel shop drawings for slab-on-grade’.
The milestones should define discrete points in time on the project. They will not begin with a verb since it is defining a state or milestone of the project. They will have no duration, and they typically show up in a graphical schedule as a diamond with no duration. A milestone may be a start or finish milestone. It will typically only carry one date within the as-planned schedule, either a start date (for start milestones) or a finish date (for finish milestones). Examples of a start milestone may include ‘Design Begins’ or ‘Notice to Proceed’ (the date a contractor can proceed with construction). Examples of finish milestones include ‘Design Complete’, ‘Excavation Complete’, ‘Steel Complete’, ‘Building Enclosed’, ‘Substantial Completion’ (when the building can be used for its intended purpose) and ‘Final Complete’ (all work on the project is complete).
Relationship Types
Once the activities are defined, the relationships between activities need to be defined. There are four different potential relationship types between activities:
- Finish-to-Start
- Finish-to-Finish
- Start-to-Start
- Start-to-Finish
These four relationship types, along with examples, are defined in the following sections.
Finish-to-Start Relationship
The finish-to-start relationship is the most common relationship type within design and construction schedules. This relationship simply states that one activity must be completed prior to starting the second activity. There are many examples of this type of relationship within building projects, with some examples including ‘Place Wall Foooting’ prior to ‘Construct Wall’, or ‘Install Drywall’ prior to ‘Paint Wall’. Examples during design could include ‘Complete Schematic Design’ prior to ‘Complete Design Development’. Additional examples along with a graphical representation using activity on arrow, precedence diagram, and Gantt view are included in Figure 3.
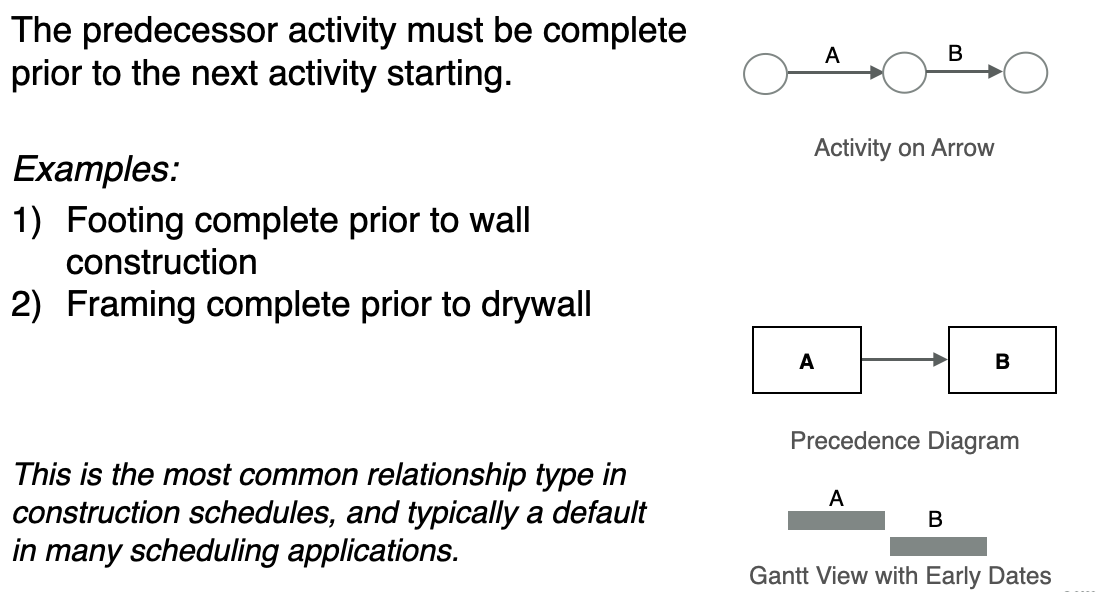
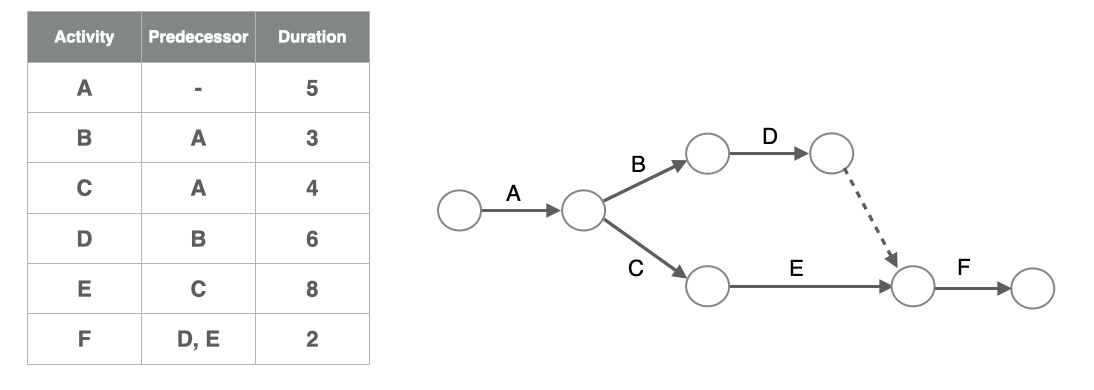
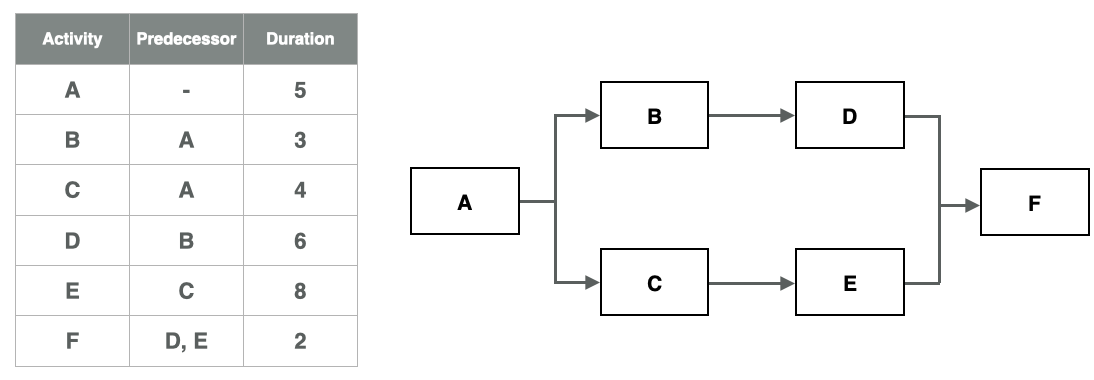
Some scheduling examples simply list ‘predecessor’ activities, e.g., see Figures 1 and 2. This implies that there is a Finish-to-Start relationship between the predecessor activity and the successor activity. In Figure 3, Activity A would be a predecessor to Activity B. Or, another way to state the same thing is that Activity B is a successor to Activity A.
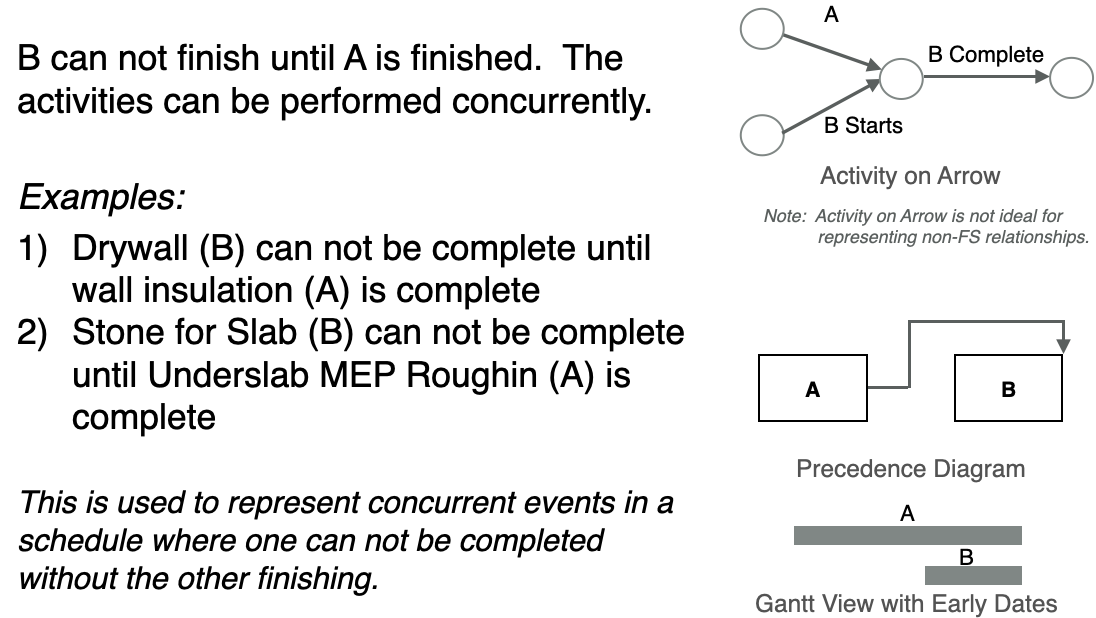
Finish-to-Finish Relationship
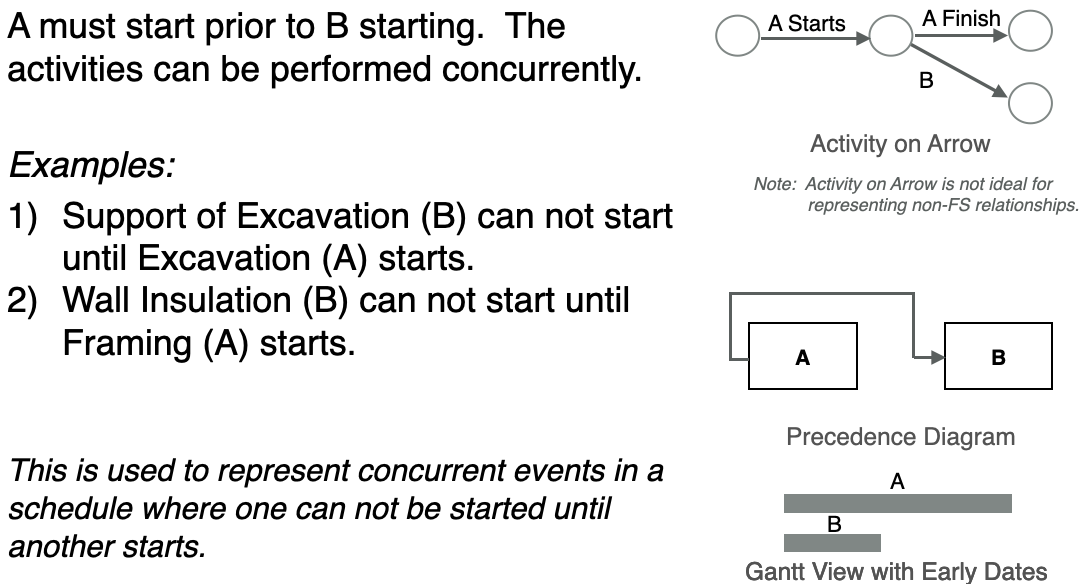
Start-to-Start Relationship
Start-to-Finish Relationship
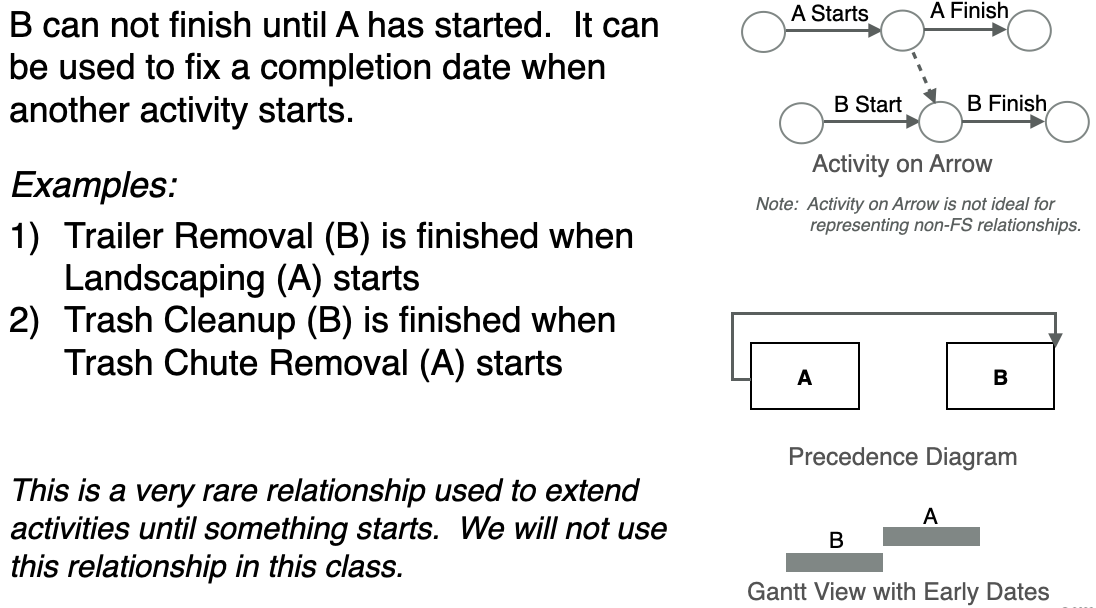
The start-to-finish relationship is very rarely used during project scheduling. It essentially states that an activity (B) can not finish unit an activity (A) has started. This activity can be used within a schedule to essentially fix the completion date of one activity (B) to the start date of another activity (A). Examples could include ‘Remove Trailer’ is finished when ‘Perform Landscaping’ is started, meaning that you are assuming that you will be removing the trailer before starting the landscaping. Another example could be that ‘Cleanup Bulk Trash’ is finished when ‘Remove Trash Chute’ is started, meaning that you would assume (or require) that all bulk trash be cleaned up before removing the trash chute. Again, this relationship type is very rarely used on projects. Graphical representations using activity on arrow, precedence diagram, and Gantt view are included in Figure 6.
Developing a Network Diagram
Calculating the Activity Durations
Each standard activity will have a duration with some time unit (e.g., hours, days, weeks, etc.). For the purposes of this book, we will focus on the use of days as the standard time unit unless otherwise noted. For some very time critical schedules or more detailed schedules, planners may use hours or even minutes for activity durations.
Team members can use many potential information resources when determining the duration for a standard activities. They may reference their previous project data to identify the duration for some activities, e.g., the time to receive a permit within a particular municipality or the time to excavate a similar project. For more typical activities, it is beneficial to be able to identify a production rate and scope quantities for the activity. For example, if you are performing excavation for the building, you may measure the excavation quantity in cubic yards of earth. Then, a production rate per day can be used to define the overall activity duration, e.g., if you can excavate 200 cy per day, then if you have 1,000 cy of excavation, the duration will be 5 days.
Duration = Total Activity Quantity / Quantity per Time Unit
Duration = 1,000 CY / 200 CY per Day = 5 days
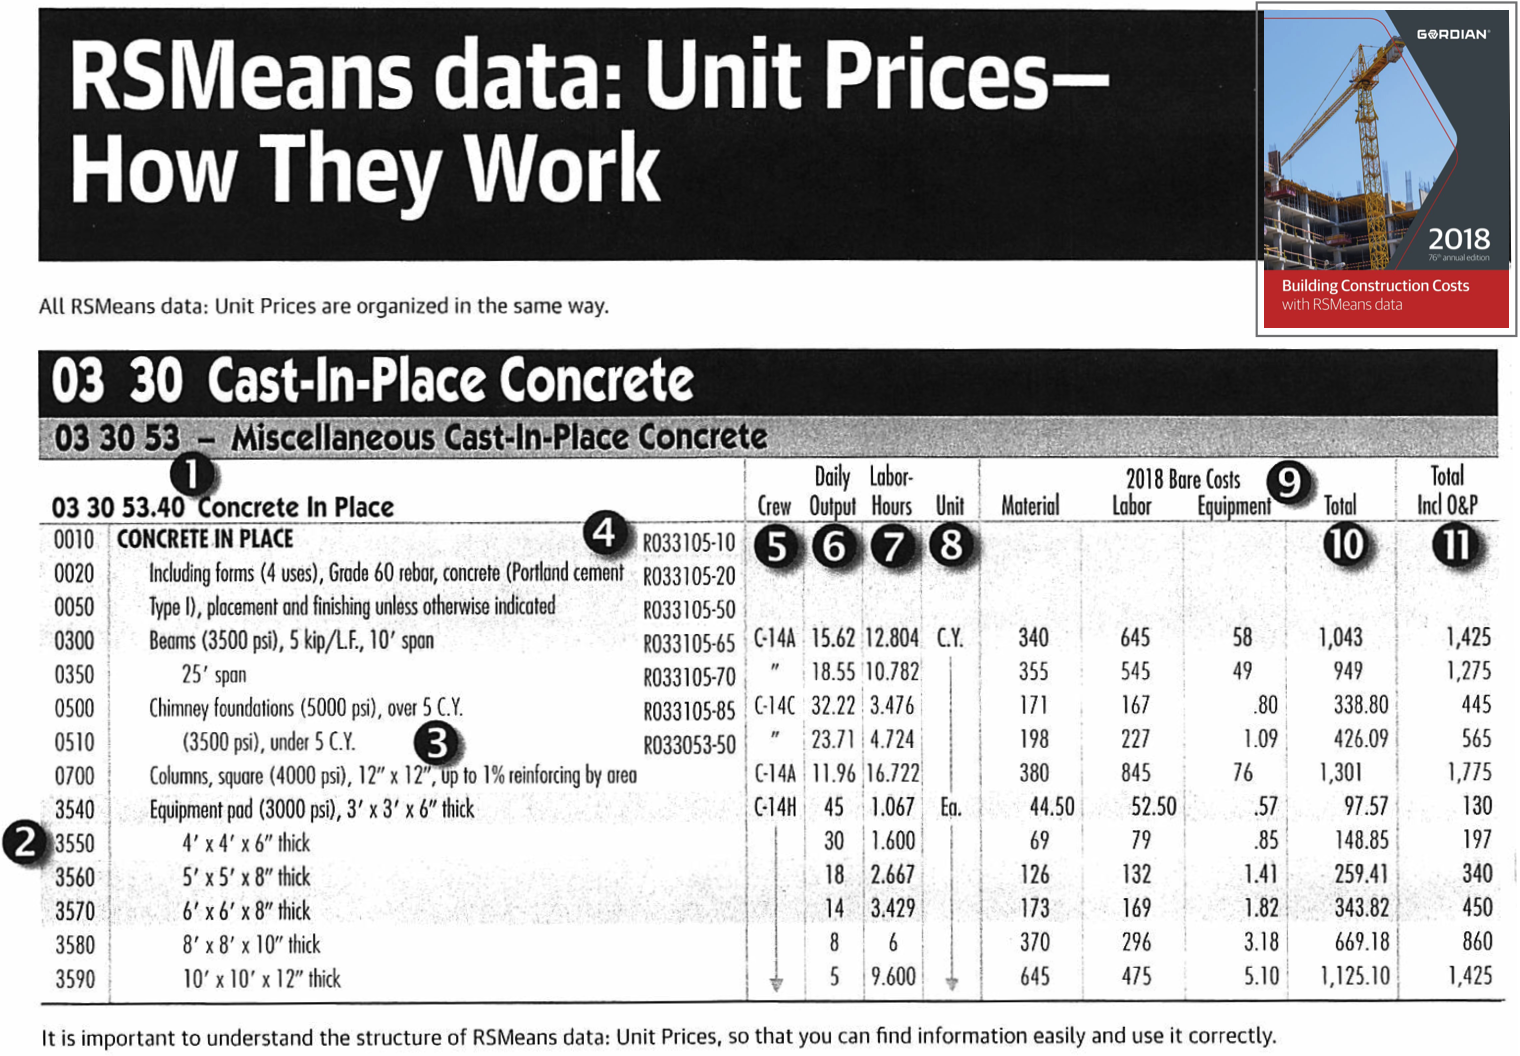
If you do not have historical data from previous projects to rely upon, then the R.S. Means data within the Gordian Guides can be used to estimate the daily output for a standard activity for one crew (see Figure 7). For example, if you have cast-in-place 12″x12″ square columns, a Crew C-14A can put in place an average of 11.96 CY per day (see line 03 30 53.40 0700 in Figure 7 – Crew in the column marked 5, unit of measure in the column marked 8, and daily output in the column marked 6). Note that you can also calculate the labor hours, which considers the number of people on the crew. We would not use labor hours in the schedule calculation unless you have a crew composition that varies from the defined crew sizes in the RS Means data.
Calculating the Start and Finish Times for Activities
Once a network is developed, including all activities and the relationships between activities, then the schedule times for the network can be calculated. These activity times are calculated as start and finish times for each activity.
Network Scheduling Software
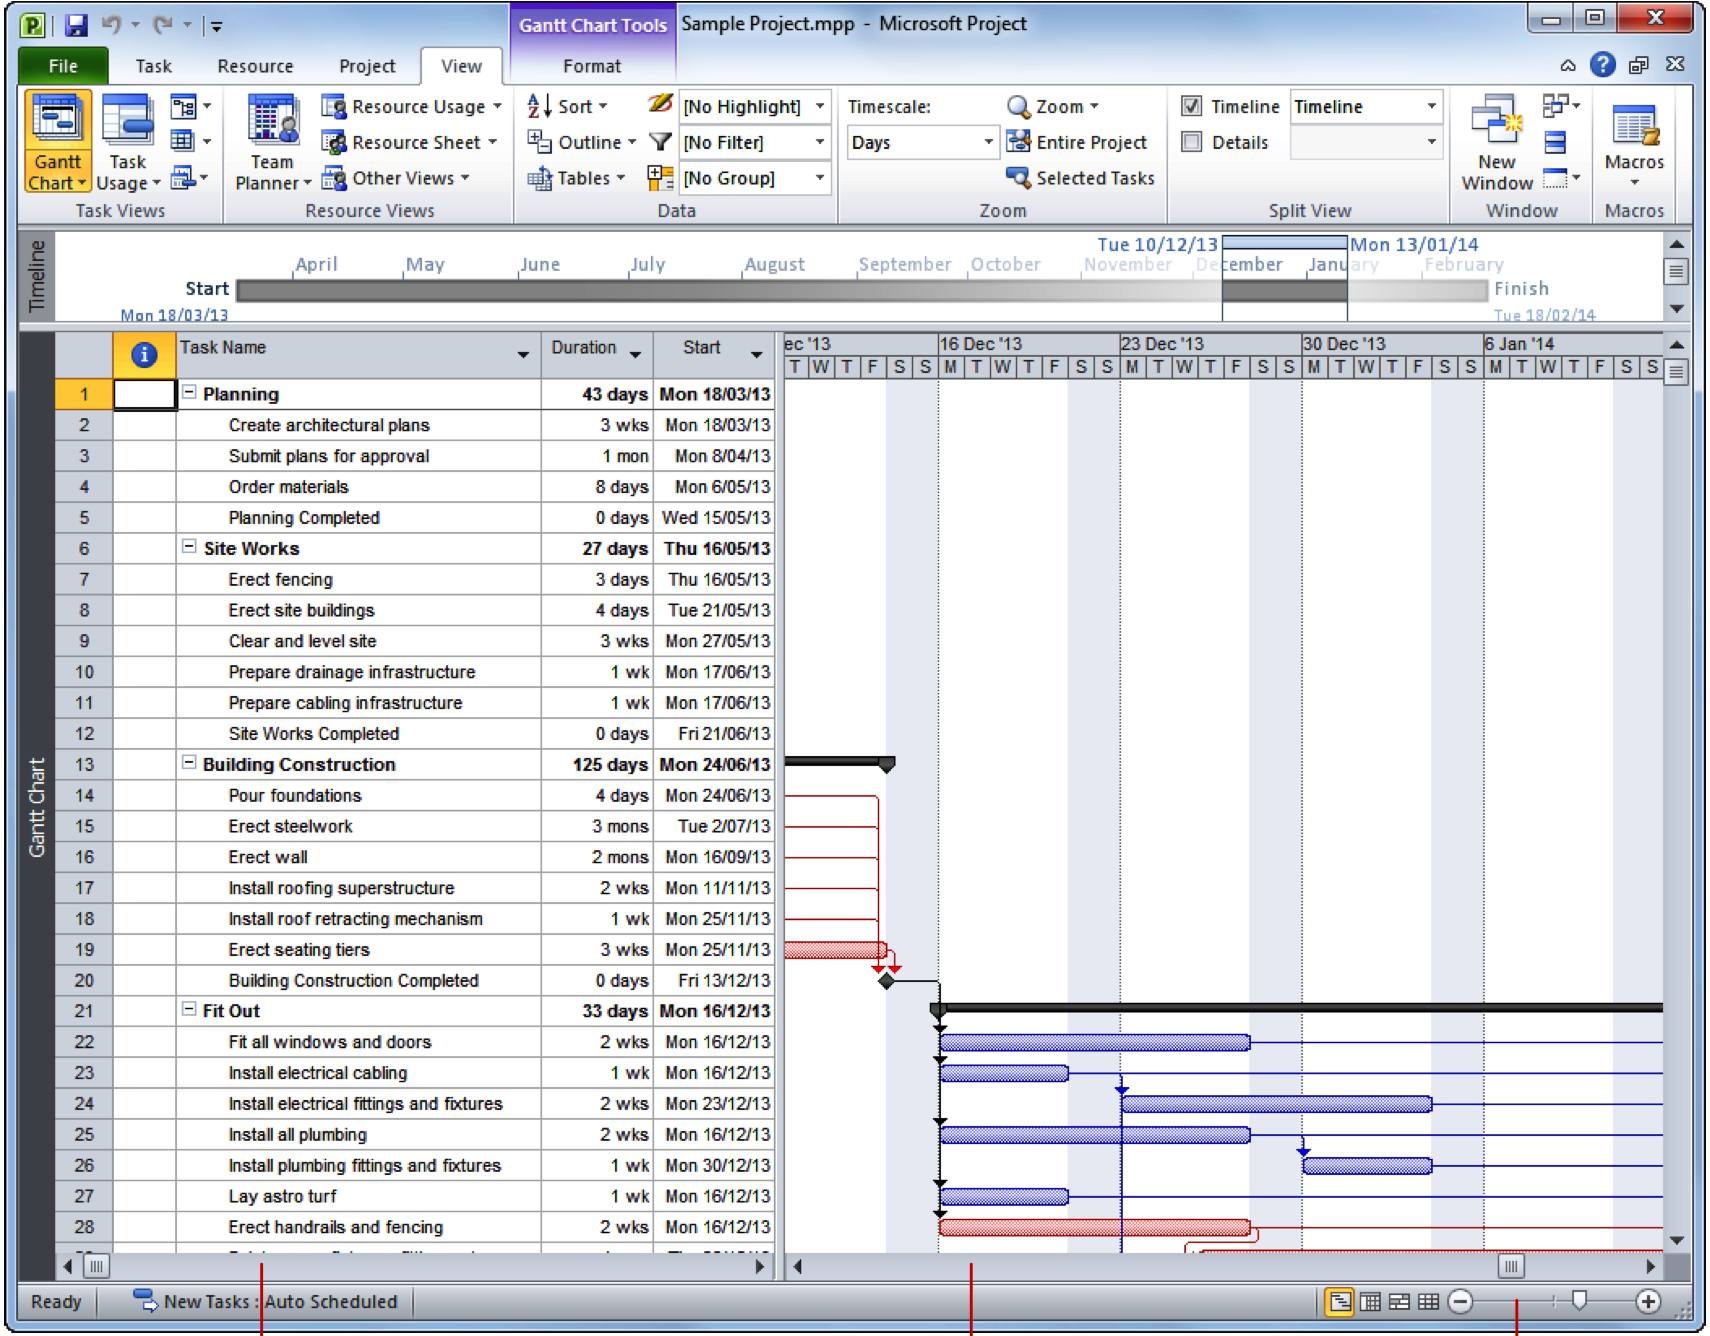
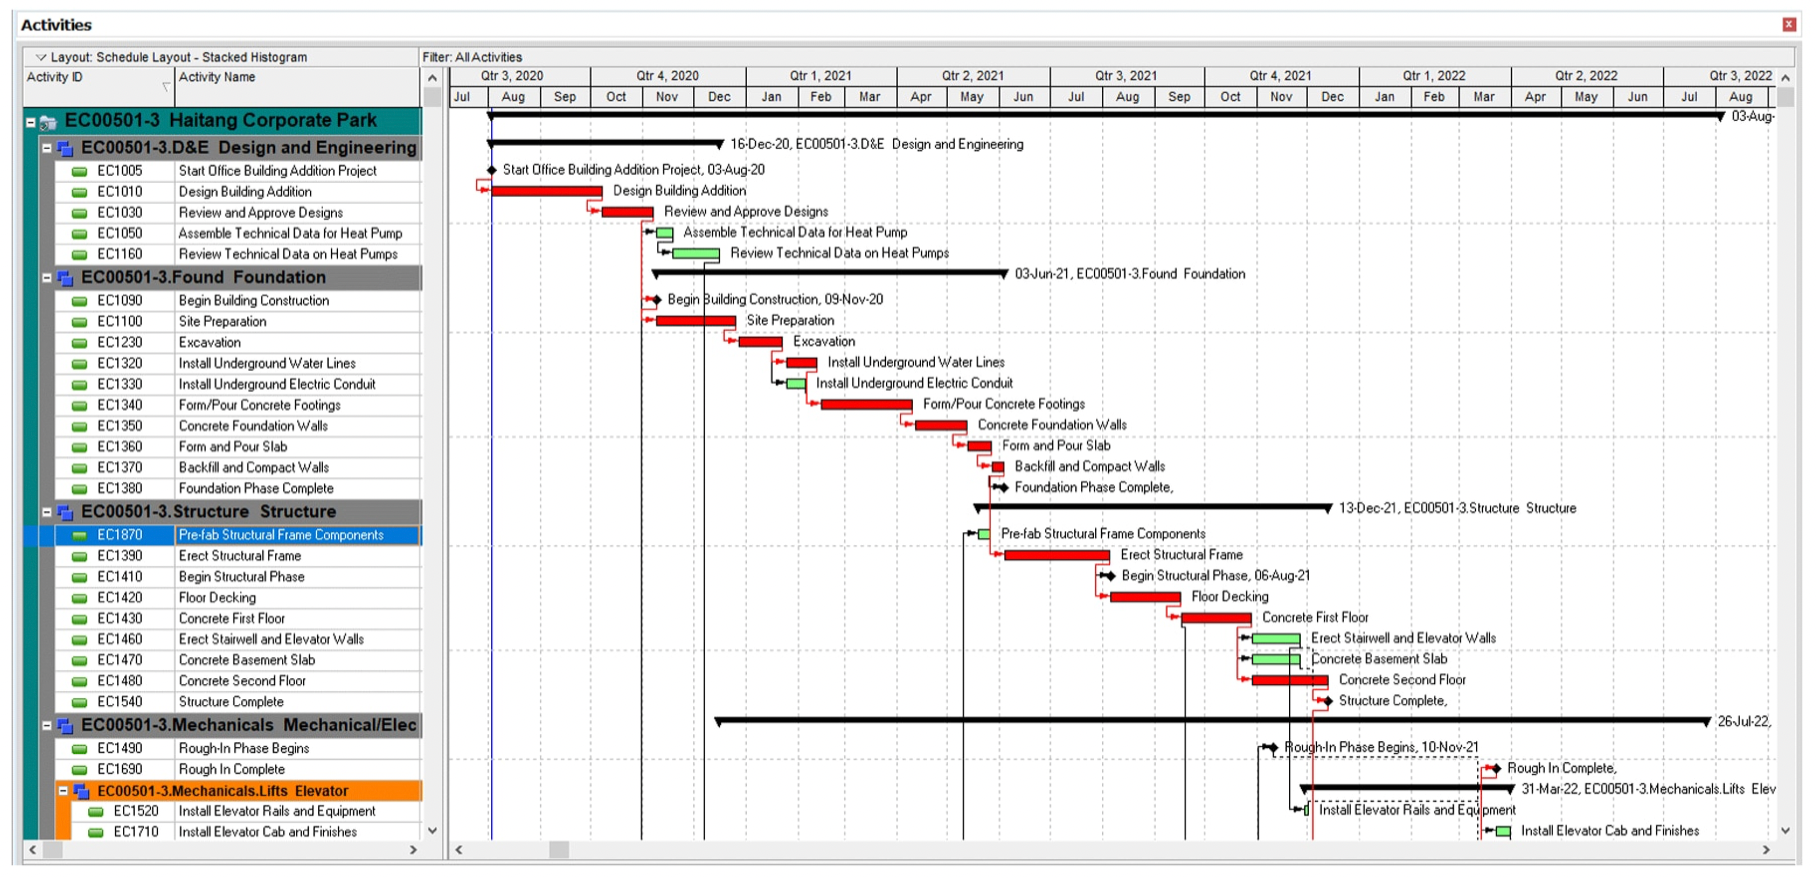
While this chapter has reviewed a detailed approach to calculating a network schedule by hand, it is important to note that almost all network schedules on construction projects are performed by using some form of computer software. Two common software applications used in the industry for CMP scheduling are Microsoft Project and Oracle Primavera P6 EPPM. In general, Microsoft Project is lower cost and easier to learn, but has less functionality related to Primavera P6 (or Oracle Primavera Cloud – an online version).
Microsoft Project is part of the Microsoft Office 365 suite of tools, but it is not a typical application that many organizations purchase within their corporate Office 365 suite. It is fairly easy to use, with many people using the default Gantt chart view to develop their schedule. There are many tutorials available online to learn how to use MS Project.
For Penn State students, both Microsoft Project and Primavera P6 are available to you in the computer labs. We will first learn Microsoft Project in this course and then use Primavera P6 in the more advanced construction courses.
Review Questions
