
Chapter 9 – Menu Analysis (Engineering)
This chapter is remixed from Basic Kitchen and Food Service Management by The BC Cook Articulation Committee.
Chapter Outline:
- Introduction to menu analysis
- Calculating average contribution margin
- Profitability of menu items
- Calculating average popularity
- Menu revisions
- Using specials and feature items
- Arranging items on the menu
Learning Objectives:
- Explain menu analysis using the contribution margin method
- Suggest marketing and menu mix strategies for menu items based on menu analysis (high and low contribution margins combined with popularity)
- Suggest strategies for managing food cost and revenue based on a menu analysis
Key Terms:
- Menu analysis
- Contribution margin
- Profitability
- Popularity
Menu Analysis
A basic menu analysis determines how often each item on the menu is sold. This basic statistic can be used with cost percentages, menu prices, and sales values to make generalizations about the relative value of each menu item. Figure 1 shows a menu analysis worksheet for a lunch menu. Most POS systems can generate this type of information at the end of a shift, day, week, or month.
| Menu Item | Total Sold | Menu Price | Portion Cost | Food Cost % | Portion C.M.* | Total Food Sales | Total Food Cost | Total C.M.* | Total C.M.*% |
|---|---|---|---|---|---|---|---|---|---|
| Hamburger | 12 | $10.95 | $2.75 | 25% | $8.20 | $131.40 | $33.00 | $98.40 | 24% |
| Cheeseburger | 8 | $11.95 | $4.25 | 36% | $7.70 | $95.60 | $34.00 | $61.60 | 15% |
| BLT Sandwich | 10 | $11.95 | $3.75 | 31% | $8.20 | $119.50 | $37.50 | $82.00 | 20% |
| Ham sandwich | 5 | $10.95 | $3.50 | 32% | $7.45 | $54.75 | $17.50 | $37.25 | 9% |
| Fried Chicken | 4 | $14.95 | $5.25 | 35% | $9.70 | $59.80 | $21.00 | $38.80 | 9% |
| Clubhouse | 6 | $12.95 | $4.00 | 31% | $8.95 | $77.70 | $24.00 | $53.70 | 13% |
| Steak Sandwich | 5 | $15.95 | $7.25 | 45% | $8.70 | $79.75 | $36.25 | $43.50 | 10% |
| Totals | 50 | - | - | - | $618.50 | $618.50 | $203.25 | $415.25 | - |
Chapter 9, Figure 1
*C.M.= contribution margin
The statistics provided in a menu analysis have several uses. For example, the total sold statistics can be used to predict what future sales numbers will be. This information is valuable for ordering supplies and organizing the kitchen and kitchen staff to produce the predicted number of items.
Even more important than popularity is the contribution margin of each item. Often an average contribution margin is found and compared with the contribution margin of individual items.
Average Contribution Margin
average margin = total margin/number of sales= $415.25/50= $8.31
The contribution margin for each item is found by subtracting the cost of the item from the selling price. In the example in Figure 1, the contribution margins are given in Column F.
Some decisions can be made comparing items:
- The hamburgers, cheeseburgers, BLTs, and ham sandwiches are below the average contribution margin. The first three items are good sellers and account for over half of the sales (30/50 = 60%) and they may be able to pull their weight by slightly increasing their prices. By adding $0.50 to the menu price of each of these items, they would each have a contribution margin above or close to $8.31.
- The ham sandwich is significantly lower than the average margin and is also low in sales. It might be best to drop this item from the menu and replace it with something else.
- The fried chicken has a good contribution margin but its sales are a little on the low side. To increase sales, the chicken might be given more prominence on the menu or might be offered as part of a special with a small salad for a slight increase in price. As long as the additions have a reasonable food cost percentage and are inexpensive compared to the portion cost of the chicken, the increase in sales should have a positive impact on the total contribution margin (the values in Column I).
The type of menu analysis must be tempered with common sense. Because averages are used to determine an acceptable margin or level of sales, some menu items will automatically be under the average just as some will have to be above the average. If items that are under the average are replaced, the next time a menu analysis is done there will be a new average and other items under that average. Taken logically, your menu options will run out before you have every item being exactly at the average!
Given that menu items are usually broken down into categories, this type of analysis is most effective when comparing similar items. An analysis of all of the desserts or starters to compare their margins is much more effective than comparing the margin of a dessert against a lobster dinner, which by the very nature of its price and cost will always have a higher contribution margin.
Profitability
You want to sell menu items that have a high margin of profitability. The relative profitability of an item is calculated by comparing its contribution margin to the average contribution margin (ACM) of all items. The contribution margin is the selling price of a menu item minus the standard food cost of the item. This is the amount that the item contributes to the labor cost, other costs of doing business, and profit. The ACM equals the total contribution margin divided by total numbers of items sold. Profitable items have a contribution margin equal to or higher than the ACM.
Desserts and appetizers may have lower contribution margins than entrées. This is because these items generally have lower prices and cannot contribute the same dollar value of contribution margin, even though their food cost percentage may be lower than entrée items. Also, the restaurant may wish to tempt patrons to add these items to their purchase, increasing the average cheque size. If you can sell more to an individual guest, you increase the revenues without increasing the labor costs and other costs to the same extent.
For example, if the customer orders and appetizer before the entrée, he or she does not take up any more time in the restaurant (that is, the customer does not decrease seat turnover) because the appetizer is served and eaten during the normal waiting time for preparing the main dish. As well, the additional labor of the server is minimal because even without ordering an appetizer service may still be needed to provide additional bread or refill water glasses. Thus, the sale of the appetizer will increase the profitability of the restaurant even though the contribution margin is not as high.
Desserts may also have a low contribution margin. Often desserts are purchased ready-made (e.g., cakes and cheesecakes). There may be little labor cost in serving these items so the overall contribution of the dessert item to profitability is high.
Items that require little preparation (that is, have a low labor cost) may still generate a significant contribution to margin even when their food costs are higher. Even if the food cost of the item was very high and the CM low, you would want to keep this item because the combined labor cost and food cost is low. Thus the amount this item contributes to the fixed cost of the business is high.
Potential Profitability of Menu Items
To determine the potential profit in a menu item, you must have a good idea of the potential cost of producing the item. Pre-costing the menu means you determine the cost of producing every item on the menu under ideal conditions. The assumption is that cooks will follow directions, the portions will be accurately measured, and all the portions will be sold. The results are the optimum costs; in reality, costs could be higher.
Popularity
Another factor to consider when reviewing your menus is the popularity of an item. Popularity is determined by comparing sales of items to expected popularity. The expected popularity is the predicted menu mix (sometimes called the sales mix) if each of the menu items in a category were equally popular.
An example is provided in Figure 2, which lists seven appetizers. The expected popularity would be 100% divided by 7 (the number of menu items) or 14.3%. Menu analysis assumes that popular items have sales of 70% or more of the expected popularity. In the example, appetizers would have to exceed 10% (70% of 14.3%) of appetizer sales in order to be considered popular. Which of the items is popular?
| Menu Item | Total Sold | Menu Price | Portion Cost | Food Cost % | Portion C.M. | Total Food Sales | Total Foo Cost | Total C.M.* | C.M.*% |
|---|---|---|---|---|---|---|---|---|---|
| Thai Wings | 31 | $6.25 | $1.93 | 28.59% | $482 | $59.83 | $209.25 | $149.42 | 4.63% |
| Dry Ribs | 211 | $6.75 | $1.72 | 25.48% | $5.03 | $362.92 | $1,424.25 | $1,061.33 | 31.54% |
| Nachos | 71 | $6.95 | $1.53 | 22.01% | $5.43 | $108.63 | $493.45 | $384.82 | 10.61% |
| Calamari | 19 | $7.50 | $2.23 | $29.73% | $5.27 | $42.37 | $142.50 | $100.13 | $2.84% |
| Soup & Salad | 78 | $5.95 | $1.55 | 26.05% | $4.40 | $120.90 | $464.10 | $343.20 | 11.66% |
| Thai Salad | 129 | $6.45 | $1.68 | $26.05% | $4.77 | $216.72 | $832.05 | $615.33 | 19.28% |
| Cajun Caesar | 130 | $6.95 | $1.76 | 25.32% | $5.19 | $228.80 | $903.50 | $674.70 | 19.43% |
| Total Appetizer | 669 | - | - | ACM = | $4.98 | $1,140.70 | $4,469.10 | $3,328.93 | 100% |
*C.M.= contribution margin
You can see at a glance that Dry Ribs is the most popular appetizer, followed by Thai Salad and Cajun Caesar. Nachos and Soup & Salad fall just slightly over the 10% boundary. Thai Wings and Calamari show dismal results in terms of popularity with only 4.63% and 2.84% of appetizer sales.
Sales of menu items are analyzed to put menu items in four categories:
- Popular and profitable
- Popular but not profitable
- Not popular but profitable
- Neither popular nor profitable
Figure 3 displays a graph showing the popularity of the appetizers from the example over these four categories. The graph shows popularity on the vertical axis and contribution margin on the horizontal axis. A line is drawn vertically to indicate the ACM and horizontally to show 70% of expected popularity. This allows you to see at a glance which category an item falls into.
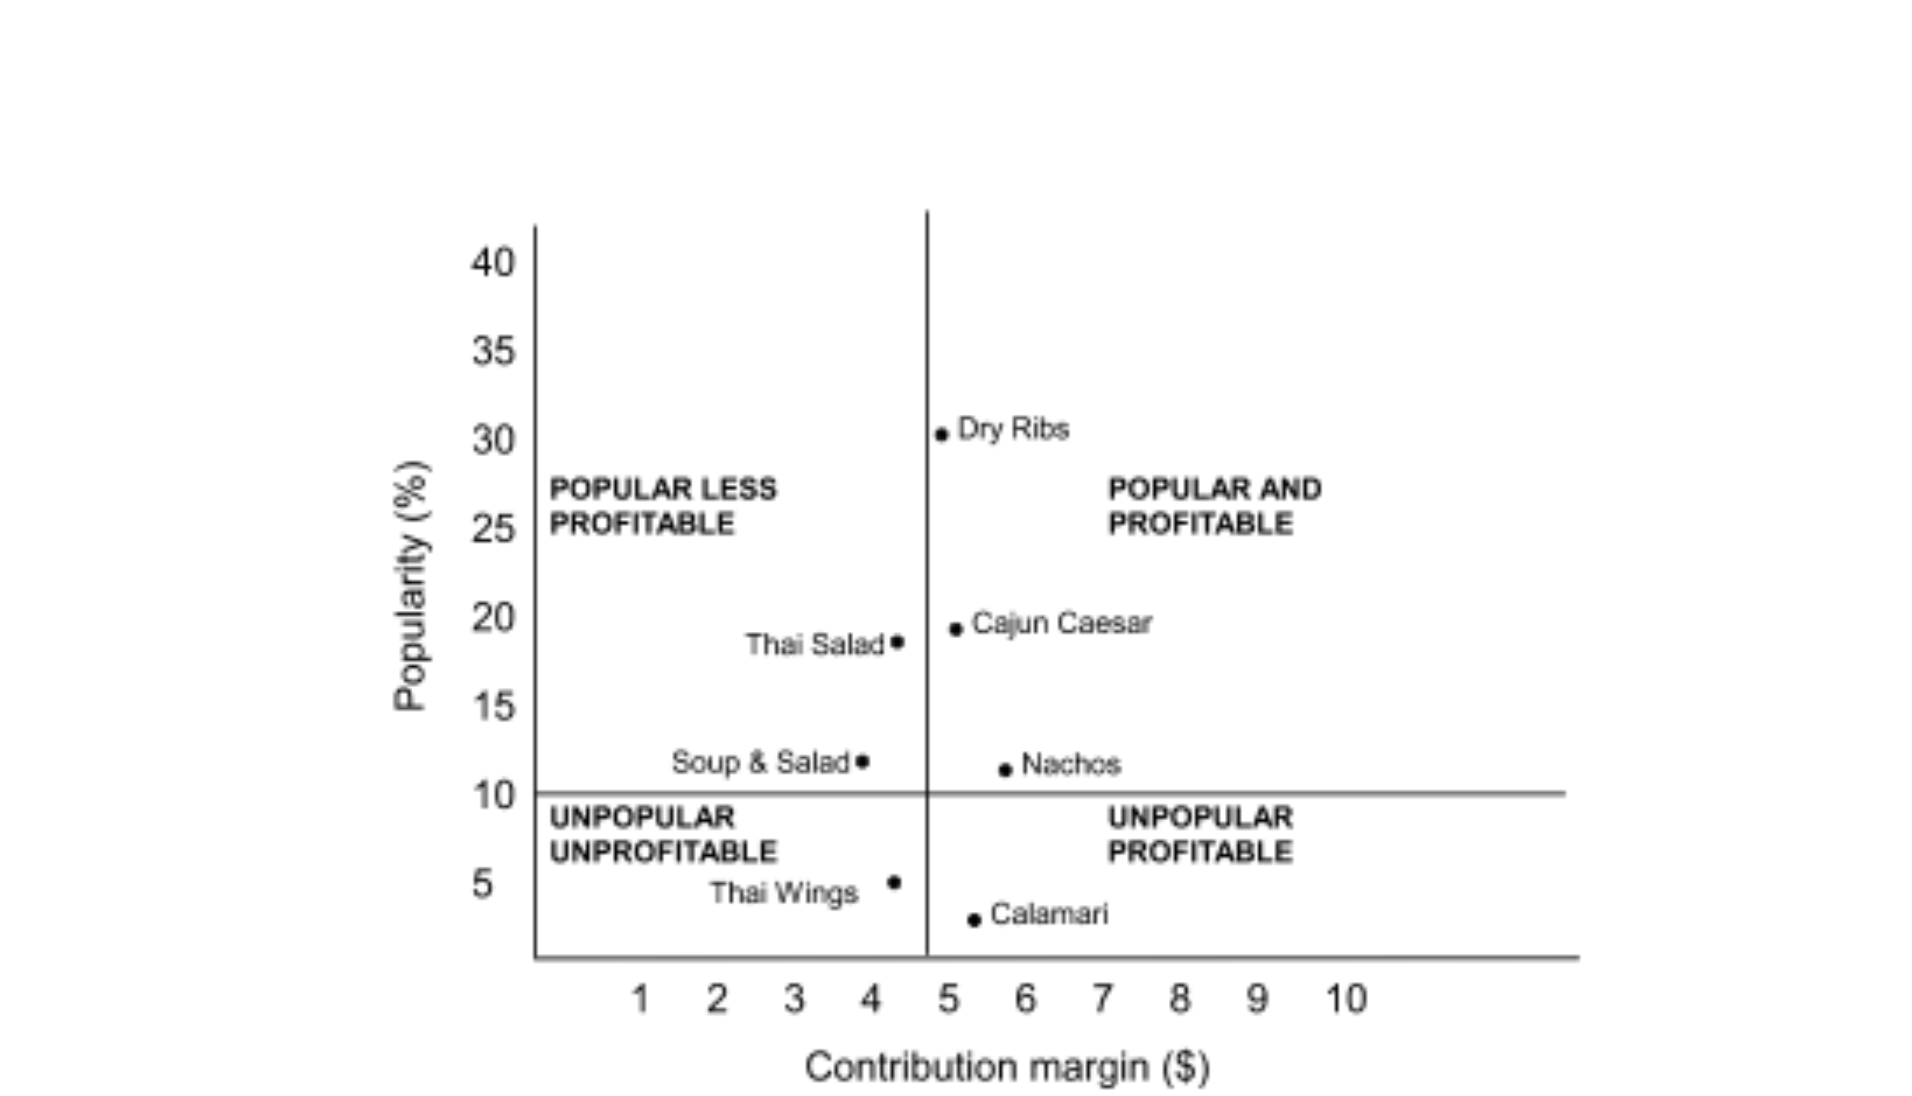
Long description:
The graph has an X axis, and a Y axis. The X axis is labeled “Contribution Margin ($)”, starts at 0, ends at 10, and is incremented in intervals of 1. The Y axis is labeled “Popularity (%), starts at 0, ends at 40, and is incremented in intervals of five. Both Axis start at 0 and do not go negative. Within the graph are 4 subsections of the graph. Popular Less Profitable (upper left section), Popular and Profitable (upper right section), unpopular unprofitable(bottom left), and unpopular profitable (bottom right). These subsections are used as a key to determining what menu item falls where.
End long description
The graph shows that Thai Wings and Calamari were very unpopular menu items, but it also provides information on profitability? Thai Wings has a contribution margin that is lower than the ACM for appetizers. Calamari has a contribution margin that is higher than the ACM.
Computer programs may automatically calculate contribution margins and popularity. The information may be presented in tables or spreadsheets as shown above, or in a four-box analysis, with less detail, as shown in Table 9.1.
| Popularity | Unprofitable | Profitable |
|---|---|---|
| Popular | Thai Salad – (4.65, 19.28)
Soup and Salad – (4.40,11.66) |
Dry Ribs – (5.03,31.54)
Cajun Caesar – (5.19, 19.43) Nachos – (5.43, 10.61) |
| Unpopular | Thai Wings | Calamari |
Table 9.1 Profitability of Popular and Unpopular Items
Menu Revisions
Popular and profitable items are ones you want to maintain on your menu. Maintain the specifications of the item rigidly. Do not change the quality of the product served. Feature the item in a prominent location on the menu. You want to sell this item, so make sure that customers see it. Have servers suggestively sell the item. For example, when asked for suggestions, they could say, “You may want to try our Linguine Chicken. It is very popular. It has a cream sauce with lots of fresh basil.” Test the possibility of increasing prices by raising the price slightly.
If an item is popular but not profitable, you want to see if you can increase the contribution margin without reducing its popularity. Increase prices carefully and gradually. If the item is attractive because of its high value, it may still be a good value after a price increase. You could also increase the contribution margin by reducing the cost of the accompaniments. For example, you might substitute less costly vegetables. You might also try to reduce costs by decreasing the portion size. If you are unable to improve the item’s popularity, you may want to relocate it to a lower profile part of the menu. If the item has a very low labor cost, you may be able to justify the lower contribution margin because less revenue is needed to compensate for the labor cost.
Not popular but profitable items are often a puzzle. You want to sell these items, but your challenge is to encourage the guests to buy them. Shift demand to these items by repositioning them on the menu. Encourage servers to suggestively sell these items. Consider decreasing the price slightly or adding value by offering a larger portion size, more expensive accompaniments or garnishes. However, you need to be cautious so that you do not change the item into a popular but unprofitable item.
Items that are neither popular nor profitable are obvious candidates to remove from the menu. They are not pulling their weight. The only time such an item might be left on the menu is if it provides an opportunity to use leftovers and has low labor costs associated with its preparation.
Using Specials and Feature Items
Another way to balance the menu is by using daily specials and feature items. For example, assume you have been tracking your food costs using a daily food cost control sheet (refer to Chapter 8, Figure 3)… It is halfway through the month and you are running a slightly higher than average food cost for the month so far. Choosing to run specials that have lower food costs or having the staff feature and promote better food cost items should help to bring the targets in line by the end of the month.
Arranging Items on the Menu
Another way of engineering the menu is by strategically arranging the items on the menu. Some menus use callout or feature boxes to highlight certain items, others have pictures featuring certain menu items, and others may note an item as a house specialty. These are all ways to attract the attention of the customer, and in most cases, you will find that it is these items that sell the best. If these items also have high contribution margins and/or low food costs, they will increase profitability. Featuring the items with the lowest margins and highest food costs will have the opposite effect, and likely mean that you will not be in business for very long. There are also some psychological reasons that things will sell on a menu. Often the most expensive or the least expensive item will not sell as well as other items on the menu because customers do not want to appear either extravagant or cheap in front of their guests. Using descriptions that entice the customer (e.g., “award-winning,” “best in the city”) will increase the sale of a particular item, but make sure you can deliver on the promise! All in all, balancing the menu is something that takes time and experience to do well, but is a skill that you will need to run a profitable kitchen.
Review Questions
- What is the difference between food cost % menu analysis and contribution margin menu analysis?
- Why must the total contribution margin for all menu items be calculated in order to calculate the average contribution margin for a full menu? OR (Why can’t the average contribution margin be calculated by taking the average of the individual contribution margins for each menu item?)
- What actions might a foodservice manager take regarding various menu items after completing a menu analysis?
- Why should menu analysis be tempered with common sense?
- Why can it be a good idea to try to sell appetizers and desserts even though they may have a lower than average contribution margin?
- How are menu analysis (engineering) and menu psychology related?
Review Exercises
Dessert Strategy Question:
| Popularity | Unprofitable | Profitable |
| Popular | Cheesecake | Chocolate mousse |
| Unpopular | Fruit Tart | Tiramisu |
References
Author, The BC Cook Articulation Committee, Sep 2015. The Principles of Menu Engineering. In Pressbooks Edition 1.0. Basic Kitchen and Food Service Management.
Retrieved from https://opentextbc.ca/basickitchenandfoodservicemanagement/
