
Chapter 15 – Cost-volume Profit (CVP) Analysis and Break-Even Point
Chapter Outline:
– Introduction to CVP analysis
– Calculations for a CVP analysis
– Using a CVP to target a desired profit
– Break-even point explained
– Computing the break-even point
Learning Objectives
- Explain how Cost-Volume Profit (CVP) analysis is related to planning for a profitable business
- Describe the relationship between sales volume, costs and profit
- Describe the notion of costs behavior (variable vs. fixed)
- List the assumptions behind a CVP analysis
- Calculate a CVP analysis using a step-by-step process
- Explain the concept of a Break-Even Point
- Calculate break-even points for both sales/revenue dollars and number of units sold.
Key Terms and Concepts:
- CVP analysis
- revenues and sales volume
- contribution margin income statement
- contribution margin
- contribution margin percentage
- variable costs/ expenses
- fixed costs/expenses
- operating income
- break-even point
- break-even sales
- break-even number of units sold
Introduction:
CVP analysis looks at the effect of sales volume variations on costs and operating profit. The analysis is based on the classification of expenses as variable (expenses that vary in direct proportion to sales volume) or fixed (expenses that remain unchanged over the long term, irrespective of the sales volume). Accordingly, operating income is defined as follows:
Operating Income = Sales – Variable Costs – Fixed Costs
A CVP analysis is used to determine the sales volume required to achieve a specified profit level. Therefore, the analysis reveals the break-even point where the sales volume yields a net operating income of zero and the sales cutoff amount that generates the first dollar of profit.
Cost-volume profit analysis is an essential tool used to guide managerial, financial and investment decisions.
Cost-Volume Profit Analysis
Contribution Margin and Contribution Margin Percentage
The first step required to perform a CVP analysis is to display the revenue and expense line items in a Contribution Margin Income Statement and compute the Contribution Margin Ratio.
A simplified Contribution Margin Income Statement classifies the line items and ratios as follows:
Contribution Margin Income Statement
|
Statement Item |
Amount |
Percent of Income |
|---|---|---|
|
Sales |
$100 |
100% |
|
(Deduction) Variable Costs |
$60 |
60% |
|
(Total) Contribution Margin |
$40 |
40%* |
|
(Deduction) Fixed Costs |
$30 |
30% |
|
(Total) Operating Income |
$10 |
10% |
Table 15.1 Contribution Margin Income Statement. The table shows the percent of income for sales, contribution margin, and operating income are observed as totals, after variable and fixed cost deductions.
* Contribution Margin Percentage
The method relies on the following assumptions:
- Sales price per unit is constant (i.e. each unit is sold at the same price);
- Variable costs per unit are constant (i.e. each unit costs the same amount);
- Total fixed costs are constant (i.e. costs such as rent, property taxes or insurance do not vary with sales over the long term);
- Everything produced is sold;
- Costs are only affected because activity changes.
The equation: Operating Income = Sales – Variable Costs – Fixed Costs
Sales = units sold X price per unit
Variable Costs = units sold X cost per unit
The first equation above can be expanded to highlight the components of each line item:
Operating Income = (units sold X price per unit) – (units sold X cost per unit) – Fixed Cost
The contribution margin is defined as Sales – Variable Costs. Therefore,
Contribution Margin ($) = (units sold X price per unit) – (units sold X cost per unit)
And the Contribution Margin Percentage (CM%) is computed as follows:
CM% = Contribution Margin ($) / Sales ($)
Accordingly, the following is another way to express the relationship between contribution margin, CM percentage, and sales:
Contribution Margin $ = Sales $ X Contribution Margin %
The contribution margin percentage indicates the portion each dollar of sales generates to pay for fixed expenses (in our example, each dollar of sales generates $.40 that is available to cover the fixed costs).
As variable costs change in direct proportion (i.e. in %) of revenue, the contribution margin also changes in direct proportion to revenues, However, the contribution margin percentage remains the same. Example:
Revenues $100 – (20 units X $5)
Var. Costs $60 – 60% (20 units X 60%)
CM $40 – 40%
The equation above demonstrates 100 percent of income ($100) minus $60 from variable costs equals $40 contribution margin. the equation below demonstrates revenues doubling to $200 and deducting fixed costs of $120, that results in $80 contribution margin.
If revenues double:
Revenues $200 – (40 units X $5)
Fixed Costs $120 – 60% (40 units X 60%)
CM $80 – 40%
Targeted Profit
CVP analysis is conducted to determine a revenue level required to achieve a specified profit. The revenue may be expressed in number of units sold or in dollar amounts.
Income Statement
| Statement Item | Amount | Percent of Income |
|---|---|---|
|
Sales (20 units X $5) |
$100 |
100% |
|
(Deduction) Variable Costs (20 units X $3) |
($60) |
(60%) |
|
(Total) Contribution Margin |
$40 |
40% |
|
(Deduction) Fixed Costs |
($30) |
(30%) |
|
(Total) Operating Income |
$10 |
10% |
Table 15.2 Income Statement. The table shows an income statement that observes total income from sales, contribution margin total after variable cost deduction, and operating income total after fixed cost deduction.
How much sales is required to achieve a $20 profit?
This can be answered by finding the number of units sold or the sales dollar amount.
- Required number of units sold:
Profit = Revenues – Variable Costs – Fixed Costs
$20 = (Units Sold X $5) – (Units Sold X $3) – $30
$50 = (Units Sold X $5) – (Units Sold X $3)Sales deducted from Variable Costs is the definition of contribution margin
$50 = (Units Sold) X ($5-$3)
($5-$3=$2 which is the $ contribution margin per unit)
$50/$2 = 25 Units sold needed to achieve $20 in profit
Units sold to achieve targeted profit = [latex]\huge{\frac{(\text{Fixed Costs Dollar + Targeted Profit Dollar})}{\text{Contribution Margin Dollar Per Unit}}}[/latex]The previous equation reads: units sold to achieve targeted profit, equals fixed costs dollars, plus targeted profit dollar, divided by contribution margin dollar per unit
Verification:
Income Statement
Table 15.3 Income Statement Statement Item Dollar Amount Percent of Income Sales (25 units X $5)
$125
100%
(Deduction) Variable Costs (25 units X $3)
($75)
(60%)
(Total) Contribution Margin (25 units X $2)
$50
40%
(Deduction) Fixed Costs
($30)
(30%)
(Total) Targeted Operating Income
$20
10%
Table 15.3 Income Statement. The table shows an income statement that observes sales, contribution margin, and targeted operating income totals, after variable and fixed cost deductions.
Note: while Operating Income doubled, (from $10 to $20) only 5 additional units sold (+25%) were required as only variable costs changed while fixed costs remained at $30.
- Required sales dollar amount
Profit $ = sales $ – Variable Costs $ – Fixed Costs $
and
Sales $ – Variable Costs $ = Contribution Margin $
So,
Profit $ = Contribution Margin $ – Fixed Costs $We saw earlier that Contribution
Margin $ can be expressed as:
Sales X Contribution Margin %Contribution Margin $ = (Sales $ x Contribution Margin %)
Profit $ = (Sales $ x Contribution Margin%) – Fixed Costs $
Profit $ + Fixed Costs $ = (Sales $ x Contribution Margin %)
(Targeted Profit $ + Fixed Expense $) / Contribution Margin % = Sales $
The previous equation for Sales $ is calculated by adding Targeted Profit $ and Fixes Expense $, divided by Contribution Margin percentage
Verification:
Sales Required to achieve $20 in targeted profit:
($20 + $30) / 40% = $125
The example equation reads: $20 + $30, divided by 40 percent equals $125
CVP formulas to be remembered:
- Required sales based on units sold to yield a targeted operating income:
Required number of units sold For Targeted Profit =
[latex]\huge{\frac{(\text{Fixed Costs Dollar + Targeted Profit Dollar})}{\text{Contribution Margin Dollar Per Unit}}}[/latex]
The previous equation reads: Required number of units sold for targeted profit equals fixed costs dollar plus targeted profit dollar, divided by Contribution Margin dollar per unit.
- Required sales based on contribution margin percentage to yield a targeted operating income:
Required Dollar Sales For Targeted Profit =
[latex]\huge{\frac{(\text{Fixed Costs Dollar + Targeted Profit Dollar})}{\text{Contribution Margin Percentage}}}[/latex]
The previos equation reads: Required dollar sales for targeted profit equals fixed costs dollar plus targeted profit dollar, divided by Contribution Margin percentage.
Break-even Point
The break-even point is reached when total costs and total revenues are equal, generating no gain or loss (Operating Income of $0). Business operators use the calculation to determine how many product units they need to sell at a given price point to break even or to produce the first dollar of profit.
Break-even analysis is also used in cost/profit analyses to verify how much incremental sales (or revenue) is needed to justify new investments.
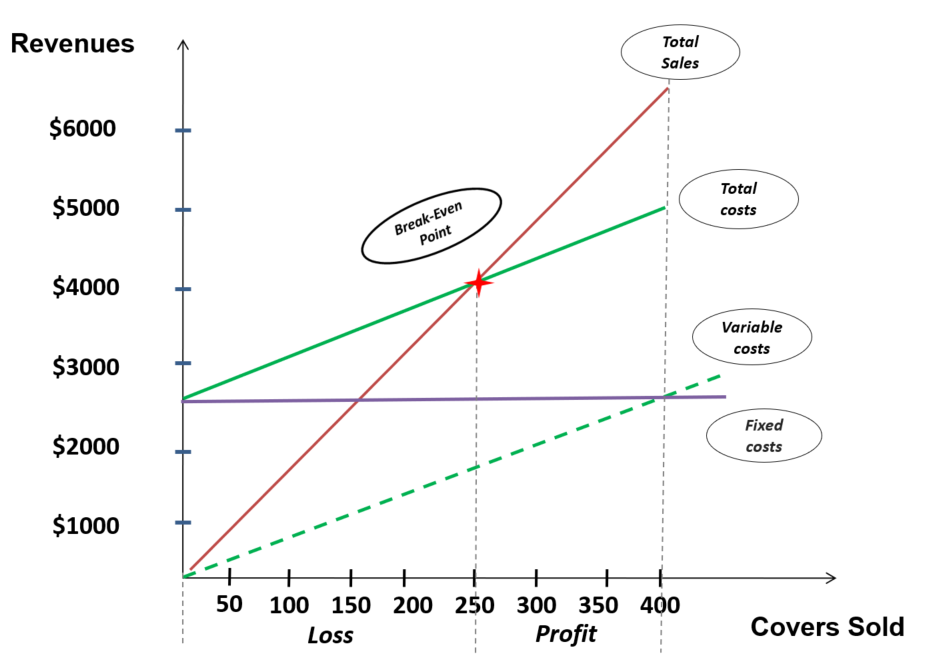
The following graph illustrates the break-even point based on the number of covers sold in a restaurant
Long description:
A line graph with covers sold on the x axis. the x axis starts at 0, and has incriment markers in intervals of 50, increasing to a maximum of 400. There is a label for loss indicated from the start of the x axis ( 0 ) to the fifth interval marker ( 250 ). There is a label for profit indicated on the x axis starting after the 250 marker. The Y axis is labeled for revenues, also starting at 0, incrementing by one thousand dollars every marker, to a maximum of six thousand dollars. There are four lines graphed. One of which is a line representing total sales, which increases at linear rate, starting point (0 , $0), and ending point (400, $6000). Another line represents the total costs, which also increases at a linear rate. Its starting point is (0 , $2500), and its ending point is (400, $5000). The total sales and total costs lines that are graphed, intersect at the point (250, $4000) which is labeled as the break even point. the intersection of these two lines emphasize (as the x axis profit label does, which was mentioned earlier in this description) that profit occurs after 250 covers are sold. A fixed cost line is represented in this graph as well.Starting point ( 0 , $2500), and ending point (400, $2500). Showing that fixed costs are static and not dependent on covers sold. The last line represents variable costs, starting point ( 0, $0) and ending point (400, $2500). Notice the ending point of the total costs line equals the fixed cost and variable cost totals.
End long description.
- The Sales line starts at the origin (0 revenue for 0 covers) and grows in direct proportion to the number of covers sold;
- Variable costs grow in direct proportion to Sales but at a slower rate. The line starts at the origin since no variable cost arises if no sale occurs;
- The Fixed Costs line remains flat (unchanged irrespective of the number of covers sold). The operation incurs Fixed Costs such as rent whether the operation operates (is open for business) or not;
- Total Cost grows at the same rate as Variable Costs. The Total Cost minimum is represented by the Fixed Costs line;
- The Break-Even point occurs where the Total Sales line crosses the Total Costs line. In this illustration, the operation starts being profitable when selling exceeds 250 covers.
Computing the Break-Even Point
Computing the break-even point is equivalent to finding the sales that yield a targeted profit of zero.
Example
The average check (selling price per cover) for the Roadside Exotic BBQ Restaurant is $16. The restaurant averages 85 covers sold a day or 2,250 covers per month. The restaurant currently loses money as indicated in the following statement:
Roadside Exotic BBQ Restaurant
Income Statement
| Statement Item | Dollar Amount | Percent of Income |
|---|---|---|
|
Sales (2,250 Covers x $16) |
$40,800 |
100% |
|
(Deduction) Variable Costs |
($29,376) |
(72%) |
|
(Total) Contribution Margin |
$11,424 |
28% |
|
(Deduction) Fixed Costs |
($13,464) |
(30%) |
|
(Total) Operating Income |
($2,040) |
(5%) |
Table 15.4 Income Statement for an Exotic Barbecue Restaurant.
The owner wants to know the sales volume required in terms of both dollars ($) and the number of covers for the restaurant to break even considering its current expense structure.
- Required number of covers sold
Required number of covers sold = [latex]\huge{\frac{(\text{Fixed Costs Dollar + Targeted Profit Dollar})}{\text{Contribution Margin Dollar Per Unit}}}[/latex]
The equation just shown is meant to be read as: fixed costs dollar plus targeted profit dollar, divided by contribution margin dollar per unit
In this case,
- Targeted Profit = zero (definition of Break-even)
- Contribution Margin per unit: $16 X 28% (CM%) = $4.48
[latex]\huge{\frac{\text{Fixed Cost Dollar}}{\text{Contribution Margin Dollar /unit}} = \frac{\$ 13,464}{\$ 4.48}}[/latex] = 3,005.36 (3,006) covers or
100.18 (101) covers per day.
Verification
Roadside Exotic BBQ Restaurant
Income StatementTable 15.5 Income Statement of an Exotic Barbecue Restaurant Statement Item Dollar Ammount Percent of Income Sales (3,005.36 Covers x$16)
$48,086
100%
(Deduction) Variable Costs
($34,622)
(72%)
(Total) Contribution Margin
$13,464
28%
(Deduction) Fixed Costs
($13,464)
(28%)
(Total) Operating Income
($0)
(0%)
Table 15.5 Income Statement of an Exotic Barbecue Restaurant
- Required Sales
Sales $ = Targeted Profit $ + Fixed Expense $
Contribution Margin %Since targeted profit is zero, the formula for the Break-Even Sales is:
Fixed Expense $ = $13,464 = $48,086
Contribution Margin % 28%Break-Even formulas to be remembered:
- Break-Even number of Units sold
Break-Even number of units sold =
(Fixed Costs Dollar / Contribution Margin Dollar per unit)
- Break-Even Sales
Break-Even Sales $ =
(Fixed Costs Dollar / Contribution Margin Percentage)
Summary
The break-even point calculation allows food service operators to calculate the number of covers (or units sold) or total sales needed to cover all costs of the operation given the level of business generated. Once the break-even point is met, additional revenue (or sales) starts to generate a profit, which is typically at least one purpose of running a business. Cost volume profit analysis allows the food service operator to calculate similar figures but with a targeted profit in mind. This CVP analysis is an essential tool in guiding managerial, financial and investment decisions for current operations or future business ideas or plans.
Review Questions
Short Answer
- How would conducting a cost volume profit analysis help a food service operator make decisions about future business ideas?
- What sort of assumptions need to be made about a food service operation in order to complete a cost volume profit analysis
- How might calculating a break-even point be useful to a food service manager?
