
3.7 Alcohol
Alcohol Facts and Statistics
Alcohol Use in the United States:
- Prevalence of Drinking: According to the 2015 National Survey on Drug Use and Health (NSDUH), 86.4 percent of people ages 18 or older reported that they drank alcohol at some point in their lifetime; 70.1 percent reported that they drank in the past year; 56.0 percent reported that they drank in the past month.1
- Prevalence of Binge Drinking and Heavy Alcohol Use: In 2015, 26.9 percent of people ages 18 or older reported that they engaged in binge drinking in the past month; 7.0 percent reported that they engaged in heavy alcohol use in the past month.2 (See “Definitions” box for definitions of binge drinking and heavy alcohol use.)
Alcohol Use Disorder (AUD) in the United States:
- Adults (ages 18+): According to the 2015 NSDUH, 15.1 million adults ages 18 and older3 (6.2 percent of this age group4) had AUD. This includes 9.8 million men3 (8.4 percent of men in this age group4) and 5.3 million women3 (4.2 percent of women in this age group4).
- About 6.7 percent of adults who had AUD in the past year received treatment. This includes 7.4 percent of males and 5.4 percent of females with AUD in this age group.5
- Youth (ages 12–17): According to the 2015 NSDUH, an estimated 623,000 adolescents ages 12–176 (2.5 percent of this age group7) had AUD. This number includes 298,000 males6 (2.3 percent of males in this age group7) and 325,000 females6 (2.7 percent of females in this age group7).
- About 5.2 percent of youth who had AUD in the past year received treatment. This includes 5.1 percent of males and 5.3 percent of females with AUD in this age group.5
Alcohol-Related Deaths:
- An estimated 88,0008 people (approximately 62,000 men and 26,000 women8) die from alcohol-related causes annually, making alcohol the third leading preventable cause of death in the United States. The first is tobacco, and the second is poor diet and physical inactivity.9
- In 2014, alcohol-impaired driving fatalities accounted for 9,967 deaths (31 percent of overall driving fatalities).10
Economic Burden:
- In 2010, alcohol misuse cost the United States $249.0 billion.11
- Three-quarters of the total cost of alcohol misuse are related to binge drinking.11
Global Burden:
- In 2012, 3.3 million deaths, or 5.9 percent of all global deaths (7.6 percent for men and 4.1 percent for women), were attributable to alcohol consumption.12
- In 2014, the World Health Organization reported that alcohol contributed to more than 200 diseases and injury-related health conditions, most notably DSM–IV alcohol dependence (see sidebar), liver cirrhosis, cancers, and injuries.13 In 2012, 5.1 percent of the burden of disease and injury worldwide (139 million disability-adjusted life-years) was attributable to alcohol consumption.12
- Globally, alcohol misuse was the fifth leading risk factor for premature death and disability in 2010. Among people between the ages of 15 and 49, it is the first.14 In the age group 20–39 years, approximately 25 percent of the total deaths are alcohol-attributable.15
Family Consequences:
- More than 10 percent of U.S. children live with a parent with alcohol problems, according to a 2012 study.16
Underage Drinking:
- Prevalence of Underage Alcohol Use:
- Prevalence of Drinking: According to the 2015 NSDUH, 33.1 percent of 15-year-olds report that they have had at least 1 drink in their lives.17 About 7.7 million people ages 12–2018 (20.3 percent of this age group19) reported drinking alcohol in the past month (19.8 percent of males and 20.8 percent of females19).
- Prevalence of Binge Drinking: According to the 2015 NSDUH, approximately 5.1 million people18(about 13.4 percent19) ages 12–20 (13.4 percent of males and 13.3 percent of females19) reported binge drinking in the past month.
- Prevalence of Heavy Alcohol Use: According to the 2015 NSDUH, approximately 1.3 million people18(about 3.3 percent19) ages 12–20 (3.6 percent of males and 3.0 percent of females19) reported heavy alcohol use in the past month.
- Consequences of Underage Alcohol Use:
- Research indicates that alcohol use during the teenage years could interfere with normal adolescent brain development and increase the risk of developing AUD. In addition, underage drinking contributes to a range of acute consequences, including injuries, sexual assaults, and even deaths—including those from car crashes.20
Alcohol and College Students:
- Prevalence of Alcohol Use:
- Prevalence of Drinking: According to the 2015 NSDUH, 58.0 percent of full-time college students ages 18–22 drank alcohol in the past month compared with 48.2 percent of other persons of the same age.21
- Prevalence of Binge Drinking: According to the 2015 NSDUH, 37.9 percent of college students ages 18–22 reported binge drinking in the past month compared with 32.6 percent of other persons of the same age.21
- Prevalence of Heavy Alcohol Use: According to the 2015 NSDUH, 12.5 percent of college students ages 18–22 reported heavy alcohol use in the past month compared with 8.5 percent of other persons of the same age.21
- Consequences—Researchers estimate that each year:
- 1,825 college students between the ages of 18 and 24 die from alcohol-related unintentional injuries, including motor-vehicle crashes.22
- 696,000 students between the ages of 18 and 24 are assaulted by another student who has been drinking.23
- 97,000 students between the ages of 18 and 24 report experiencing alcohol-related sexual assault or date rape.23
- Roughly 20 percent of college students meet the criteria for AUD.24
- About 1 in 4 college students report academic consequences from drinking, including missing class, falling behind in class, doing poorly on exams or papers, and receiving lower grades overall.25
Alcohol and Pregnancy:
- The prevalence of Fetal Alcohol Syndrome (FAS) in the United States was estimated by the Institute of Medicine in 1996 to be between 0.5 and 3.0 cases per 1,000.26
- More recent reports from specific U.S. sites report the prevalence of FAS to be 2 to 7 cases per 1,000, and the prevalence of Fetal Alcohol Spectrum Disorders (FASD) to be as high as 20 to 50 cases per 1,000.27,28
Alcohol and the Human Body:
- In 2015, of the 78,529 liver disease deaths among individuals ages 12 and older, 47.0 percent involved alcohol. Among males, 49,695 liver disease deaths occurred and 49.5 percent involved alcohol. Among females, 28,834 liver disease deaths occurred and 43.5 percent involved alcohol.29
- Among all cirrhosis deaths in 2013, 47.9 percent were alcohol-related. The proportion of alcohol-related cirrhosis was highest (76.5 percent) among deaths of persons ages 25–34, followed by deaths of persons ages 35–44, at 70.0 percent.30
- In 2009, alcohol-related liver disease was the primary cause of almost 1 in 3 liver transplants in the United States.31
- Drinking alcohol increases the risk of cancers of the mouth, esophagus, pharynx, larynx, liver, and breast.32
Definitions
Alcohol Use Disorder (AUD): AUD is a chronic relapsing brain disease characterized by an impaired ability to stop or control alcohol use despite adverse social, occupational, or health consequences. AUD can range from mild to severe, and recovery is possible regardless of severity. The fourth edition of the Diagnostic and Statistical Manual (DSM-IV), published by the American Psychiatric Association, described two distinct disorders—alcohol abuse and alcohol dependence—with specific criteria for each. The fifth edition, DSM-5, integrates the two DSM-IV disorders, alcohol abuse, and alcohol dependence, into a single disorder called alcohol use disorder, or AUD, with mild, moderate, and severe subclassifications.
Binge Drinking:
- NIAAA defines binge drinking as a pattern of drinking that brings blood alcohol concentration (BAC) levels to 0.08 g/dL. This typically occurs after 4 drinks for women and 5 drinks for men—in about 2 hours.33
- The Substance Abuse and Mental Health Services Administration (SAMHSA), which conducts the annual National Survey on Drug Use and Health (NSDUH), defines binge drinking as 5 or more alcoholic drinks for males or 4 or more alcoholic drinks for females on the same occasion (i.e., at the same time or within a couple of hours of each other) on at least 1 day in the past month.34
Heavy Alcohol Use: SAMHSA defines heavy alcohol use as binge drinking on 5 or more days in the past month.
Moderate alcohol consumption: According to the “Dietary Guidelines for Americans 2015-2020,” U.S. Department of Health and Human Services and U.S. Department of Agriculture, moderate drinking is up to 1 drink per day for women and up to 2 drinks per day for men.
NIAAA’s Definition of Drinking at Low Risk for Developing AUD: For women, low-risk drinking is defined as no more than 3 drinks on any single day and no more than 7 drinks per week. For men, it is defined as no more than 4 drinks on any single day and no more than 14 drinks per week. NIAAA research shows that only about 2 in 100 people who drink within these limits have AUD.
Alcohol-Impaired-Driving Fatality: A fatality in a crash involving a driver or motorcycle rider (operator) with a BAC of 0.08 g/dL or greater.
Disability-Adjusted Life-Years (DALYs): A measure of years of life lost or lived in less than full health.
Underage Drinking: Alcohol use by anyone under the age of 21. In the United States, the legal drinking age is 21.
What Is A Standard Drink?
- Regular beer: 5% alcohol content
- Some light beers: 4.2% alcohol content
That’s why it’s important to know how much alcohol your drink contains. In the United States, one “standard” drink contains roughly 14 grams of pure alcohol, which is found in:
- 12 ounces of regular beer, which is usually about 5% alcohol
- 5 ounces of wine, which is typically about 12% alcohol
- 1.5 ounces of distilled spirits, which is about 40% alcohol
How do you know how much alcohol is in your drink?
Even though they come in different sizes, the drinks below are examples of one standard drink:
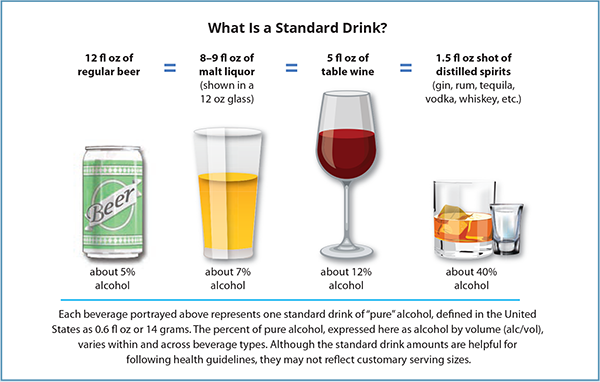
Each beverage portrayed above represents one standard drink of “pure” alcohol, defined in the United States as 0.6 fl oz or 14 grams. The percent of pure alcohol, expressed here as alcohol by volume (alc/vol), varies within and across beverage types. Although the standard drink amounts are helpful for following health guidelines, they may not reflect customary serving sizes.
