
Chapter 7 : Introduction
INTRODUCTION TO PRODUCTION, COSTS AND INDUSTRY STRUCTURE
In this chapter, you will learn about:
- explain why economic costs include
- explicit (revealed and expressed) costs and
- implicit (present but not obvious) costs
- relate the law of diminishing returns to a firm’s short-run production costs
- describe the distinctions between fixed and variable costs
- describe the distinctions between two measurements of “per-unit” costs: average total cost and marginal cost
- calculate average total cost and marginal cost
- use economies of scale to connect a firm’s size and its average costs in the long run
This chapter is the first of four chapters that explores the theory of the firm. This theory explains how firms behave. What does that mean? Let’s define what we mean by the firm. A firm (or producer or business) combines inputs of labor, capital, land, and raw or finished component materials to produce outputs. If the firm is successful, the outputs are more valuable than the inputs. This activity of production goes beyond manufacturing (i.e., making things). It includes any process or service that creates value, including transportation, distribution, wholesale and retail sales.
Production involves a number of important decisions that define a firm’s behavior. These decisions include, but are not limited to:
- What product or products should the firm produce?
- How should the firm produce the products (i.e., what production process should the firm use)?
- How much output should the firm produce?
- What price should the firm charge for its products?
- How much labor should the firm employ?
The answers to these questions depend on the production and cost conditions facing each firm. That is the subject of this chapter. The answers also depend on the market structure for the product(s) in question. Market structure is a multidimensional concept that involves how competitive the industry is. We define it by questions such as these:
- How much market power does each firm in the industry possess?
- How similar is each firm’s product to the products of other firms in the industry?
- How difficult is it for new firms to enter the industry?
- Do firms compete on the basis of price, advertising, or other product differences?
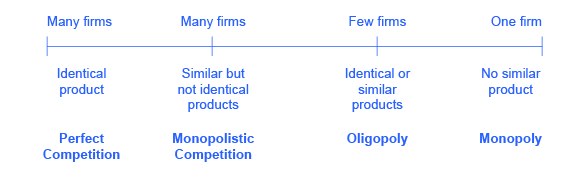
Figure 7.1 illustrates the range of different market structures, which we will explore in Perfect Competition, Monopoly, and Monopolistic Competition and Oligopoly.
Let’s examine how firms determine their costs and desired profit levels. Then we will discuss the origins of cost, both in the short and long run. Private enterprise, which can be a private individual or group business ownership, characterizes the U.S. economy. In the U.S. system, we have the option to organize private businesses as sole proprietorships (one owner), partners (more than one owner), and corporations (legal entities separate from the owners. When people think of businesses, often corporate giants like Wal-Mart, Microsoft, or General Motors come to mind. However, firms come in all sizes, as Table 7.1 shows. The vast majority of American firms have fewer than 20 employees. As of 2010, the U.S. Census Bureau counted 5.7 million firms with employees in the U.S. economy. Slightly less than half of all the workers in private firms are at the 17,000 large firms, meaning they employ more than 500 workers. Another 35% of workers in the U.S. economy are at firms with fewer than 100 workers. These small-scale businesses include everything from dentists and lawyers to businesses that mow lawns or clean houses. Table 7.1 does not include a separate category for the millions of small “non-employer” businesses where a single owner or a few partners are not officially paid wages or a salary, but simply receive whatever they can earn.
| Number of Employees | Firms (% of total firms) | Number of Paid Employees (% of total employment) |
|---|---|---|
| Total | 5,734,538 | 112.0 million |
| 0–9 | 4,543,315 (79.2%) | 12.3 million (11.0%) |
| 10–19 | 617,089 (10.8%) | 8.3 million (7.4%) |
| 20–99 | 475,125 (8.3%) | 18.6 million (16.6%) |
| 100–499 | 81,773 (1.4%) | 15.9 million (14.2%) |
| 500 or more | 17,236 (0.30%) | 50.9 million (49.8%) |
Table 7.1 Range in Size of U.S. Firms (Source: U.S. Census, 2010 www.census.gov)
