
14.6 – Testing the Effectiveness of Antimicrobials
Learning Objectives
- Describe how the Kirby-Bauer disk diffusion test determines the susceptibility of a microbe to an antibacterial drug.
- Explain the significance of the minimal inhibitory concentration and the minimal bactericidal concentration relative to the effectiveness of an antimicrobial drug.
Testing the effectiveness of antimicrobial drugs against specific organisms is important in identifying their spectrum of activity and the therapeutic dosage. This type of test, generally described as antimicrobial susceptibility testing (AST), is commonly performed in a clinical laboratory. In this section, we will discuss common methods of testing the effectiveness of antimicrobials.
The Kirby-Bauer Disk Diffusion Test
The Kirby-Bauer disk diffusion test has long been used as a starting point for determining the susceptibility of specific microbes to various antimicrobial drugs. The Kirby-Bauer assay starts with a Mueller-Hinton agar plate on which a confluent lawn is inoculated with a patient’s isolated bacterial pathogen. Filter paper disks impregnated with known amounts of antibacterial drugs to be tested are then placed on the agar plate. As the bacterial inoculum grows, antibiotic diffuses from the circular disk into the agar and interacts with the growing bacteria. Antibacterial activity is observed as a clear circular zone of inhibition around the drug-impregnated disk, similar to the disk-diffusion assay depicted in Figure 13.31. The diameter of the zone of inhibition, measured in millimeters and compared to a standardized chart, determines the susceptibility or resistance of the bacterial pathogen to the drug.
There are multiple factors that determine the size of a zone of inhibition in this assay, including drug solubility, rate of drug diffusion through agar, the thickness of the agar medium, and the drug concentration impregnated into the disk. Due to a lack of standardization of these factors, interpretation of the Kirby-Bauer disk diffusion assay provides only limited information on susceptibility and resistance to the drugs tested. The assay cannot distinguish between bacteriostatic and bactericidal activities, and differences in zone sizes cannot be used to compare drug potencies or efficacies. Comparison of zone sizes to a standardized chart will only provide information on the antibacterials to which a bacterial pathogen is susceptible or resistant.
Check Your Understanding
- How does one use the information from a Kirby-Bauer assay to predict the therapeutic effectiveness of an antimicrobial drug in a patient?
Micro Connections
Antibiograms: Taking Some of the Guesswork Out of Prescriptions
Unfortunately, infectious diseases don’t take a time-out for lab work. As a result, physicians rarely have the luxury of conducting susceptibility testing before they write a prescription. Instead, they rely primarily on the empirical evidence (i.e., the signs and symptoms of disease) and their professional experience to make an educated guess as to the diagnosis, causative agent(s), and drug most likely to be effective. This approach allows treatment to begin sooner so the patient does not have to wait for lab test results. In many cases, the prescription is effective; however, in an age of increased antimicrobial resistance, it is becoming increasingly more difficult to select the most appropriate empiric therapy. Selecting an inappropriate empiric therapy not only puts the patient at risk but may promote greater resistance to the drug prescribed.
Recently, studies have shown that antibiograms are useful tools in the decision-making process of selecting appropriate empiric therapy. An antibiogram is a compilation of local antibiotic susceptibility data broken down by bacterial pathogen. In a November 2014 study published in the journal Infection Control and Hospital Epidemiology, researchers determined that 85% of the prescriptions ordered in skilled nursing facilities were decided upon empirically, but only 35% of those prescriptions were deemed appropriate when compared with the eventual pathogen identification and susceptibility profile obtained from the clinical laboratory. However, in one nursing facility where use of antibiograms was implemented to direct selection of empiric therapy, appropriateness of empiric therapy increased from 32% before antibiogram implementation to 45% after implementation of antibiograms.[1] Although these data are preliminary, they do suggest that health-care facilities can reduce the number of inappropriate prescriptions by using antibiograms to select empiric therapy, thus benefiting patients and minimizing opportunities for antimicrobial resistance to develop.
Link to Learning
Visit this website to view an interactive antibiogram provided by Stanford University.
Dilution Tests
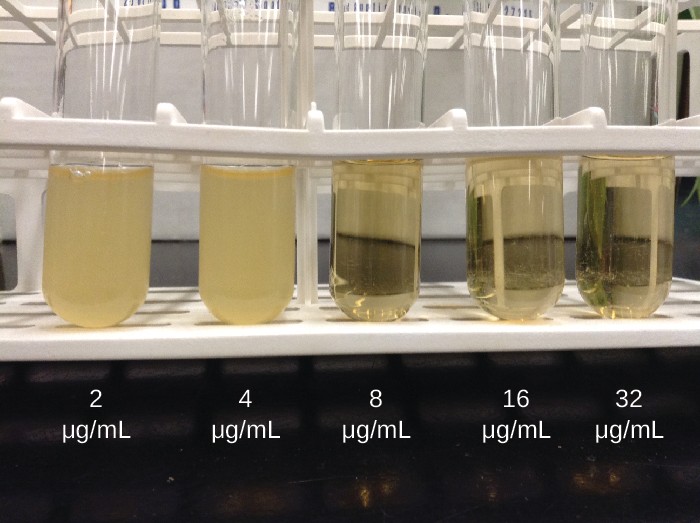
As discussed, the limitations of the Kirby-Bauer disk diffusion test do not allow for a direct comparison of antibacterial potencies to guide selection of the best therapeutic choice. However, antibacterial dilution tests can be used to determine a particular drug’s minimal inhibitory concentration (MIC), the lowest concentration of drug that inhibits visible bacterial growth, and minimal bactericidal concentration (MBC), the lowest drug concentration that kills ≥99.9% of the starting inoculum. Determining these concentrations helps identify the correct drug for a particular pathogen. For the macrobroth dilution assay, a dilution series of the drug in broth is made in test tubes and the same number of cells of a test bacterial strain is added to each tube (Figure 14.19). The MIC is determined by examining the tubes to find the lowest drug concentration that inhibits visible growth; this is observed as turbidity (cloudiness) in the broth. Tubes with no visible growth are then inoculated onto agar media without antibiotic to determine the MBC. Generally, serum levels of an antibacterial should be at least three to five times above the MIC for treatment of an infection.
The MIC assay can also be performed using 96-well microdilution trays, which allow for the use of small volumes and automated dispensing devices, as well as the testing of multiple antimicrobials and/or microorganisms in one tray (Figure 14.20). MICs are interpreted as the lowest concentration that inhibits visible growth, the same as for the macrobroth dilution in test tubes. Growth may also be interpreted visually or by using a spectrophotometer or similar device to detect turbidity or a color change if an appropriate biochemical substrate that changes color in the presence of bacterial growth is also included in each well.
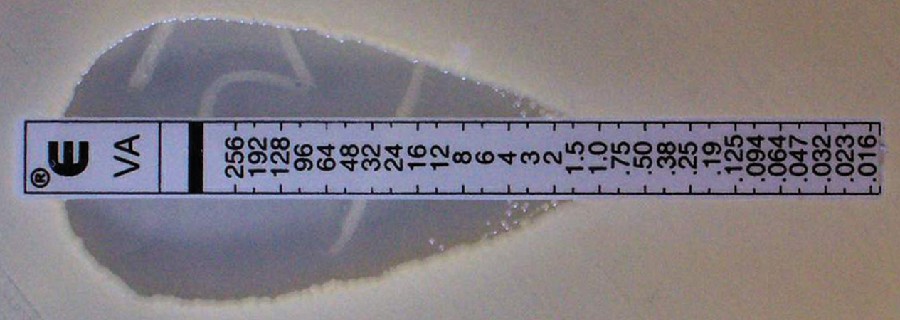
The Etest is an alternative method used to determine MIC, and is a combination of the Kirby-Bauer disk diffusion test and dilution methods. Similar to the Kirby-Bauer assay, a confluent lawn of a bacterial isolate is inoculated onto the surface of an agar plate. Rather than using circular disks impregnated with one concentration of drug, however, commercially available plastic strips that contain a gradient of an antibacterial are placed on the surface of the inoculated agar plate (Figure 14.21). As the bacterial inoculum grows, antibiotic diffuses from the plastic strips into the agar and interacts with the bacterial cells. Because the rate of drug diffusion is directly related to concentration, an elliptical zone of inhibition is observed with the Etest drug gradient, rather than a circular zone of inhibition observed with the Kirby-Bauer assay. To interpret the results, the intersection of the elliptical zone with the gradient on the drug-containing strip indicates the MIC. Because multiple strips containing different antimicrobials can be placed on the same plate, the MIC of multiple antimicrobials can be determined concurrently and directly compared. However, unlike the macrobroth and microbroth dilution methods, the MBC cannot be determined with the Etest.
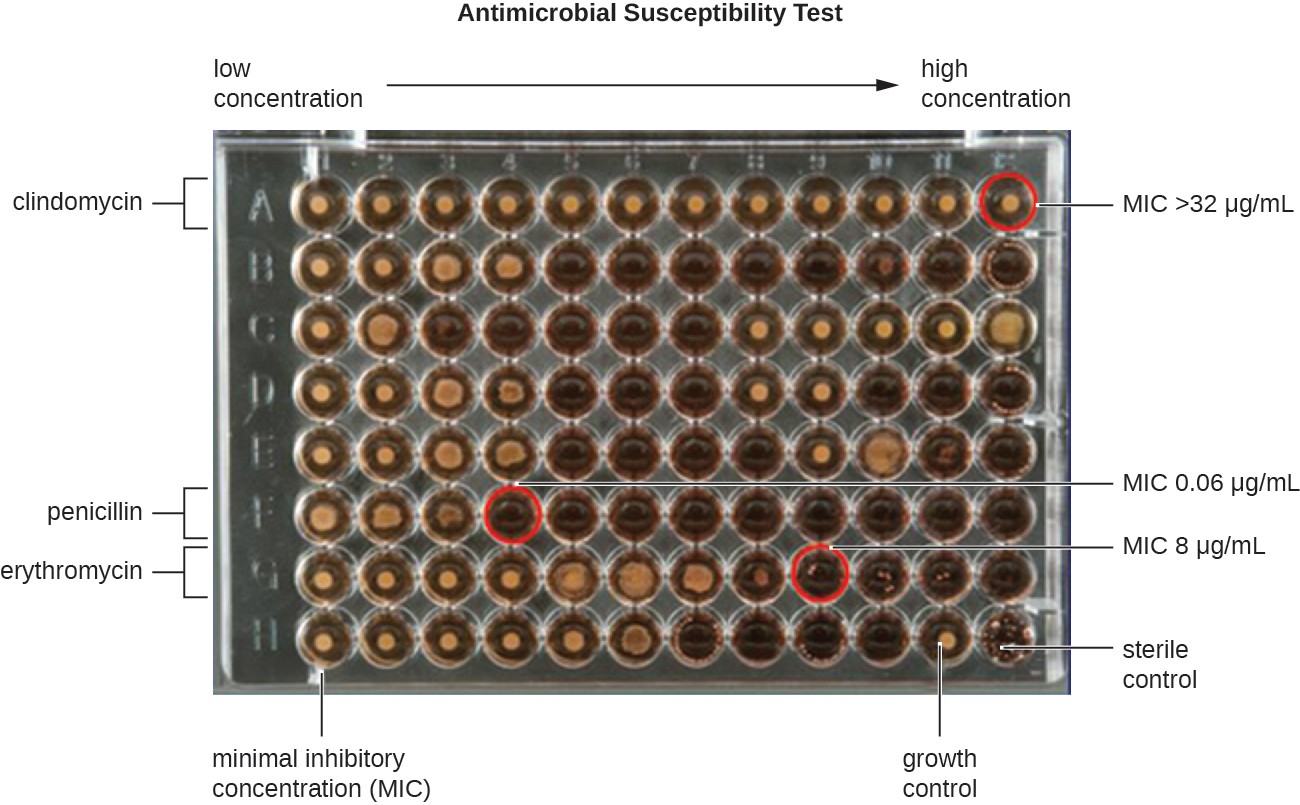
A 64 well plate; 8 rows and 12 columns. The concentration increases from left to fight. Each row has a different antibiotic. The MIC is determined by the lowest concentration with no growth as seen by a clear rather than dark look to the well. For clindamycin the MIC is above the highest concentration of 32 micrograms per mL. For Peniciliin the MIC is 0.06 and for Erythromycin it’s 8 micrograms per mL. The bottom row shows positive and negative controls.

Check Your Understanding
- Compare and contrast MIC and MBC.
Footnotes
J.P. Furuno et al. “Using Antibiograms to Improve Antibiotic Prescribing in Skilled Nursing Facilities.” Infection Control and Hospital Epidemiology 35 no. Suppl S3 (2014):S56–61.
