
2 Trade
2.1 The Circular-Flow Model
The Factors of Production
From: https://openstax.org/details/books/principles-microeconomics-2e (Chapter 7.2)
Production is the process (or processes) a firm uses to transform inputs (e.g. labor, capital, raw materials) into outputs, i.e. the goods or services the firm wishes to sell. Consider pizza making. The pizzaiolo (pizza maker) takes flour, water, and yeast to make the dough. Similarly, the pizzaiolo may take tomatoes, spices, and water to make pizza sauce. The cook rolls out the dough, brushes on the pizza sauce, and adds cheese and other toppings. The pizzaiolo uses a peel—the shovel-like wooden tool– to put the pizza into the oven to cook. Once baked, the pizza goes into a box (if it’s for takeout) and the customer pays for the good. What are the inputs (or factors of production) in the production process for this pizza?
Economists divide factors of production into several categories:
- Natural Resources (Land and Raw Materials) – The ingredients for the pizza are raw materials. These include the flour, yeast, and water for the dough, the tomatoes, herbs, and water for the sauce, the cheese, and the toppings. If the pizza place uses a wood-burning oven, we would include the wood as a raw material. If the establishment heats the oven with natural gas, we would count this as a raw material. Don’t forget electricity for lights. If, instead of pizza, we were looking at an agricultural product, like wheat, we would include the land the farmer used for crops here.
- Labor – When we talk about production, labor means human effort, both physical and mental. The pizzaiolo was the primary example of labor here. He or she needs to be strong enough to roll out the dough and to insert and retrieve the pizza from the oven, but he or she also needs to know how to make the pizza, how long it cooks in the oven and a myriad of other aspects of pizza-making. The business may also have one or more people to work the counter, take orders, and receive payment.
- Physical Capital – When economists uses the term capital, they do not mean financial capital (money); rather, they mean physical capital, the machines, equipment, and buildings that one uses to produce the product. In the case of pizza, the capital includes the peel, the oven, the building, and any other necessary equipment (for example, tables and chairs).
- Human Capital – Unlike physical capital which refers to tangible assets, human capital refers to intangible ideas such as education and experience. Ultimately, human capital measures how productive individuals are. For instance, there could be two people working at a factory, performing the same work, for the same amount of time, yet the two people produce a different quantity. What explains the difference? It could be additional education or additional experience.
- Technology – Technology refers to the process or processes for producing the product. How does the pizzaiolo combine ingredients to make pizza? How hot should the oven be? How long should the pizza cook? What is the best oven to use? Gas or wood burning? Should the restaurant make its own dough, sauce, cheese, toppings, or should it buy them?
- Entrepreneurship – Production involves many decisions and much knowledge, even for something as simple as pizza. Who makes those decisions? Ultimately, it is the entrepreneur, the person who creates the business, whose idea it is to combine the inputs to produce the outputs.
The Circular Flow Model
From: https://en.wikipedia.org/wiki/Circular_flow_of_income
The circular flow of income or circular flow is a model of the economy in which the major exchanges are represented as flows of money, goods, and services, etc. between economic agents. The flows of money and goods exchanged in a closed circuit correspond in value, but run in the opposite direction. The circular flow analysis is the basis of national accounts and hence of macroeconomics.
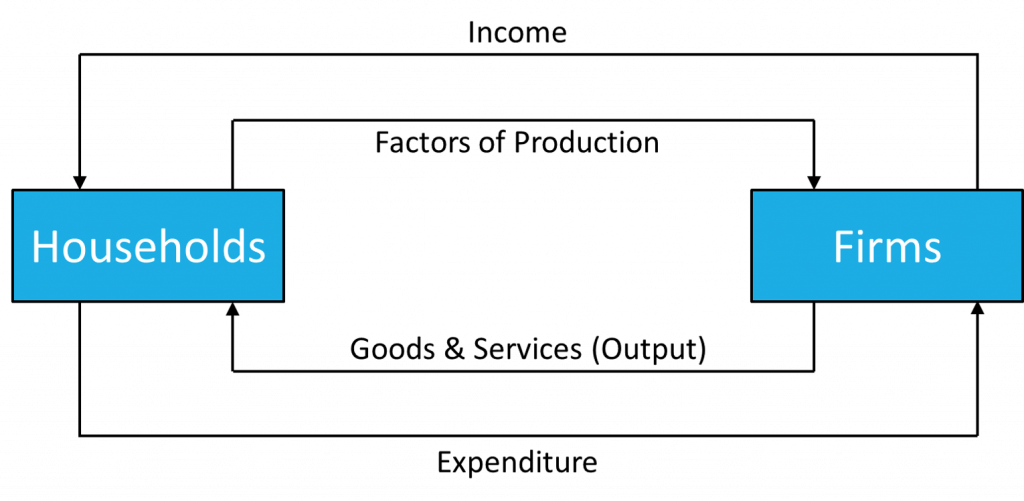
The circular flow of income is a concept for better understanding of the economy as a whole and for example the National Income and Product Accounts (NIPAs). In its most basic form, it considers a simple economy consisting solely of businesses and individuals, and can be represented in a so-called “circular flow diagram.” In this simple economy, individuals provide the labor that enables businesses to produce goods and services. These activities are represented by the outer loop in the diagram above.[4]
Alternatively, one can think of these transactions in terms of the monetary flows that occur. Businesses provide individuals with income (in the form of compensation) in exchange for their labor. That income is spent on the goods and services businesses produce. These activities are represented by the inner loop in the diagram above.[4
The circular flow diagram illustrates the interdependence of the “flows,” or activities, that occur in the economy, such as the production of goods and services (or the “output” of the economy) and the income generated from that production. The circular flow also illustrates the equality between the income earned from production and the value of goods and services produced.[4]
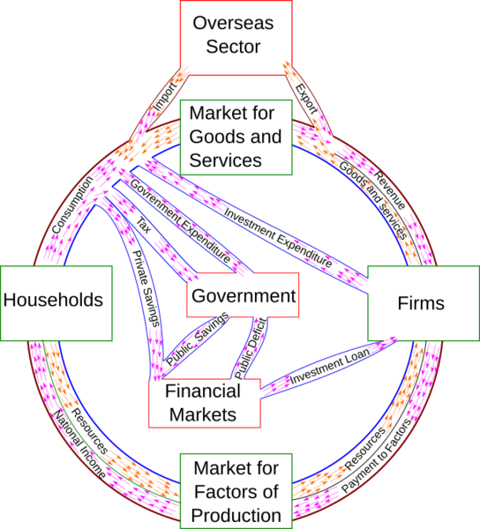
Of course, the total economy is much more complicated than the illustration above. An economy involves interactions between not only individuals and businesses, but also Federal, state, and local governments and residents of the rest of the world. Also not shown in this simple illustration of the economy are other aspects of economic activity such as investment in capital (produced—or fixed—assets such as structures, equipment, research and development, and software), flows of financial capital (such as stocks, bonds, and bank deposits), and the contributions of these flows to the accumulation of fixed assets.[4]
A more complicated (and more realistic) circular-flow model is presented below.
2.2 The Production Possibilities Frontier
The Production Possibilities Frontier (PPF)
From: https://openstax.org/details/books/principles-microeconomics-2e (Chapter 2.2)
Introduction
Just as individuals cannot have everything they want and must instead make choices, society as a whole cannot have everything it might want, either. This section of the chapter will explain the constraints society faces, using a model called the production possibilities frontier (PPF). There are more similarities than differences between individual choice and social choice. As you read this section, focus on the similarities.
Because society has limited resources (e.g., labor, land, capital, raw materials) at any point in time, there is a limit to the quantities of goods and services it can produce. Suppose a society desires two products, healthcare, and education. The production possibilities frontier in Figure 2.3 illustrates this situation.
The figure below shows healthcare on the vertical axis and education on the horizontal axis. If the society were to allocate all of its resources to healthcare, it could produce at point A. However, it would not have any resources to produce education. If it were to allocate all of its resources to education, it could produce at point F. Alternatively, the society could choose to produce any combination of healthcare and education on the production possibilities frontier. In effect, the production possibilities frontier plays the same role for society as the budget constraint plays for Alphonso. Society can choose any combination of the two goods on or inside the PPF. However, it does not have enough resources to produce outside the PPF.
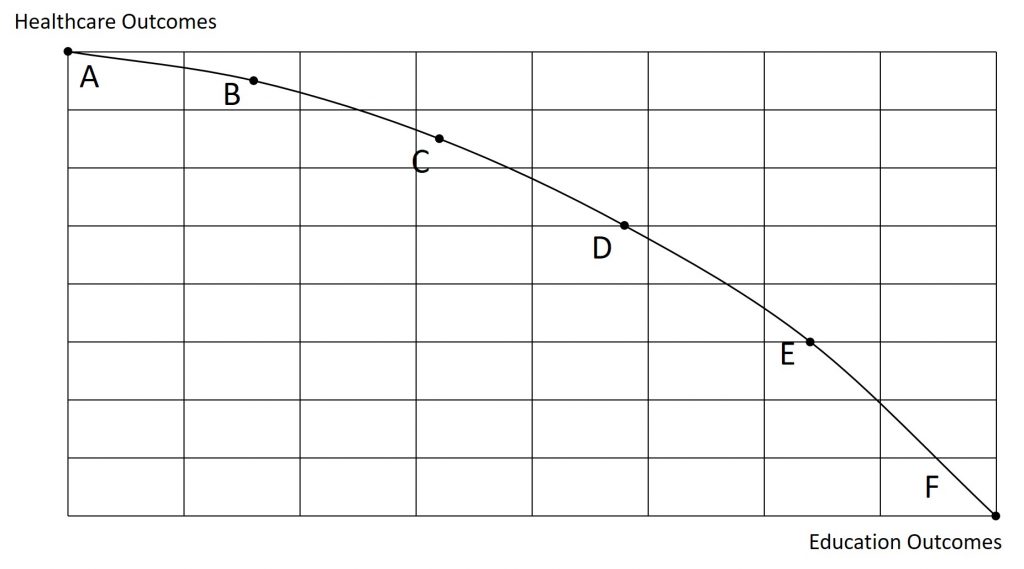
Most importantly, the production possibilities frontier clearly shows the tradeoff between healthcare and education. Suppose society has chosen to operate at point B, and it is considering producing more education. Because the PPF is downward sloping from left to right, the only way society can obtain more education is by giving up some healthcare. That is the tradeoff society faces. Suppose it considers moving from point B to point C. What would the opportunity cost be for the additional education? The opportunity cost would be the healthcare society has to forgo. Just as with Alphonso’s budget constraint, the slope of the production possibilities frontier shows the opportunity cost.
The Shape of the PPF and Law of Diminishing Returns
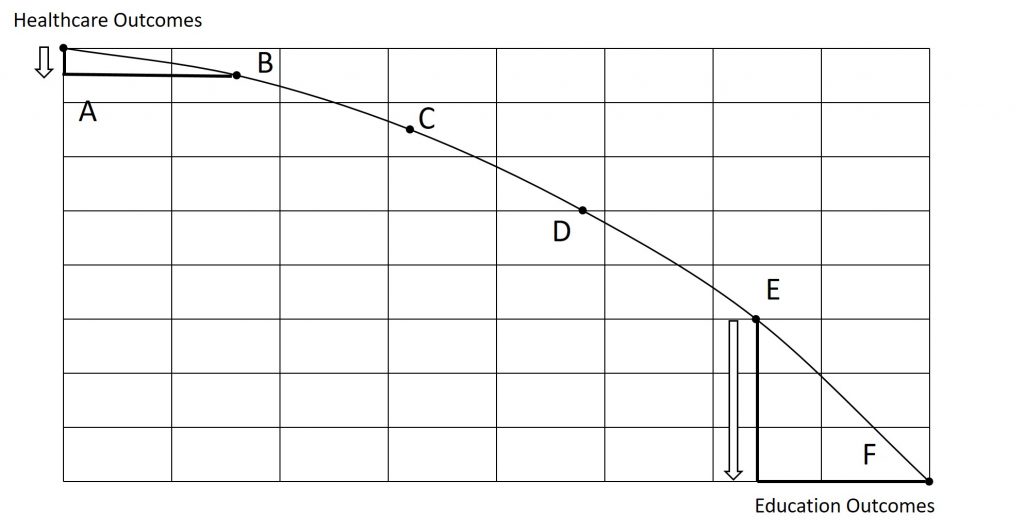
To understand why the PPF is curved, start by considering point A at the top left-hand side of the PPF. At point A, all available resources are devoted to healthcare and none are left for education. This situation would be extreme and even ridiculous. For example, children are seeing a doctor every day, whether they are sick or not, but not attending school. People are having cosmetic surgery on every part of their bodies, but no high school or college education exists. Now imagine that some of these resources are diverted from healthcare to education, so that the economy is at point B instead of point A. Diverting some resources away from A to B causes relatively little reduction in health because the last few marginal dollars going into healthcare services are not producing much additional gain in health. However, putting those marginal dollars into education, which is completely without resources at point A, can produce relatively large gains. For this reason, the shape of the PPF from A to B is relatively flat, representing a relatively small drop-off in health and a relatively large gain in education.
Now consider the other end, at the lower right, of the production possibilities frontier. Imagine that society starts at choice D, which is devoting nearly all resources to education and very few to healthcare, and moves to point F, which is devoting all spending to education and none to healthcare. For the sake of concreteness, you can imagine that in the movement from D to F, the last few doctors must become high school science teachers, the last few nurses must become school librarians rather than dispensers of vaccinations, and the last few emergency rooms are turned into kindergartens. The gains to education from adding these last few resources to education are very small. However, the opportunity cost lost to health will be fairly large, and thus the slope of the PPF between D and F is steep, showing a large drop in health for only a small gain in education.
The lesson is not that society is likely to make an extreme choice like devoting no resources to education at point A or no resources to health at point F. Instead, the lesson is that the gains from committing additional marginal resources to education depend on how much is already being spent. If on the one hand, very few resources are currently committed to education, then an increase in resources used can bring relatively large gains. On the other hand, if a large number of resources are already committed to education, then committing additional resources will bring relatively smaller gains.
This pattern is common enough that economists have given it a name: the law of diminishing returns, which holds that as additional increments of resources are added to a certain purpose, the marginal benefit from those additional increments will decline. (The law of diminishing marginal utility that we introduced in the last section is a more specific case of the law of diminishing returns.) When the government spends a certain amount more on reducing crime, for example, the original gains in reducing crime could be relatively large. However, additional increases typically cause relatively smaller reductions in crime, and paying for enough police and security to reduce crime to nothing at all would be tremendously expensive. This is shown in figure 2.4.
The PPF and Opportunity Cost
The curvature of the production possibilities frontier shows that as we add more resources to education, moving from left to right along the horizontal axis, the original gains are fairly large, but gradually diminish. This is shown in the figure above. Thus, the slope of the PPF is relatively flat. By contrast, as we add more resources to healthcare, moving from bottom to top on the vertical axis, the original gains are fairly large, but again gradually diminish. Thus, the slope of the PPF is relatively steep. In this way, the law of diminishing returns produces the outward-bending shape of the production possibilities frontier.
Productive Efficiency versus Allocative Efficiency
The study of economics does not presume to tell a society what choice it should make along its production possibilities frontier. In a market-oriented economy with a democratic government, the choice will involve a mixture of decisions by individuals, firms, and government. However, economics can point out that some choices are unambiguously better than others. This observation is based on the concept of efficiency. In everyday usage, efficiency refers to lack of waste. An inefficient machine operates at a high cost, while an efficient machine operates at a lower cost because it is not wasting energy or materials. An inefficient organization operates with long delays and high costs, while an efficient organization meets schedules, is focused, and performs within budget.
The production possibilities frontier can illustrate two kinds of efficiency: productive efficiency and allocative efficiency. The figure below illustrates these ideas using a production possibilities frontier between healthcare and education.
Productive efficiency means that, given the available inputs and technology, it is impossible to produce more of one good without decreasing the quantity that is produced of another good. All choices on the PPF in the figure below, including A, B, C, D, and F, display productive efficiency. As a firm moves from any one of these choices to any other, either healthcare increases and education decreases or vice versa. However, any choice inside the production possibilities frontier is productively inefficient and wasteful because it is possible to produce more of one good, the other good, or some combination of both goods.
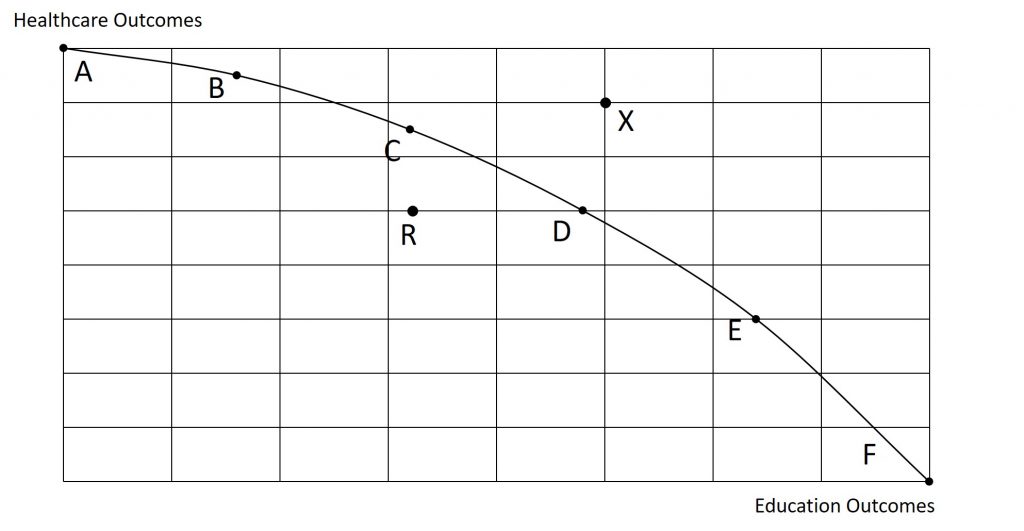
For example, point R is productively inefficient because it is possible at choice C to have more of both goods: education on the horizontal axis is higher at point C than point R (E2 is greater than E1), and healthcare on the vertical axis is also higher at point C than point R (H2 is great than H1).
On the other hand, allocation X is non-feasible, meaning that we cannot produce at the given level without a change in the factors of production.
Allocative efficiency means that the particular combination of goods and services on the production possibility curve that a society produces represents the combination that society most desires. How to determine what a society desires can be a controversial question, and is usually a discussion in political science, sociology, and philosophy classes as well as in economics. At its most basic, allocative efficiency means producers supply the quantity of each product that consumers demand. Only one of the productively efficient choices will be the allocative efficient choice for society as a whole.
Why Society Must Choose
The production possibilities curve illustrates the choices involved in this dilemma.
Every economy faces two situations in which it may be able to expand consumption of all goods. In the first case, a society may discover that it has been using its resources inefficiently, in which case by improving efficiency and producing on the production possibilities frontier, it can have more of all goods (or at least more of some and less of none). In the second case, as resources grow over a period of years (e.g., more labor and more capital), the economy grows. As it does, the production possibilities frontier for a society will tend to shift outward and society will be able to afford more of all goods.
However, improvements in productive efficiency take time to discover and implement, and economic growth happens only gradually. Thus, a society must choose between tradeoffs in the present. For the government, this process often involves trying to identify where additional spending could do the most good and where reductions in spending would do the least harm. At the individual and firm level, the market economy coordinates a process in which firms seek to produce goods and services in the quantity, quality, and price that people want. However, for both the government and the market economy in the short term, increases in production of one good typically mean offsetting decreases somewhere else in the economy.
Technological Improvements
To this point, we have assumed that factors of production and technology is held constant. But, what if there is some technological improvement or more factors of production are added (such as an increase in the amount of labor or capital available.)
If the technological advance only directly impacts one of the goods, the PPF will experience biased growth. In this situation, the maximum amount of the affected good increases but the maximum amount of the unaffected good does not change. This is shown in the figure below. In the example below, some technological advance has directly affected healthcare but has not directly affected education. For example, a new computer system allows for medical diagnoses to be made 50% faster and is 25% more accurate.
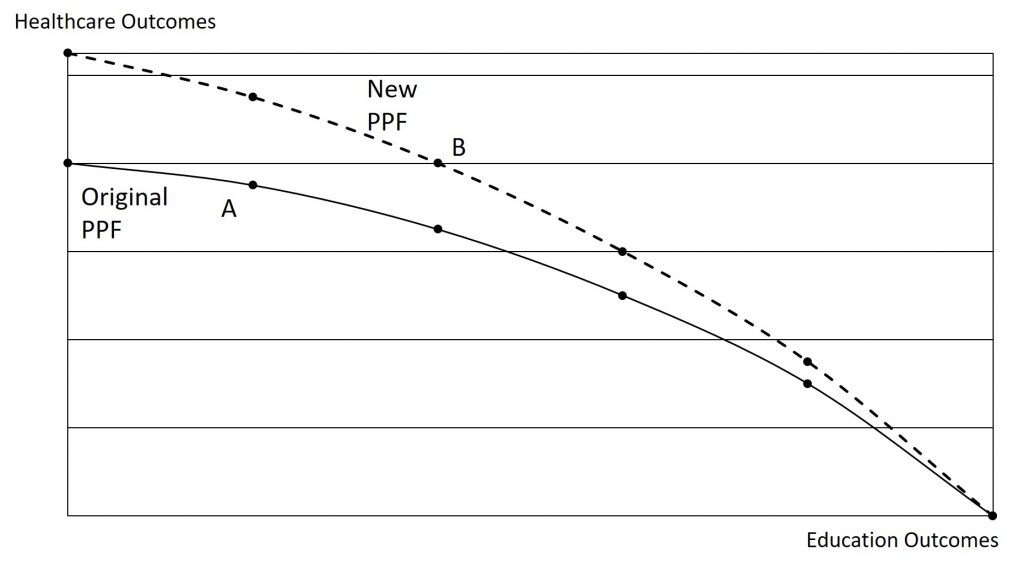
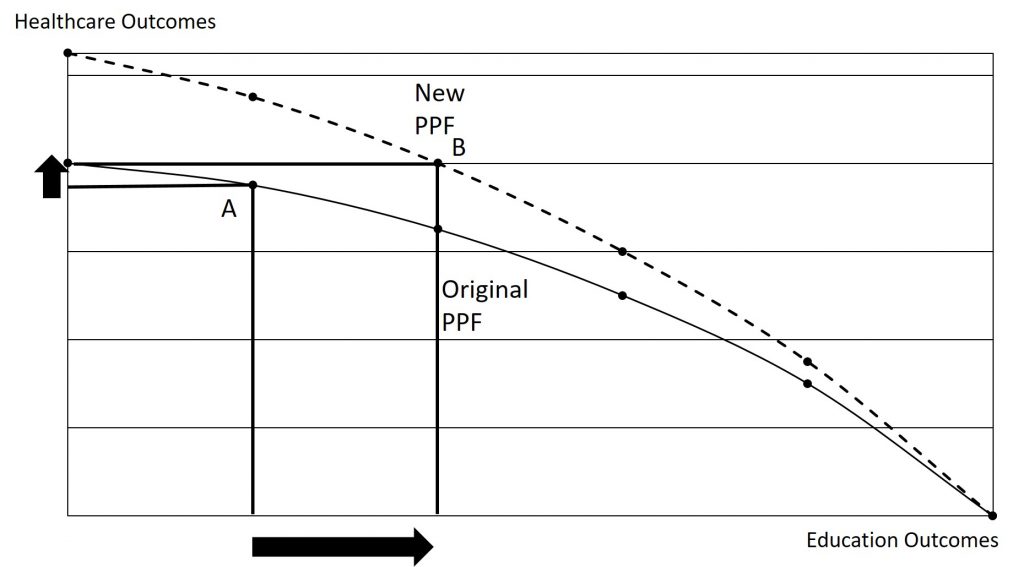
One important outcome from biased growth is the impact on the unaffected sector. For example, if we were originally producing at point A before the technological advance, we could potentially move to point B. But, at point B, we see that we are now producing more of both goods. How is that possible if the technological advance only impacted one sector? As the affected sector becomes more efficient, it is possible to reallocate resources away from that sector (since the remaining resources are still able to produce more than they did originally) and move them to the unaffected sector (allowing an increase in that sector as well.) This is illustrated in the figure below. In our example, now that medical diagnoses are made faster and more efficiently with computers, we need fewer people working in the medical sector. Therefore, we can transition people from the medical sector to the education sector. These additional people in the education sector are able to increase the level of educational attainment in the economy (even though no innovation directly affected the education sector.)
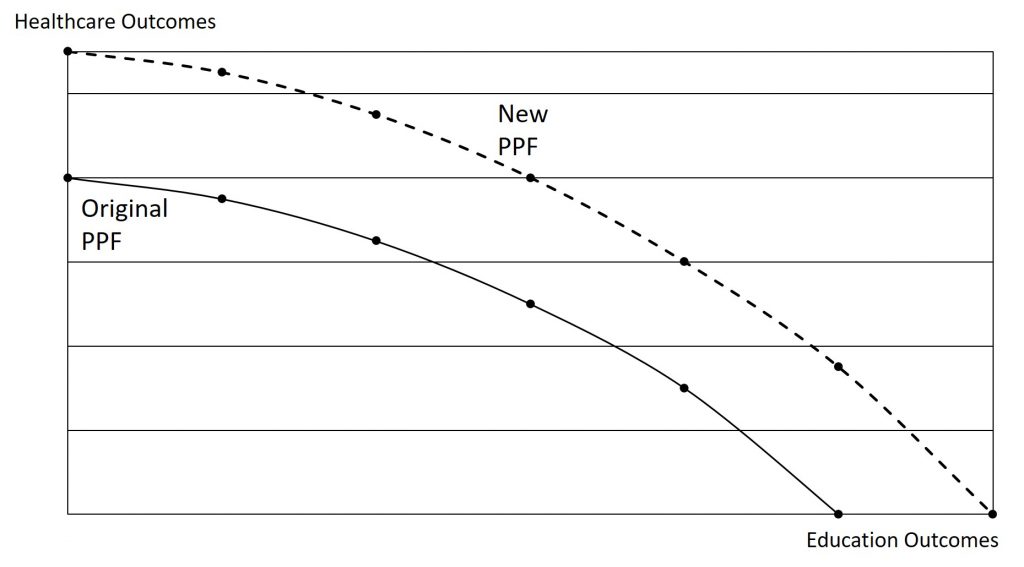
On the other hand, an innovation that directly impacts both sectors will cause the entire PPF to shift outward. The outward shift does not necessarily need to be proportional as the technological advance could impact one of the sectors more than the other. This is shown in the figure below.
2.3 Trade and advantage
From: https://openstax.org/details/books/principles-microeconomics-2e (Chapter 19.1-19.2)
Comparative and Absolute Advantage
The American statesman Benjamin Franklin (1706–1790) once wrote: “No nation was ever ruined by trade.” Many economists would express their attitudes toward international trade in an even more positive manner. The evidence that international trade confers overall benefits on economies is pretty strong. Trade has accompanied economic growth in the United States and around the world. Many of the national economies that have shown the most rapid growth in the last several decades—for example, Japan, South Korea, China, and India—have done so by dramatically orienting their economies toward international trade. There is no modern example of a country that has shut itself off from world trade and yet prospered. To understand the benefits of trade, or why we trade in the first place, we need to understand the concepts of comparative and absolute advantage.
In 1817, David Ricardo, a businessman, economist, and member of the British Parliament, wrote a treatise called On the Principles of Political Economy and Taxation. In this treatise, Ricardo argued that specialization and free trade benefit all trading partners, even those that may be relatively inefficient. To see what he meant, we must be able to distinguish between absolute and comparative advantage.
A country has an absolute advantage over another country in producing a good if can produce more of the good than any other country when it dedicates all of its resources toward the production of that good. Absolute advantage can be the result of a country’s natural endowment. For example, extracting oil in Saudi Arabia is pretty much just a matter of “drilling a hole.” Producing oil in other countries can require considerable exploration and costly technologies for drilling and extraction—if they have any oil at all. The United States has some of the richest farmland in the world, making it easier to grow corn and wheat than in many other countries. Guatemala and Colombia have climates especially suited for growing coffee. Chile and Zambia have some of the world’s richest copper mines. As some have argued, “geography is destiny.” Chile will provide copper and Guatemala will produce coffee, and they will trade. When each country has a product others need and it can produce it with fewer resources in one country than in another, then it is easy to imagine all parties benefiting from trade. However, thinking about trade just in terms of geography and absolute advantage is incomplete. Trade really occurs because of comparative advantage.
Comparative advantage occurs when it can produce a good at a lower cost in terms of other goods. The question each country or company should be asking when it trades is this: “What do we give up to produce this good?” It should be no surprise that the concept of comparative advantage is based on this idea of opportunity cost from Choice in a World of Scarcity. For example, if Zambia focuses its resources on producing copper, it cannot use its labor, land and financial resources to produce other goods such as corn. As a result, Zambia gives up the opportunity to produce corn. How do we quantify the cost in terms of other goods? Simplify the problem and assume that Zambia just needs labor to produce copper and corn. The companies that produce either copper or corn tell you that it takes two hours to mine a ton of copper and one hour to harvest a bushel of corn. This means the opportunity cost of producing a ton of copper is two bushels of corn.
In order to determine the comparative advantage, we must calculate opportunity cost. Opportunity cost can be calculated in two different (but equivalent) ways. First, if I want to determine the cost of producing good A (in terms of what I have to sacrifice of good B to produce a unit of good A), we can find the quotient:
[latex]\text{Opportunity Cost of Producing Good A}=\frac{\text{Time it Takes to Produce Good B}}{\text{Time it Takes to Produce Good A}}[/latex]
Equivalently, you can also use the following quotient:
[latex]\text{Opportunity Cost of Producing Good A}=\frac{\text{Maximum Production of Good B}}{\text{Maximum Production of Good A}}[/latex]
Before we start any sort of calculation, let us try to get a better understanding of what comparative advantage means and why it is important when considering international trade (and why even small countries are competitive in the world economy).
To build an intuitive understanding of how comparative advantage can benefit all parties, set aside examples that involve national economies for a moment and consider the situation of a group of friends who decide to go camping together. The six friends have a wide range of skills and experiences, but one person in particular, Jethro, has done lots of camping before and is also a great athlete. Jethro has an absolute advantage in all aspects of camping: he is faster at carrying a backpack, gathering firewood, paddling a canoe, setting up tents, making a meal, and washing up. So here is the question: Because Jethro has an absolute productivity advantage in everything, should he do all the work?
Of course not! Even if Jethro is willing to work like a mule while everyone else sits around, he, like all mortals, only has 24 hours in a day. If everyone sits around and waits for Jethro to do everything, not only will Jethro be an unhappy camper, but there will not be much output for his group of six friends to consume. The theory of comparative advantage suggests that everyone will benefit if they figure out their areas of comparative advantage—that is, the area of camping where their productivity disadvantage is least, compared to Jethro. For example, it may be that Jethro is 80% faster at building fires and cooking meals than anyone else, but only 20% faster at gathering firewood and 10%faster at setting up tents. In that case, Jethro should focus on building fires and making meals, and others should attend to the other tasks, each according to where their productivity disadvantage is smallest. If the campers coordinate their efforts according to comparative advantage, they can all gain.
To help explore the differences, let us work through an example.
Example
Consider a hypothetical world with two countries, Saudi Arabia and the United States, and two products, oil and corn. Further, assume that consumers in both countries desire both these goods. These goods are homogeneous, meaning that consumers/producers cannot differentiate between corn or oil from either country. There is only one resource available in both countries, labor hours. Saudi Arabia can produce oil with fewer resources, while the United States can produce corn with fewer resources. The table below illustrates the advantages of the two countries, expressed in terms of how much they can produce in a single day if they only produce one of the goods (and produce none of the other).
| Country | Oil Production | Corn Production |
|---|---|---|
| United States | 50 | 100 |
| Saudi Arabia | 100 | 25 |
First, let us determine which country has an absolute advantage in each good.
The United States has an absolute advantage in corn production because it can produce more corn that Saudi Arabia if it dedicates all resources to corn production (100>25). On the other hand, Saudi Arabia has an absolute advantage in oil production because it can produce more oil than the United States if it dedicates all of its resources to oil production (100>50.)
Next, let us consider comparative advantage. First, you need to calculate the opportunity cost of producing each good for each country. You can find the equations above.
First, let us calculate the opportunity cost of producing oil for each country. We start with the United States:
[latex]\text{Opportunity cost of oil production for the US}=\frac{100}{50}=2 \text{ corn.}[/latex]
Next, let us calculate the opportunity cost of oil production in Saudi Arabia:
[latex]\text{Opportunity cost of oil production for the Saudi Arabia}=\frac{25}{100}=0.25 \text{ corn.}[/latex]
Next, we repeat the calculations for corn production:
[latex]\text{Opportunity cost of corn production for the US}=\frac{50}{100}=0.5 \text{ oil.}[/latex]
Next, let us calculate the opportunity cost of oil production in Saudi Arabia:
[latex]\text{Opportunity cost of corn production for the Saudi Arabia}=\frac{100}{25}=4 \text{ oil.}[/latex]
As a note, be sure to notice that the opportunity cost of producing good A is given in terms of good B. This is because the opportunity cost shows us what we have to give up (of good B) in order to produce one unit of good A.
Next, we find a comparative advantage by comparing opportunity costs. Specifically, for each good, we determine which country has the lower opportunity cost of production.
The United States has a comparative advantage in corn production because its opportunity cost (0.5 oil) is less than Saudi Arabia’s (4 oil). On the other hand, Saudi Arabia has a comparative advantage in oil production because its opportunity cost (0.25 corn) is less than the US opportunity cost (2 corn).
Outcomes from Comparative Advantage
Trade allows for specialization. This is because we can consume outside of our personal PPF. We can trade for goods that we can produce ourselves but that can be produced elsewhere for a lower opportunity cost.
Countries with a comparative advantage in a good should export the good to other countries. Countries that lack comparative advantage should import the good.
