
7 The Aggregate Expenditure Model
9.1 The Aggregate expenditure model
From: https://courses.lumenlearning.com/boundless-economics/chapter/introducing-aggregate-expenditure/
Defining Aggregate Expenditure: Components and Comparison to GDP
Aggregate expenditure is the current value of all the finished goods and services in the economy.
In economics, aggregate expenditure is the current value of all the finished goods and services in the economy. It is the sum of all the expenditures undertaken in the economy by the factors during a specific time period. The equation for aggregate expenditure is: AE = C + I + G + NX.
Written out the equation is: aggregate expenditure equals the sum of the household consumption (C), investments (I), government spending (G), and net exports (NX).
- Consumption (C): The household consumption over a period of time.
- Planned investment (I): Planned spending on capital goods.
- Government expenditure (G): The amount of spending by federal, state, and local governments. Government expenditure can include infrastructure or transfers which increase the total expenditure in the economy.
- Net exports (NX): Total exports minus the total imports.
The aggregate expenditure determines the total amount that firms and households plan to spend on goods and services at each level of income.
The aggregate expenditure is one of the methods that is used to calculate the total sum of all the economic activities in an economy, also known as the gross domestic product (GDP). The gross domestic product is important because it measures the growth of the economy. The GDP is calculated using the Aggregate Expenditures Model.
Investment versus Planned Investment
Recall from chapter 4 that the investment component of GDP includes business fixed expenditures (such as a business purchasing new machinery, new vehicles, building a new factory, etc.), new residential construction, and changes in inventory. A change in inventory occurs either when a company produces a product but does not sell it (causing an increase in inventory) or when a company sells a previously unsold good (causing a decrease in inventory.) When a company decides on how much to spend on investment, we assume they are making a decision about business fixed expenditures. Therefore, we assume that the amount that companies plan to spend on things like machinery and other physical capital will be equal to what they actually spend. The difference between actual investment and planned investment will be caused by an unexpected change in inventories.
For example, suppose that Toyota produces 125,000 Tundra pick-up trucks. If they sell all of them, then there will be no change in inventory. But, if they only sell 100,000 Tundra pick-up trucks, then those 25,000 trucks are added to inventory and result in an unexpected increase in investment. Therefore, changes in inventories depend on actual sales which can not always be accurately predicted.
If we consider the entire economy, actual investment spending will be greater than planned investment spending when there is an unexpected increase in inventories. On the other hand, if inventories fall more than expected, then actual investment will be less than planned investment. Therefore, it is only when there is no unexpected change in inventory that the planned investment will equal actual investment.
As we continue to discuss the aggregate expenditure model, investment will refer to the planned investment rather than the actual investment.
Economic Equilibrium
A macroeconomy will be in equilibrium when
Aggregate expenditure = GDP.
This occurs when what is being produced is equal to what is being sold.
But a macroeconomy will not always be in equilibrium.
When aggregate expenditure is greater than GDP then spending is greater than production. When this is occurring an individual store may realize that product is being purchased faster than they are able to order new product in. A company would then realize that new orders are exceeding their current production and may need to dip into existing inventories to fulfill orders. This could also result in a reduction in available varieties. For example, if Toyota is selling cars faster than they are able to produce them, then some of the most popular varieties may sell out. If you are truck shopping, you may have wanted a slate-colored truck but have to settle for a blue one. As Toyota realizes this, they will ramp up production which will result in the increase in employment as well.
If this is occurring throughout an entire economy then we will see GDP will begin to increase as companies work to increase their production. Therefore, when aggregate expenditure is greater than GDP, inventories will decline forcing companies to ramp-up production to meet the now greater expenditures. This will lead to an increase in both real GDP and employment.
When aggregate expenditure is less than GDP then spending is less than production. When this is occurring an individual store may realize that product is not moving quickly off the shelves. As the store realizes this, they start to order less from their distributor.. A company would then realize that new orders are far less than their current production and their warehouse is filling up. For example, if Toyota is barely selling any cars and continues to produce them then dealership lots will be full and there will be nowhere to deliver the cars. This leads to an increase in inventory. As Toyota realizes this, they will slow down production which will result in a reduction in employment as well.
If this is occurring throughout an entire economy then we will see GDP will begin to decrease as companies work to slow their production. Therefore, when aggregate expenditure is less than GDP, inventories will increase forcing companies to slow down production to compensate for the reduction in expenditures. This will lead to a decrease in both real GDP and employment. Table 9.1 summarizes the three possibilities.
| When | Then, | Therefore, |
| Aggregate expenditure = GDP | Inventories remain the same | The macroeconomy is in equilibrium. |
| Aggregate expenditure > GDP | Inventories shrink | GDP and employment will increase. |
| Aggregate expenditure < GDP | Inventories increase | GDP and employment will decrease. |
9.2 The Components of aggregate expenditure
Consumption
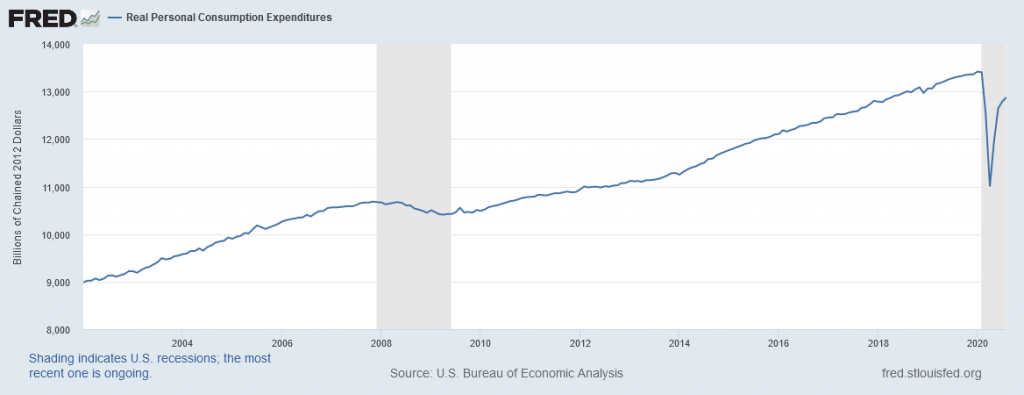
Consumption, in real terms, is generally upward-trending. This means that over time we buy more and more things. Because this is given in real terms it means that we are not just spending more (since prices are controlled), but rather buying more and more. The graph below shows consumption in the United States since 2002. We see consumption can fall to some degree during a recession such as during the 2008 financial crisis. There was a more significant decline in the most recent pandemic recession due to the near complete shutdown of the economy.
Consumption is determined by the following factors:
- Disposable current and future income
- Household wealth
- The real interest rate
- Price levels
Disposable Current and Future Income
Recall that disposable income is equal to income and transfer payments minus taxes paid. As current disposable income increases, so does aggregate expenditure. The opposite is also true. Generally income is either flat or increasing, but can fall during periods of economic contraction. Future income can also come into play. If people expect their income to increase in the future, their current consumption may increase today in preparation of their increased income. In either case, current disposable income will have a greater impact on aggregate expenditure than future income.
Household Wealth
Wealth is defined as assets minus liabilities. Therefore, if the value of assets increases or the value of debt decreases, the household is wealthier. As household wealth increases, so will expenditure. Wealth can also encapsulate savings. If a household has a larger safety net, they may be more likely to spend more knowing that if things go south, they will be able to weather the storm. But, as wealth decreases, aggregate expenditure is likely to decrease as the household now has a smaller safety net.
Real Interest Rate
Spending on durable goods is likely to be affected when the real interest rate changes. When purchasing a meal from a restaurant or hiring a lawyer, you rarely think about the interest rate. On the other hand, when purchasing a car or making some other large purchase, the interest rate will be important. Recall that the real interest rate is the difference between the nominal interest rate (what the bank is charging you) and the inflation rate. As the real interest rate increases, the cost of borrowing will increase. This results in a decrease in aggregate expenditures as durable good purchases will fall. On the other hand, a decrease in the real interest rate make it cheaper to borrow and will therefore lead to an increase in aggregate expenditure.
Price Level
In microeconomics, we talk about how the change in the price of a single good will affect the quantity demanded of that good. At the macro level, the change in the price of a single good will almost never have a significant impact at the national level. (Gasoline may be an exception, but we need to worry about that yet.) As the price of a single good increases, consumers will simply change how they spend their money and will not affect overall spending. But, as the national price level changes, expenditure may change. If the national price level increases, goods and services are now more expensive. If disposable income remains constant, then $1 buys you less. Therefore, the total quantity of goods and services will fall. On the other hand, if price levels fall, then a dollar becomes more valuable meaning that consumers are able to purchase more than before.
To Save or Spend: The Multipliers
From: OpenStax Macroeconomics (Appendix B): https://openstax.org/details/books/principles-macroeconomics-2e
How do consumption expenditures increase as national income rises? People can do two things with their income: consume it or save it (for the moment, let’s ignore the need to pay taxes with some of it). Each person who receives an additional dollar faces this choice. The marginal propensity to consume (MPC), is the share of the additional dollar of income a person decides to devote to consumption expenditures. The marginal propensity to save (MPS) is the share of the additional dollar a person decides to save. It must always hold true that:
MPC + MPS = 1
For example, if the marginal propensity to consume out of the marginal amount of income earned is 0.9, then the marginal propensity to save is 0.1.
The general form of the consumption function is: C = a + mpc*(Income – a).
An assumption commonly made in this model is that even if income were zero, people would have to consume something. In this example, consumption would be $600 even if income were zero. Then, the MPC is 0.8 and the MPS is 0.2. Thus, when income increases by $1,000, consumption rises by $800 and savings rises by $200. At an income of $4,000, total consumption will be the $600 that would be consumed even without any income, plus $4,000 multiplied by the marginal propensity to consume of 0.8, or $ 3,200, for a total of $ 3,800. The total amount of consumption and saving must always add up to the total amount of income. (Exactly how a situation of zero income and negative savings would work in practice is not important, because even low-income societies are not literally at zero income, so the point is hypothetical.) This relationship between income and consumption is called the consumption function.
The consumption function for the previous situation would be C = 600 + 0.8(Disposable Income – 600). The consumption function is shown below is Figure 9.2.
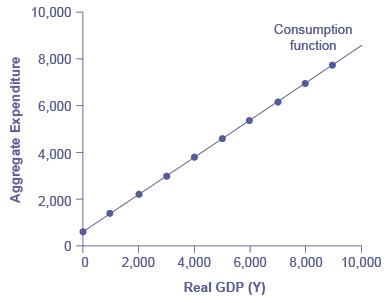
However, a number of factors other than income can also cause the entire consumption function to shift. These factors were summarized in the earlier discussion of consumption. When the consumption function moves, it can shift in two ways: either the entire consumption function can move up or down in a parallel manner, or the slope of the consumption function can shift so that it becomes steeper or flatter. For example, if a tax cut leads consumers to spend more, but does not affect their marginal propensity to consume, it would cause an upward shift to a new consumption function that is parallel to the original one. However, a change in household preferences for saving that reduced the marginal propensity to save would cause the slope of the consumption function to become steeper: that is, if the savings rate is lower, then every increase in income leads to a larger rise in consumption.
To calculate the marginal propensity to consume,
MPC = Change in Consumption/Change in Disposable Income.
So working backwards, if a $1,000 in disposable income leads to an $800 increase in consumption, then the MPC would be
MPC = 800/1,000 = 0.8.
So how does this relate to the national economy? Let us return to our equations from chapter 8. For simplicity, we will rewrite taxes minus transfer payments as net taxes. If this value is positive, that means that the average consumer receives more transfer payments from the government than they pay in taxes and vice versa. Therefore,
Disposable income = National income – Net Taxes
If we re-write, we get
National income = GDP = Disposable income + Net taxes.
If we assume that net taxes will be constant based on a given income level (in reality, they are not, but let us keep this simple), then we see that any increase in national income will lead to an increase in consumption. The same holds for disposable income as seen earlier.
Planned Investment
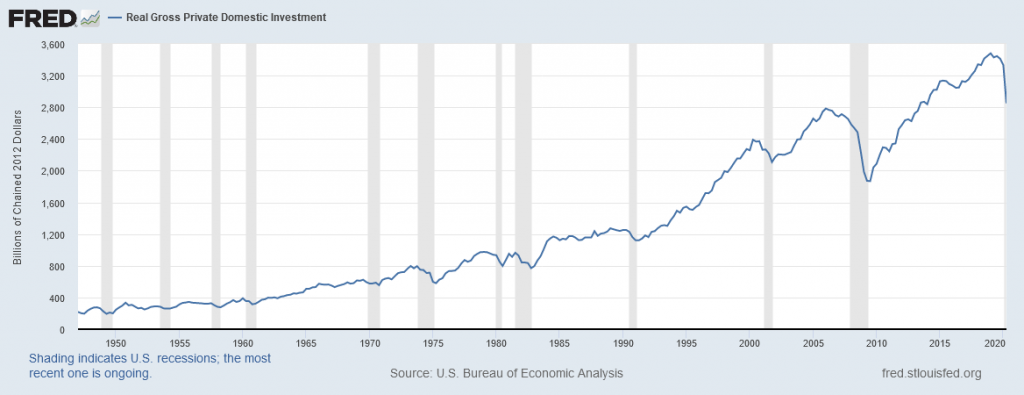
Investment tends to be far more volatile than consumption as seen in Figure 9.3 below.
Planned investment is determined by the following:
- Expectations of future profitability
- The real interest rate
- Taxes
- Cash flow.
Expectation of Future Profitability
Investment does not yield immediate profit. Instead, investment requires a large upfront expenditure with the hope of earning future profits. But investment also requires a risk. Therefore, as firms expect greater future profitability, their appetite for investment risk will increase. Therefore, an increase in expected future profit will lead to more investment while a decrease in expected future profit, such as during times of economic slowdown, will lead to a reduction in investment. This is evident in Figure 9.3.
The Real Interest Rate
For the same rationale as we saw with consumption, the real interest rate will dictate the cost of investment spending. Because investment can be costly, firms often must finance these investment activities. Again, the real interest rate gives the cost of borrowing. So, as the real interest rate increases, the cost of borrowing increases which reduces investment spending. On the other hand, as the real interest rate decreases, the cost of borrowing decreases which increases investment spending.
Taxes
When considering consumption spending, we investigated income versus disposable income. While we will not explicitly make the differentiation here, we must still make the consideration. If taxes increase, companies must spend more money on their tax payments and will therefore have less to spend on investment projects. But, if taxes fall, companies now have more money, all else equal, to spend on investment projects.
Cash Flow
While some companies finance their investment projects, others use cash-on-hand to finance these projects. Therefore, the greater the cash flow for a company, the greater the ability to engage in these investment projects.
Investment Graphically
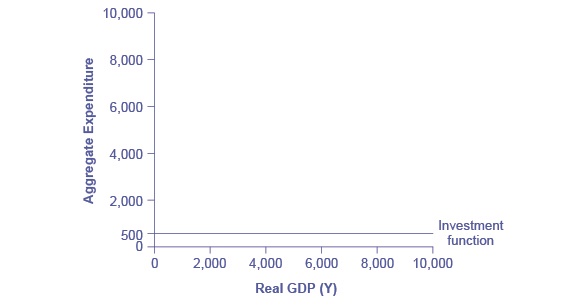
We assume that planned investment will determined ahead of time and will therefore not change based on current real GDP. The graph is therefore horizontal. This is shown below in Figure 9.4.
Government Purchases
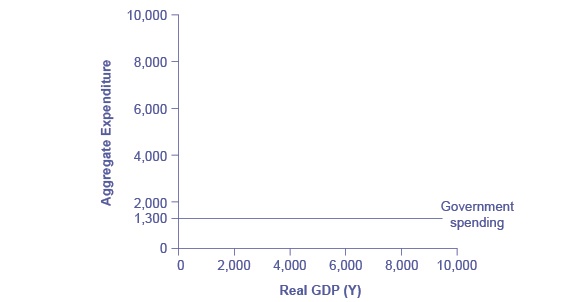
Government spending appears as a horizontal line, as in Figure 9.5, where government spending is set at a level of 1,300. As in the case of investment spending, this horizontal line does not mean that government spending is unchanging. It means only that government spending changes when Congress decides on a change in the budget, rather than shifting in a predictable way with the current size of the real GDP shown on the horizontal axis.
Again, taxes can complicate the situation but for simplicity, we will assume that they are constant and incorporated into the consumption portion of our graph.
9.3 Potential GDP
From: https://courses.lumenlearning.com/wm-macroeconomics/chapter/the-neoclassical-perspective-and-aggregate-demand-and-supply/
When economists refer to potential GDP, they are referring to that level of output that can be achieved when all resources (land, labor, capital, and entrepreneurial ability) are fully employed. While the measured unemployment rate in labor markets will never be zero, full employment in the labor market occurs when there is no cyclical unemployment. There will still be some frictional or structural unemployment, but when the economy is operating with zero cyclical unemployment, the economy is said to be at the natural rate of unemployment, or at full employment.
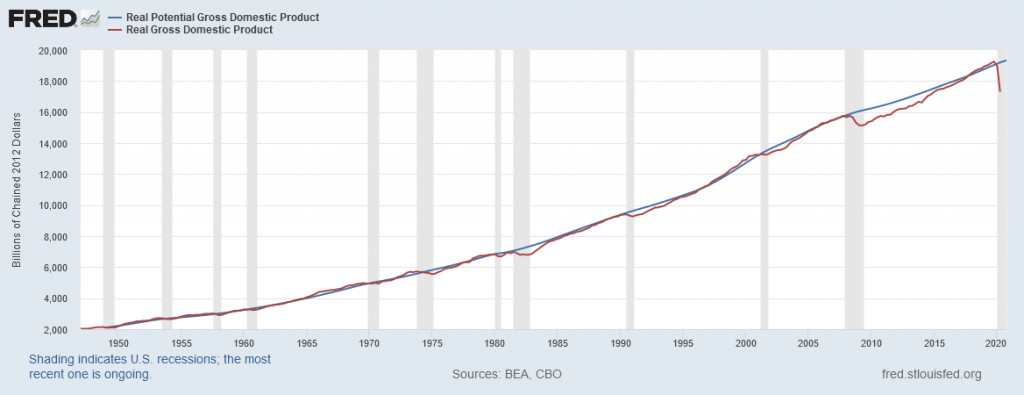
Figure 9.6 shows potential and actual real GDP from 1960 to 2020 (the data for potential GDP is estimated by the nonpartisan Congressional Budget Office, while the data for real GDP is from the Bureau of Economic Analysis in the U.S. Department of Commerce). What should be clear is that while actual GDP is sometimes above and sometimes below potential, over the long term it tracks potential quite well. For example from 2008 to 2009, the U.S. economy tumbled into recession and remained below its potential. At other times, like in the late 1990s or late 2017, the economy ran at potential GDP—or even slightly ahead. Most economic recessions and upswings are times when the economy is 1–3% below or above potential GDP in a given year. Clearly, short-run fluctuations around potential GDP do exist, but over the long run, the upward trend of potential GDP determines the size of the economy.
The unemployment rate has fluctuated from as low as 3.5% in 1969 to as high as 9.7% in 1982 and 9.6% in 2009. Even as the U.S. unemployment rate rose during recessions and declined during expansions, it kept returning to the general neighborhood of 5.0–5.5%. When the Congressional Budget Office carried out its long-range economic forecasts in 2010, it assumed that from 2015 to 2020, after the recession has passed, the unemployment rate would be 5.0%. From a long-run perspective, the economy seems to keep adjusting back to this rate of unemployment, which we described above as the natural rate.
Growth in GDP can be explained by investment in physical capital and human capital per person, as well as advances in technology. Physical capital per person refers to the amount and kind of machinery and equipment available to help people get work done. Compare, for example, your productivity in typing a term paper on a typewriter to working on your laptop with word processing software. Clearly, you will be able to be more productive using word processing software. The technology and level of capital of your laptop and software has increased your productivity. More broadly, the development of GPS technology and Universal Product Codes (those barcodes on every product we buy) has made it much easier for firms to track shipments, tabulate inventories, and sell and distribute products. These two technological innovations, and many others, have increased a nation’s ability to produce goods and services for a given population. Likewise, increasing human capital involves increasing levels of knowledge, education, and skill sets per person through vocational or higher education. Physical and human capital improvements with technological advances will increase overall productivity and, thus, GDP.
9.4 Graphing the aggregate expenditure model
From: OpenStax Macroeconomics (Appendix B): https://openstax.org/details/books/principles-macroeconomics-2e
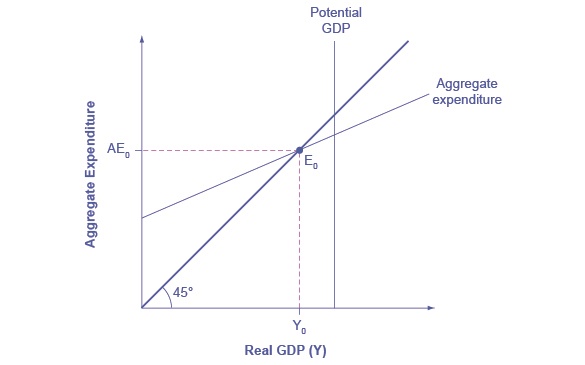
The expenditure-output model, sometimes also called the Keynesian cross diagram, determines the equilibrium level of real GDP by the point where the total or aggregate expenditures in the economy are equal to the amount of output produced. The axes of the Keynesian cross diagram presented in Figure 9.6 show real GDP on the horizontal axis as a measure of output and aggregate expenditures on the vertical axis as a measure of spending. While we have not yet discussed potential GDP, we will discuss it in the next chapter. For now, consider it to be the level of output that an economy can comfortably produce at given its factors of production. The gap between the current level of expenditure and the potential GDP will dictate whether an economy is in a state of expansion or contraction.
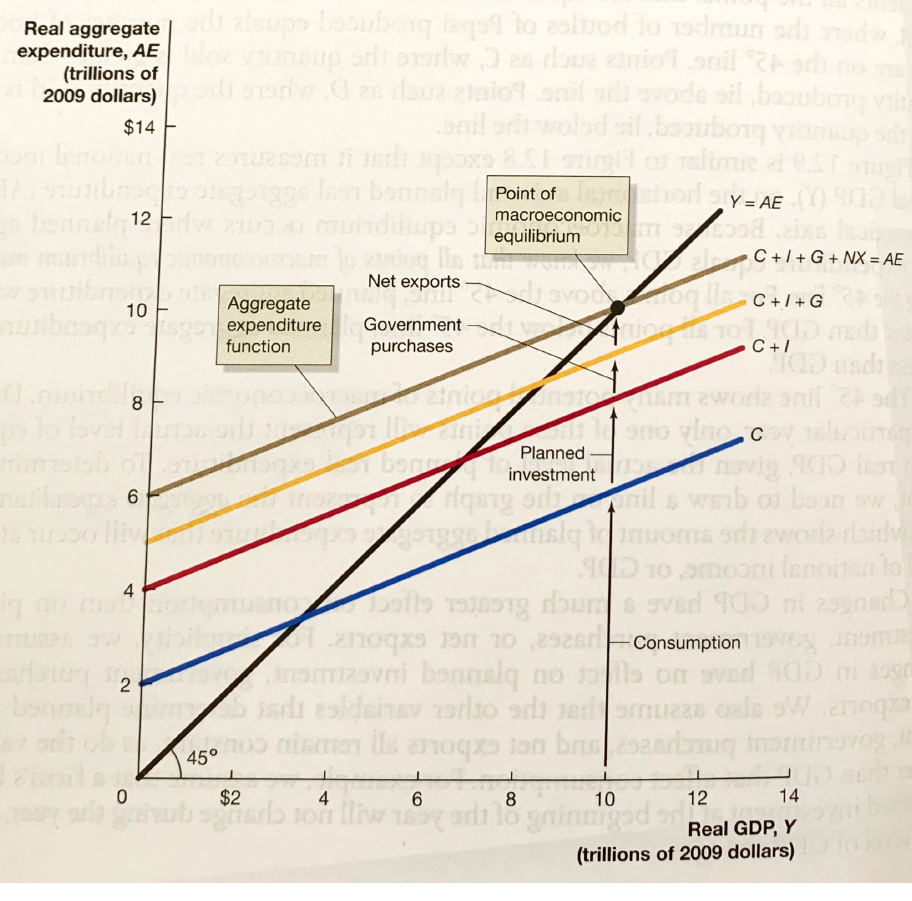
All the components of aggregate expenditure (for a closed economy)—consumption, investment, and government spending—are now in place to build the Keynesian cross diagram. Figure 9.7 builds up an aggregate expenditure function, based on the numerical illustrations of C, I, and G that have been used throughout this text. Note: I am temporarily using an image from the Hubbard and O’Brien. Ignore the NX function. A new image will be inserted in the next draft.
One spot of confusion may be as to why the investment and government lines seem to be upward-sloping. They are not. The aggregate expenditure function is formed by stacking on top of each other the consumption function (after taxes), the investment function, the government spending function, the export function, and the import function. The point at which the aggregate expenditure function intersects the vertical axis will be determined by the levels of investment and government purchases—which do not vary with national income. The upward slope of the aggregate expenditure function will be determined by the marginal propensity to save and the tax rate. A higher marginal propensity to save and a higher tax rate will all make the slope of the aggregate expenditure function flatter—because out of any extra income, more is going to savings or taxes or imports and less to spending on domestic goods and services.
With the aggregate expenditure line in place, the next step is to relate it to the two other elements of the Keynesian cross diagram. Thus, the first subsection interprets the intersection of the aggregate expenditure function and the 45-degree line, while the next subsection relates this point of intersection to the potential GDP line.
The point where the aggregate expenditure line that is constructed from C + I + G crosses the 45-degree line will be the equilibrium for the economy. It is the only point on the aggregate expenditure line where the total amount being spent on aggregate demand equals the total level of production.
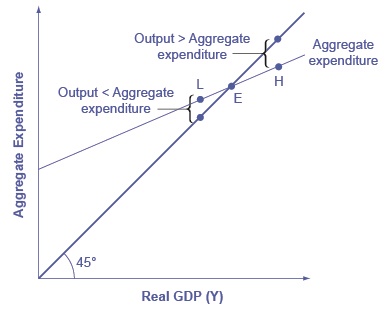
The meaning of “equilibrium” remains the same; that is, equilibrium is a point of balance where no incentive exists to shift away from that outcome. To understand why the point of intersection between the aggregate expenditure function and the 45-degree line is a macroeconomic equilibrium, consider what would happen if an economy found itself to the right of the equilibrium point E, say point H in Figure 9.8, where output is higher than the equilibrium. At point H, the level of aggregate expenditure is below the 45-degree line, so that the level of aggregate expenditure in the economy is less than the level of output. As a result, at point H, output is piling up unsold—not a sustainable state of affairs.
Conversely, consider the situation where the level of output is at point L—where real output is lower than the equilibrium. In that case, the level of aggregate demand in the economy is above the 45-degree line, indicating that the level of aggregate expenditure in the economy is greater than the level of output. When the level of aggregate demand has emptied the store shelves, it cannot be sustained, either. Firms will respond by increasing their level of production. Thus, the equilibrium must be the point where the amount produced and the amount spent are in balance, at the intersection of the aggregate expenditure function and the 45-degree line.
9.5 The Multiplier Effect
Suppose that the macro equilibrium in an economy occurs at the potential GDP, so the economy is operating at full employment. Keynes pointed out that even though the economy starts at potential GDP, because aggregate demand tends to bounce around, it is unlikely that the economy will stay at potential. In 2007, U.S. investment expenditure collapsed with the fall of the housing market. As a result, the U.S. economy went into the Great Recession. But how much did GDP fall? Suppose investment fell by $100 billion. You might expect the result would be that GDP would fall by $100 billion too. If so, you would be wrong. It turns out that changes in any category of expenditure (Consumption + Investment + Government Expenditures) have a more than proportional impact on GDP. Or to say it differently, the change in GDP is a multiple of (say 3 times) the change in expenditure. This is the idea behind the multiplier.
The reason is that a change in aggregate expenditures circles through the economy: households buy from firms, firms pay workers and suppliers, workers and suppliers buy goods from other firms, those firms pay their workers and suppliers, and so on. In this way, the original change in aggregate expenditures is actually spent more than once. This is called the expenditure multiplier effect: an initial increase in spending, cycles repeatedly through the economy and has a larger impact than the initial dollar amount spent.
To understand how this works, we need to introduce two new terms: autonomous spending versus induced spending:
From: https://en.wikipedia.org/wiki/Autonomous_consumption
Autonomous consumption (also exogenous consumption) is the consumption expenditure that occurs when income levels are zero. Such consumption is considered autonomous of income only when expenditure on these consumables does not vary with changes in income; generally, it may be required to fund necessities and debt obligations. If income levels are actually zero, this consumption counts as dissaving, because it is financed by borrowing or using up savings. Autonomous consumption contrasts with induced consumption, in that it does not systematically fluctuate with income, whereas induced consumption does.[1]
So far, we have explored consumption, planned investment, and government spending. Both planned investment and government spending are autonomous which means these values are given and not based on real GDP. Recall that when we created the aggregate expenditure model, adding planned investment and government spending shifted the AE curve vertically causing the movements to be parallel. Also recall that the graph for each was horizontal. This indicates that these will not change with real GDP unless we force it to change (due to some external circumstance.)
On the on the other hand, the consumption function has both an autonomous and induced component. Recall that we said that a certain level of consumption will occur regardless of income as people need to consume the bare necessities even if they do not have income. This is autonomous. On the other hand, we also said that people will consume more as their income increases. This consumption is induced (since it is caused, or induced, by additional income.)
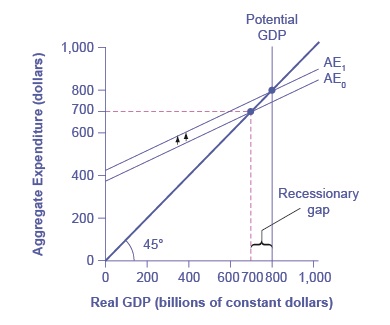
So, what happens if there is an increase in planned investment? We can see on Figure 9.9 that the curve shifts upward from the increase in investment. Changed in autonomous variables cause the AE curve to shift vertically upward or downward. In this case, there is an increase in planned investment. But we see there is a new equilibrium on the new AE curve where AE1 intersects with the 45-degree line. Even more important, the increase in real GDP is greater than the increase in planned investment. Let us explore why.
Let us consider government spending, which is also a type of autonomous spending. Suppose government spontaneously purchase $100 billion worth of goods and services, perhaps because they feel optimistic about the future. The producers of those goods and services see an increase in income by that amount. They use that income to pay their bills, paying wages and salaries to their workers, rent to their landlords, payments for the raw materials they use. Any income left over is profit, which becomes income to their stockholders. Each of these economic agents takes their new income and spend some of it. Those purchases then become new income to the sellers, who then turn around and spend a portion of it. That spending becomes someone else’s income. The process continues, though because economic agents spend only part of their income, the numbers get smaller in each round. When the dust settles the amount of new income generated is multiple times the initial increase in spending–hence, the name the spending multiplier. The table below gives an example of how this could work with an increase in government spending. Note that the multiplier works the same way in reverse with a decrease in spending.
Suppose that the marginal propensity to consumer is 0.90 which means that the marginal propensity to save is 0.10. This means that for every $1 earned, the average person will spend $0.90 and save $0.10. In the table below, we examine the role of $100 of government spending.
| Original increase in aggregate expenditure from government spending | 100 |
| Save 10% of income. Spend 90% of income. Second-round increase of… | 100-10=90 |
| $90 of income to people through the economy: Save 10% of income. Spend 90% of income. Third-round increase of… | 90-9=81 |
| $81 of income to people through the economy: Save 10% of income. Spend 90% of income. Fourth-round increase of… | 81-8.10=72.10 |
Table 9.2 works through the process of the multiplier. Over the first four rounds of aggregate expenditures, the impact of the original increase in government spending of $100 creates a rise in aggregate expenditures of $100 + $90 + $81 + $72.10 = $343.10, which is larger than the initial increase in spending. And the process isn’t finished yet.
Fortunately for everyone who is not carrying around a computer with a spreadsheet program to project the impact of an original increase in expenditures over 20, 50, or 100 rounds of spending, there is a formula for calculating the multiplier. The formula varies depending on how complex the version of the income-expenditure model is that you’re using.
Let’s look at the simplest case. The marginal propensity to consume (MPC) is the fraction of any change in income that is consumed and the marginal propensity to save (MPS) is the fraction of any change in income that is saved. We’ll assume for simplicity that there are no income taxes, and that imports are a set amount. In this case, the formula is:
Spending Multiplier = 1/(1-MPC)
Since a consumer’s only two options (in this example) are to spend income or to save it, MPC + MPS = 1, 1 – MPC = MPS. Thus, an equivalent form for the multiplier is:
Spending Multiplier = 1/MPS
Suppose the MPC = 90%; then the MPS = 10%
Therefore, the spending multiplier is:
Spending Multiplier = 1/(1-0.9) = 1/0.1 = 10.
In this simple case, a change in spending of $100 multiplied by the spending multiplier of 10 is equal to a change in GDP of $1,000.
In the real world, the multiplier formula is more complex since economic agents have more options than just spending or saving. They have to pay taxes, and they can buy imports, both of which reduce the amount of money being multiplied. Thus, the spending multiplier is somewhat smaller than the one we’ve calculated here.
The multiplier applies to any type of expenditure (e.g. C + I + G ), and it applies when expenditure decreases as well as when it increases. Say that business confidence declines and investment falls off, or that the economy of a leading trading partner slows down so that export sales decline. These changes will reduce aggregate expenditures, and then will have an even larger effect on real GDP because of the multiplier effect.
