6 Unemployment
6.1 the definition and calculation of unemployment
From: OpenStax Macroeconomics (http://cnx.org/content/col12190/1.4), Chapter 8.1
Unemployment can be a terrible and wrenching life experience—like a serious automobile accident or a messy divorce—whose consequences only someone who has gone through it can fully understand. For unemployed individuals and their families, there is the day-to-day financial stress of not knowing from where the next paycheck is coming. There are painful adjustments, like watching your savings account dwindle, selling a car and buying a cheaper one, or moving to a less expensive place to live. Even when the unemployed person finds a new job, it may pay less than the previous one. For many people, their job is an important part of their self worth. When unemployment separates people from the workforce, it can affect family relationships as well as mental and physical health.
The human costs of unemployment alone would justify making a low level of unemployment an important public policy priority. However, unemployment also includes economic costs to the broader society. When millions of unemployed but willing workers cannot find jobs, economic resource are unused. An economy with high unemployment is like a company operating with a functional but unused factory. The opportunity cost of unemployment is the output that the unemployed workers could have produced.
This chapter will discuss how economists define and compute the unemployment rate. It will examine the patterns of unemployment over time, for the U.S. economy as a whole, for different demographic groups in the U.S. economy, and for other countries. It will then consider an economic explanation for unemployment, and how it explains the patterns of unemployment and suggests public policies for reducing it.
Newspaper or television reports typically describe unemployment as a percentage or a rate. A recent report might have said, for example, from August 2009 to November 2009, the U.S. unemployment rate rose from 9.7% to 10.0%, but by June 2010, it had fallen to 9.5%. At a glance, the changes between the percentages may seem small. However, remember that the U.S. economy has about 160 million adults (as of the beginning of 2017) who either have jobs or are looking for them. A rise or fall of just 0.1% in the unemployment rate of 160 million potential workers translates into 160,000 people, which is roughly the total population of a city like Syracuse, New York, Brownsville, Texas, or Pasadena, California and more than the population of Erie. Large rises in the unemployment rate mean large numbers of job losses. In November 2009, at the peak of the recession, about 15 million people were out of work. Even with the unemployment rate now at 3.5% as of November 2019, about 5.8 million people who would like to have jobs are out of work.
The Labor Force
Should we count everyone without a job as unemployed? Of course not. For example, we should not count children as unemployed. Surely, we should not count the retired as unemployed. Many full-time college students have only a part-time job, or no job at all, but it seems inappropriate to count them as suffering the pains of unemployment. Some people are not working because they are rearing children, ill, on vacation, or on parental leave.
The point is that we do not just divide the adult population into employed and unemployed. A third group exists: people who do not have a job, and for some reason—retirement, looking after children, taking a voluntary break before a new job—are not interested in having a job, either. It also includes those who do want a job but have quit looking, often due to discouragement due to their inability to find suitable employment. Economists refer to this third group of those who are not working and not looking for work as out of the labor force or not in the labor force.
The U.S. unemployment rate, which is based on a monthly survey carried out by the U.S. Bureau of the Census, asks a series of questions to divide the adult population into employed, unemployed, or not in the labor force. To be classified as unemployed, a person must be without a job, currently available to work, and actively looking for work in the previous four weeks. Thus, a person who does not have a job but who is not currently available to work or has not actively looked for work in the last four weeks is counted as out of the labor force.
Employed: currently working for pay
Unemployed: Out of work and actively looking for a job
Out of the labor force: Out of paid work and not actively looking for a job
Labor force: the number of employed plus the unemployed
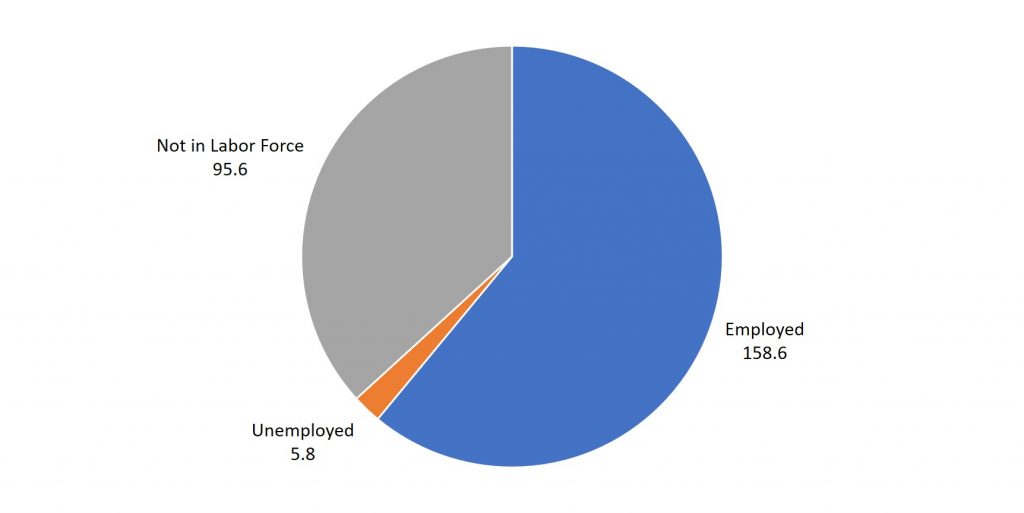
The breakdown of the United States population, as of November 2019, is shown below in Figure 6.1.
The Formulae
The first calculation determines what percentage of the adult population of a country is participating in the labor force. This is called the labor force participation rate and is calculated by dividing the number of people in the labor force (the number of people employed plus the number of people unemployed) by the number of adults in the population. It should be noted that children (those under 16 years old) are not considered in any sort of unemployment calculation. The formula is shown below.
LFPR = 100 * (# in Labor Force)/(Adults in Population) = 100 * (Employed + Unemployed)/(Adults in Population)
The unemployment rate is not the percentage of the total adult population without jobs, but rather the percentage of adults who are in the labor force but who do not have jobs. The formula is
UER = 100 * (Unemployed)/(Labor Force) = 100 * (Unemployed)/(Employed + Unemployed)
Using the data from Figure 6.1, we can calculate the following:
Employed: 158.6 million
Unemployed: 5.8 million
Labor Force: 158.6 million + 5.8 million = 164.4 million
Not in the Labor Force: 95.6 million
Adult Population = 158.6 million + 5.8 million + 95.6 million = 260 million
Labor Force Participation Rate = 100 * (164.4 million)/(260 million) = 100 * (0.632) = 63.2%
Unemployment Rate = 100 * (5.8 million)/(164.4 million) = 100 * (0.035) = 3.5%
Other Classifications of Employment
Even with the “out of the labor force” category, there are still some people who are mislabeled in the categorization of employed, unemployed, or out of the labor force. There are some people who have only part time or temporary jobs, and they are looking for full time and permanent employment that are counted as employed, although they are not employed in the way they would like or need to be. This group is called employed part-time for economic reasons. Additionally, there are individuals who are underemployed. This includes those who are trained or skilled for one type or level of work but are working in a lower paying job or one that does not utilize their skills. For example, we would consider an individual with a college degree in finance who is working as a sales clerk underemployed. They are, however, also counted in the employed group. All of these individuals fall under the umbrella of the term “hidden unemployment.”
Discouraged workers, those who have stopped looking for employment and, hence, are no longer counted in the unemployed also fall into this group. As we will see in the following example, when a large number of people become discouraged, all else equal, the unemployment rate can actually fall!
Consider the following example. Assume that each adult member of a population is represented in exactly one of the classifications in Table 6.1. Let us calculate the labor force participation rate and the unemployment rate. Then, we will re-calculate both of these when workers become discouraged.
| Group | People (millions) |
| Full-time employed | 100 |
| Part-time employed by choice | 30 |
| Employed part-time for economic reasons | 40 |
| No job but actively looking for work | 20 |
| No job but choosing not to work | 80 |
| Discouraged worker | 10 |
Let us classify each group. The first three groups are all employed. Regardless of whether you work full-time or part-time and regardless of whether you want full-time work when working part-time, you are employed. In our example, there is only one group we consider to be unemployed which is “no job but actively looking for work.” The next group, “no job but choosing not to work” is not considered to be unemployed because they are not searching for work. Therefore, they are not in the labor force. The final group, “discouraged worker”, is also not part of the labor force. The members of this group would like a job but have given up searching for work. They typically give up due to a poor economy. Because they do not have a paying job and because they are not actively searching for a job, they are not considered to be unemployed. The calculations for this example are as follows:
Employed = 100 + 30 + 40 = 170
Unemployed = 20
Labor Force = 170 + 20 = 190
Not in Labor Force = 80 + 10 = 90
Adult Population = 170 + 20 + 90 = 280
Labor Force Participation Rate = 100 * (190)/(280) = 100 * (0.679) = 67.9%
Unemployment Rate = 100 * (20)/(190) = 100 * (0.105) = 10.5%
Now, let us adjust the data. Suppose that the country is currently in a relatively deep recession and it is almost impossible to find a job because companies are only cutting jobs and are not hiring. What if of the 20 million unemployed, 15 million become discouraged. This means that they give up searching for work because of poor economic conditions. When they are actively searching for work they are considered to the unemployed and part of the labor force. When they become discouraged, they give-up searching and therefore are not longer unemployed (since actively searching for work is a condition of being unemployed) and therefore no longer part of the labor force. Therefore, when referring to Table 6.1, there are now only 5 million people in the “No job but actively looking for work” but 25 million discouraged workers (adding 15 million discouraged workers to the 10 million workers already discouraged.) The calculations are now:
Employed = 100 + 30 + 40 = 170
Unemployed = 5
Labor Force = 170 + 5 = 175
Not in Labor Force = 80 + 25 = 105
Adult Population = 170 + 5 + 105 = 280
Labor Force Participation Rate = 100 * (175)/(280) = 100 * (0.625) = 62.5%
Unemployment Rate = 100 * (5)/(175) = 100 * (0.029) = 2.9%
6.2 patterns of unemployment
From: OpenStax Macroeconomics (http://cnx.org/content/col12190/1.4), Chapter 8.2
Let’s look at how unemployment rates have changed over time and how various groups of people are affected by unemployment differently.
The Unemployment Rate and Labor Force Participation Rate
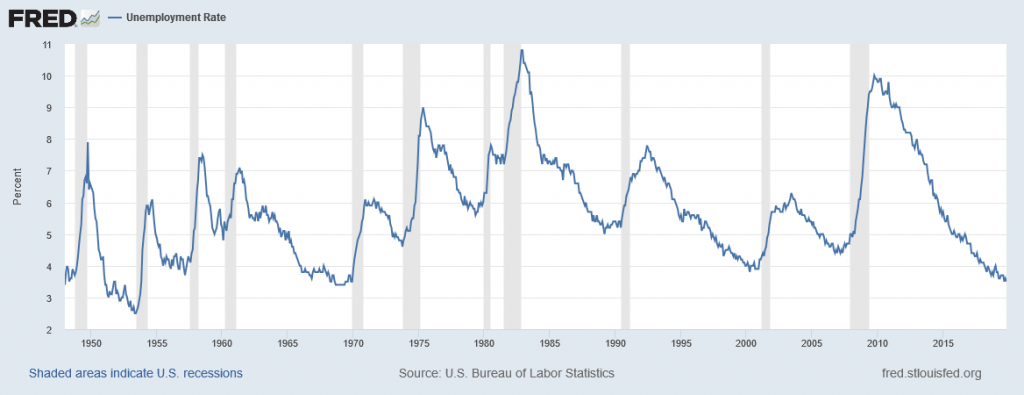
As we look at this data, several patterns stand out:
- 1. Unemployment rates do fluctuate over time. During the deep recessions of the early 1980s and of 2007–2009, unemployment reached roughly 10%. For comparison, during the 1930s Great Depression, the unemployment rate reached almost 25% of the labor force.
- Unemployment rates in the late 1990s and into the mid-2000s were rather low by historical standards. The unemployment rate was below 5% from 1997 to 2000, and near 5% during almost all of 2006–2007, and 5% or slightly less from September 2015 through January 2017 and has since fallen below 4%. The previous time unemployment had been less than 5% for three consecutive years was three decades earlier, from 1968 to 1970.
- The unemployment rate never falls all the way to zero. It almost never seems to get below 3%—and it stays that low only for very short periods. (We discuss reasons why this is the case later in this chapter.)
- The timing of rises and falls in unemployment matches fairly well with the timing of upswings and downswings in the overall economy, except that unemployment tends to lag changes in economic activity, and especially so during upswings of the economy following a recession. During periods of recession and depression, unemployment is high. During periods of economic growth, unemployment tends to be lower.
- No significant upward or downward trend in unemployment rates is apparent. This point is especially worth noting because the U.S. population more than quadrupled from 76 million in 1900 to over 324 million by 2017. Moreover, a higher proportion of U.S. adults are now in the paid workforce, because women have entered the paid labor force in significant numbers in recent decades. Women comprised 18% of the paid workforce in 1900 and nearly half of the paid workforce in 2017. However, despite the increased number of workers, as well as other economic events like globalization and the continuous invention of new technologies, the economy has provided jobs without causing any long-term upward or downward trend in unemployment rates.
The labor force participation rate for the United States economy is shown below in Figure 6.3.
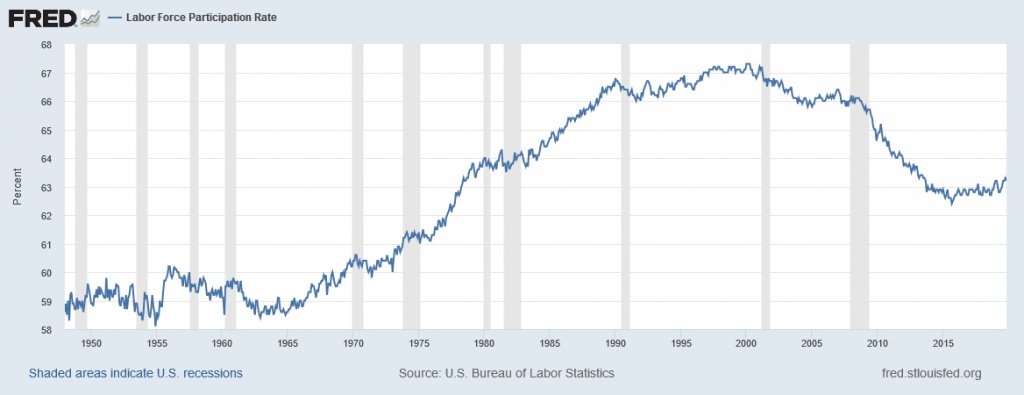
We see that the labor force participation rose from the 1960’s until it peaked in the mid-1990’s. Since the early 2000’s it has fallen. The increase in the labor force participation rate was caused by women joining the labor force. This is discussed in the following section. The decline has been caused by the retirement of the baby boomers; that is, those born from 1946-1964 after the end of World War II.
Unemployment and Labor Force Participation by Gender
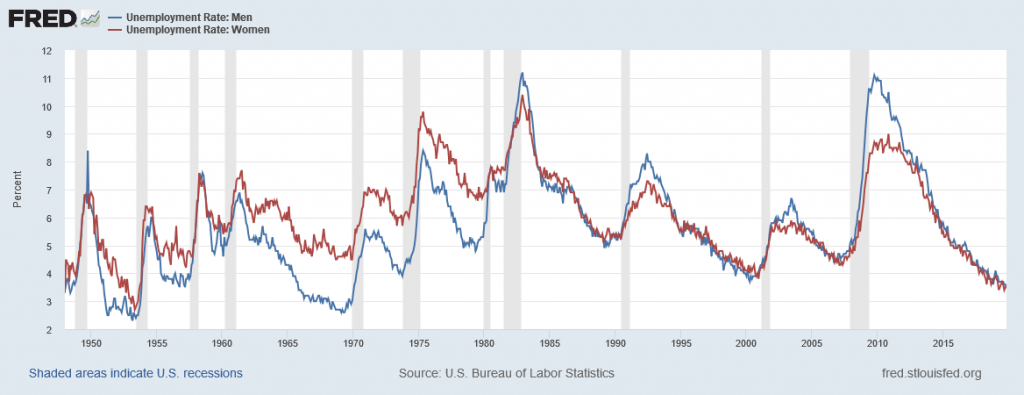
The unemployment rate for women had historically tended to be higher than the unemployment rate for men, perhaps reflecting the historical pattern that women were seen as “secondary” earners. By about 1980, however, the unemployment rate for women was essentially the same as that for men, as Figure 6.4 shows. During the 2008-2009 recession and in the immediate aftermath, the unemployment rate for men exceeded the unemployment rate for women. Subsequently, however, the gap has narrowed.
From: https://en.wikipedia.org/wiki/Labor_force_in_the_United_States
The labor force participation rate for men and women is shown below in Figure 6.5
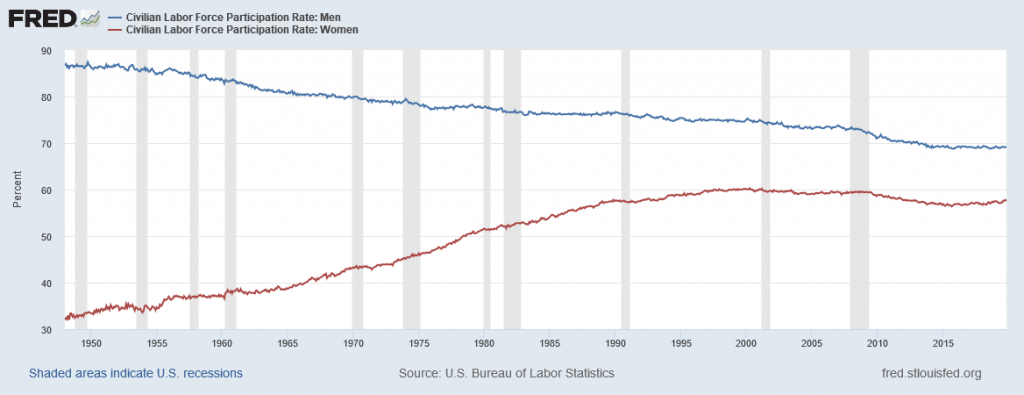
In the United States, there were three significant stages of women’s increased participation in the labor force. During the late 19th century through the 1920s, very few women worked. Working women were often young single women who typically withdrew from labor force at marriage unless their family needed two incomes. These women worked primarily in the textile manufacturing industry or as domestic workers. This profession empowered women and allowed them to earn a living wage. At times, they were a financial help to their families.
Between 1930 and 1950, female labor force participation increased primarily due to the increased demand for office workers, women participating in the high school movement, and electrification which reduced the time spent on household chores. In the 1950s to the 1970s, most women were secondary earners working mainly as secretaries, teachers, nurses, and librarians (pink-collar jobs).
Claudia Goldin and others, specifically point out that by the mid-1970s there was a period of revolution of women in the labor force brought on by different factors. Women more accurately planned for their future in the work force, choosing more applicable majors in college that prepared them to enter and compete in the labor market. In the United States, the labor force participation rate rose from approximately 59% in 1948 to 66% in 2005,[4] with participation among women rising from 32% to 59%[5] and participation among men declining from 87% to 73%.[6][7]
A common theory in modern economics claims that the rise of women participating in the US labor force in the late 1960s was due to the introduction of a new contraceptive technology, birth control pills, and the adjustment of age of majority laws. The use of birth control gave women the flexibility of opting to invest and advance their career while maintaining a relationship. By having control over the timing of their fertility, they were not running a risk of thwarting their career choices. However, only 40% of the population actually used the birth control pill. This implies that other factors may have contributed to women choosing to invest in advancing their careers.
Another factor that may have contributed to the trend was the Equal Pay Act of 1963, which aimed at abolishing wage disparity based on sex. Such legislation diminished sexual discrimination and encouraged more women to enter the labor market by receiving fair remuneration to help raise children.
Men’s labor force participation has been falling consistently since at least the 1960s.[11] This applies to both the overall and prime working age (25-54), as discussed below.
From 1962 to 1999, women entering the U.S. workforce represented a nearly 8 percentage point increase in the overall LFPR.[13] The U.S. overall LFPR (age 16+) has been falling since its all-time high point of 67.3% reached in January–April 2000, reaching 62.7% by January 2018.[14] This decline since 2000 is primarily driven by the retirement of the Baby Boom generation. Since the overall labor force is defined as those age 16+, an aging society with more persons past the typical prime working age (25-54) exerts a steady downward influence on the LFPR. The decline was forecast by economists and demographers going back into the 1990s, if not earlier. For example, during 1999 the BLS forecast that the overall LFPR would be 66.9% in 2015 and 63.2% in 2025.[15] A 2006 forecast by Federal Reserve economists (i.e., before the Great Recession that began in December 2007) estimated the LFPR would be below 64% by 2016, close to the 62.7% average that year.[16]
Unemployment by Race
Unemployment broken down by race is shown below in Figure 6.6.
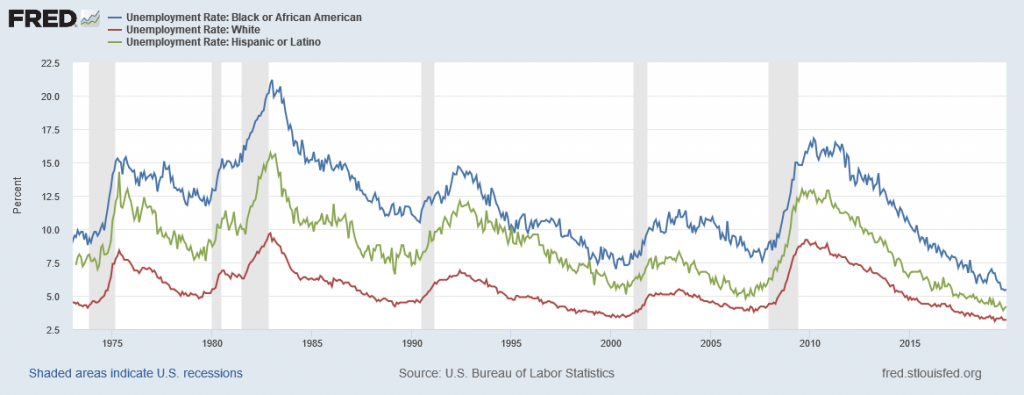
The unemployment rate for African-Americans is substantially higher than the rate for other racial or ethnic groups, a fact that surely reflects, to some extent, a pattern of discrimination that has constrained blacks’ labor market opportunities. However, the gaps between unemployment rates for whites and for blacks and Hispanics diminished in the 1990s, as Figure 6.6 shows. In fact, unemployment rates for blacks and Hispanics were at the lowest levels for several decades in the mid-2000s before rising during the recent Great Recession.
Finally, those with less education typically suffer higher unemployment. In January 2017, for example, the unemployment rate for those with a college degree was 2.5%; for those with some college but not a four year degree, the unemployment rate was 3.8%; for high school graduates with no additional degree, the unemployment rate was 5.3%; and for those without a high school diploma, the unemployment rate was 7.7%. This pattern arises because additional education typically offers better connections to the labor market and higher demand. With less attractive labor market opportunities for low-skilled workers compared to the opportunities for the more highly-skilled, including lower pay, low-skilled workers may be less motivated to find jobs.
Unemployment by Age
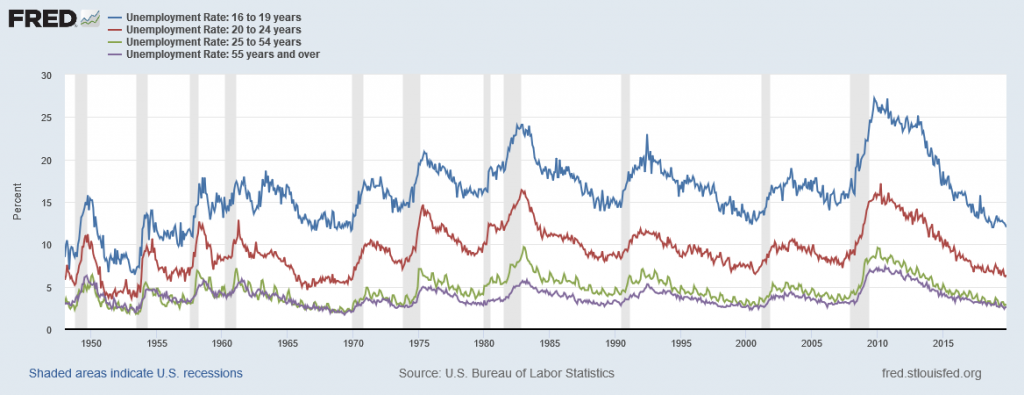
Younger workers tend to have higher unemployment, while middle-aged workers tend to have lower unemployment, probably because the middle-aged workers feel the responsibility of needing to have a job more heavily. Younger workers move in and out of jobs more than middle-aged workers, as part of the process of matching of workers and jobs, and this contributes to their higher unemployment rates. In addition, middle-aged workers are more likely to feel the responsibility of needing to have a job more heavily. Elderly workers have extremely low rates of unemployment, because those who do not have jobs often exit the labor force by retiring, and thus are not counted in the unemployment statistics. Figure 6.7 shows unemployment rates divided by age.
Reason for Unemployment
The Bureau of Labor Statistics also gives information about the reasons for unemployment, as well as the length of time individuals have been unemployed. Table 6.2, for example, shows the four reasons for unemployment and the percentages of the currently unemployed that fall into each category.
| Group | Number of People (thousands) | Percentage |
| New Entrants | 586 | 10.0 |
| Re-entrants | 1,664 | 28.5 |
| Job Leavers | 777 | 13.3 |
| Job Losers: Temporary | 756 | 13.0 |
| Job Losers: Non-Temporary | 2,051 | 35.2 |
Unemployment by Length of Unemployment
Not all unemployment is the same. For some people, they move from one job to the next in a short period of time. For others, a job may be difficult to find and they may stay unemployed for a longer period of time. This is shown below in Table 6.3.
| Length of Unemployment |
Number of People (millions) | Percentage |
| Less than 5 weeks | 2.0 | 33.9 |
| 5 to 14 weeks | 1.8 | 30.5 |
| 15 to 26 weeks | 0.9 | 15.3 |
| More than 26 weeks | 1.2 | 20.3 |
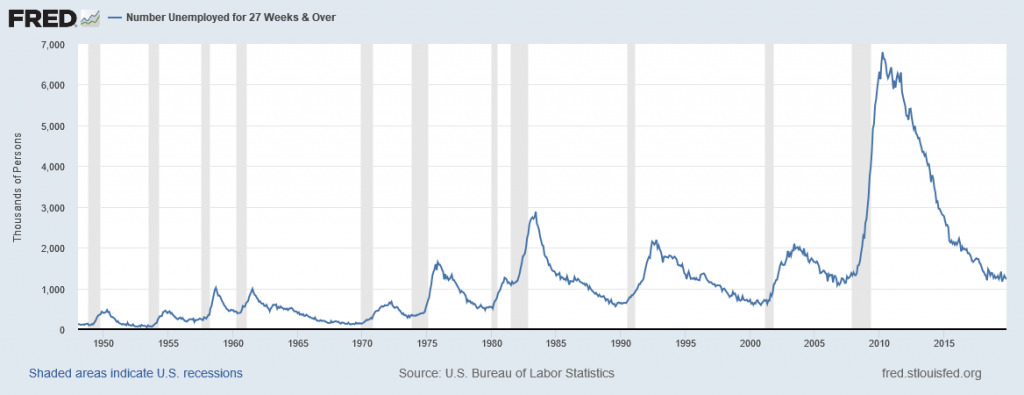
Long-term unemployment is generally not a problem, but it does become an issue during recessions. The long-term unemployment rate historically is shown in Figure 6.8.
Unemployment Around the World
Table 6.4 lists the unemployment rate for various countries using 2017 data as it is the most recent year freely-accessible data is available.
| Country | Unemployment Rate |
| Japan | 2.9 |
| Mexico | 3.4 |
| Germany | 3.8 |
| China | 3.9 |
| United States | 4.4 |
| United Kingdom | 4.4 |
| Russia | 5.2 |
| Canada | 6.3 |
| South Africa | 27.5 |
6.3 What causes unemployment?
Cyclical Unemployment
From: OpenStax Macroeconomics (http://cnx.org/content/col12190/1.4), Chapter 8.1
Let’s make the plausible assumption that in the short run, from a few months to a few years, the quantity of hours that the average person is willing to work for a given wage does not change much, so the labor supply curve does not shift much. In addition, make the standard ceteris paribus assumption that there is no substantial short-term change in the age structure of the labor force, institutions and laws affecting the labor market, or other possibly relevant factors.
One primary determinant of the demand for labor from firms is how they perceive the state of the macro economy. If firms believe that business is expanding, then at any given wage they will desire to hire a greater quantity of labor, and the labor demand curve shifts to the right. Conversely, if firms perceive that the economy is slowing down or entering a recession, then they will wish to hire a lower quantity of labor at any given wage, and the labor demand curve will shift to the left. Economists call the variation in unemployment that the economy causes moving from expansion to recession or from recession to expansion (i.e. the business cycle) cyclical unemployment.
Frictional Unemployment
In a market economy, some companies are always going broke for a variety of reasons: old technology; poor management; good management that happened to make bad decisions; shifts in tastes of consumers so that less of the firm’s product is desired; a large customer who went broke; or tough domestic or foreign competitors. Conversely, other companies will be doing very well for just the opposite reasons and looking to hire more employees. In a perfect world, all of those who lost jobs would immediately find new ones. However, in the real world, even if the number of job seekers is equal to the number of job vacancies, it takes time to find out about new jobs, to interview and figure out if the new job is a good match, or perhaps to sell a house and buy another in proximity to a new job. Economists call the unemployment that occurs in the meantime, as workers move between jobs, frictional unemployment. Frictional unemployment is not inherently a bad thing. It takes time on part of both the employer and the individual to match those looking for employment with the correct job openings. For individuals and companies to be successful and productive, you want people to find the job for which they are best suited, not just the first job offered.
In the mid-2000s, before the 2008–2009 recession, it was true that about 7% of U.S. workers saw their jobs disappear in any three-month period. However, in periods of economic growth, these destroyed jobs are counterbalanced for the economy as a whole by a larger number of jobs created. In 2005, for example, there were typically about 7.5 million unemployed people at any given time in the U.S. economy. Even though about two-thirds of those unemployed people found a job in 14 weeks or fewer, the unemployment rate did not change much during the year, because those who found new jobs were largely offset by others who lost jobs.
Of course, it would be preferable if people who were losing jobs could immediately and easily move into newly created jobs, but in the real world, that is not possible. Someone who is laid off by a textile mill in South Carolina cannot turn around and immediately start working for a textile mill in California. Instead, the adjustment process happens in ripples. Some people find new jobs near their old ones, while others find that they must move to new locations. Some people can do a very similar job with a different company, while others must start new career paths. Some people may be near retirement and decide to look only for part-time work, while others want an employer that offers a long-term career path. The frictional unemployment that results from people moving between jobs in a dynamic economy may account for one to two percentage points of total unemployment.
The level of frictional unemployment will depend on how easy it is for workers to learn about alternative jobs, which may reflect the ease of communications about job prospects in the economy. The extent of frictional unemployment will also depend to some extent on how willing people are to move to new areas to find jobs—which in turn may depend on history and culture.
Frictional unemployment and the natural rate of unemployment also seem to depend on the age distribution of the population. Figure 6.7 showed that unemployment rates are typically lower for people between 25–54 years of age or aged 55 and over than they are for those who are younger. “Prime-age workers,” as those in the 25–54 age bracket are sometimes called, are typically at a place in their lives when they want to have a job and income arriving at all times. In addition, older workers who lose jobs may prefer to opt for retirement. By contrast, it is likely that a relatively high proportion of those who are under 25 will be trying out jobs and life options, and this leads to greater job mobility and hence higher frictional unemployment. Thus, a society with a relatively high proportion of young workers, like the U.S. beginning in the mid-1960s when Baby Boomers began entering the labor market, will tend to have a higher unemployment rate than a society with a higher proportion of its workers in older ages.
Structural Unemployment
Another factor that influences the natural rate of unemployment is the amount of structural unemployment. The structurally unemployed are individuals who have no jobs because they lack skills valued by the labor market, either because demand has shifted away from the skills they do have, or because they never learned any skills. An example of the former would be the unemployment among aerospace engineers after the U.S. space program downsized in the 1970s. An example of the latter would be high school dropouts.
Some people worry that technology causes structural unemployment. In the past, new technologies have put lower skilled employees out of work, but at the same time they create demand for higher skilled workers to use the new technologies. Education seems to be the key in minimizing the amount of structural unemployment. Individuals who have degrees can be retrained if they become structurally unemployed. For people with no skills and little education, that option is more limited.
Seasonal Unemployment
From: https://en.wikipedia.org/wiki/Unemployment
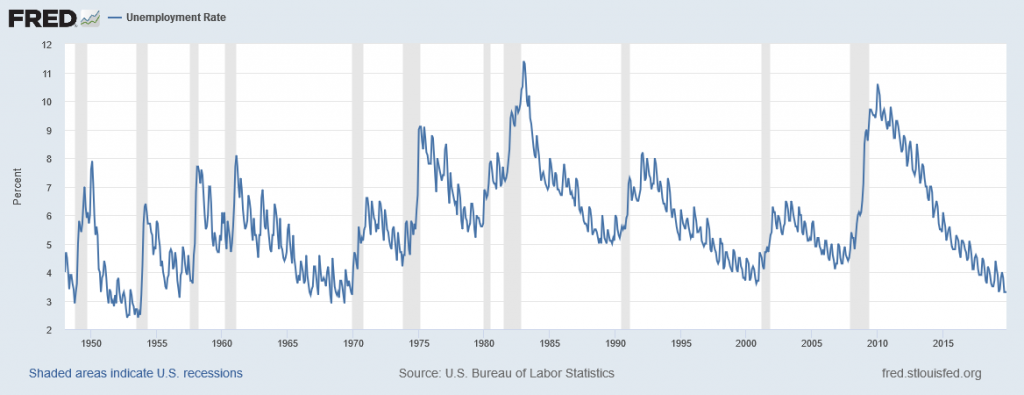
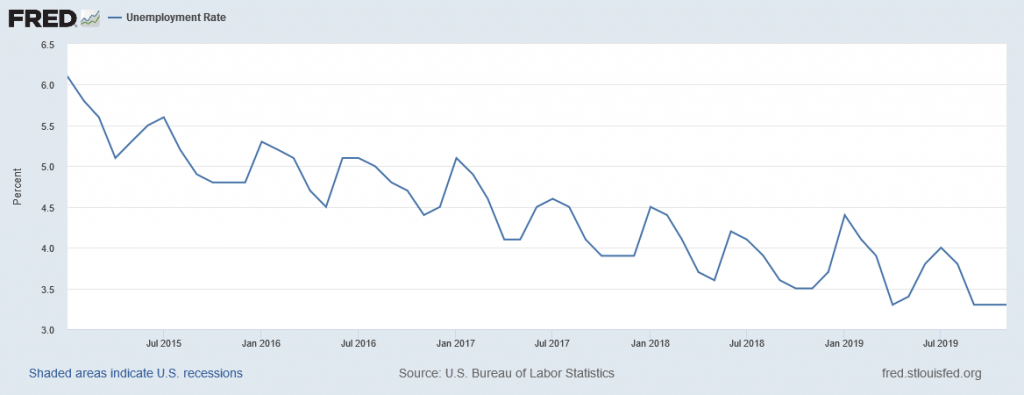
Seasonal unemployment may be seen as a kind of structural unemployment, since it is a type of unemployment that is linked to certain kinds of jobs (construction work, migratory farm work). The most-cited official unemployment measures erase this kind of unemployment from the statistics using “seasonal adjustment” techniques. This results in substantial, permanent structural unemployment. Figure 6.9 shows the unemployment rate that is not seasonally adjusted. All of the previous unemployment graphs used have been “seasonally adjusted” which means that the seasonal unemployment has been “removed.” Figure 6.9 is much more “spikey” since these trends have not been smoothed. Figure 6.10 shows the non-seasonally adjusted unemployment rate since 2015 which allows you to see the seasonality a bit better.
The Natural Rate of Unemployment
The natural rate of unemployment is not “natural” in the sense that water freezes at 32 degrees Fahrenheit or boils at 212 degrees Fahrenheit. It is not a physical and unchanging law of nature. Instead, it is only the “natural” rate because it is the unemployment rate that would result from the combination of economic, social, and political factors that exist at a time—assuming the economy was neither booming nor in recession. These forces include the usual pattern of companies expanding and contracting their workforces in a dynamic economy, social and economic forces that affect the labor market, or public policies that affect either the eagerness of people to work or the willingness of businesses to hire. Let’s discuss these factors in more detail.
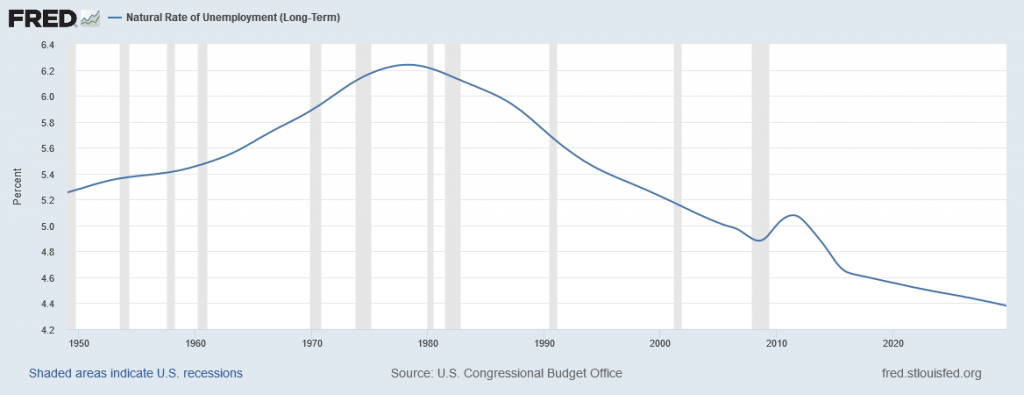
The natural unemployment rate is related to two other important concepts: full employment and potential real GDP. Economists consider the economy to be at full employment when the actual unemployment rate is equal to the natural unemployment rate. When the economy is at full employment, real GDP is equal to potential real GDP. By contrast, when the economy is below full employment, the unemployment rate is greater than the natural unemployment rate and real GDP is less than potential. Finally, when the economy is above full employment, then the unemployment rate is less than the natural unemployment rate and real GDP is greater than potential. Operating above potential is only possible for a short while, since it is analogous to all workers working overtime. Figure 6.11 shows the natural rate of unemployment in the United States.
The underlying economic, social, and political factors that determine the natural rate of unemployment can change over time, which means that the natural rate of unemployment can change over time, too.
Estimates by economists of the natural rate of unemployment in the U.S. economy in the early 2000s run at about 4.5 to 5.5%. This is a lower estimate than earlier. We outline three of the common reasons that economists propose for this change below.
- The internet has provided a remarkable new tool through which job seekers can find out about jobs at different companies and can make contact with relative ease. An internet search is far easier than trying to find a list of local employers and then hunting up phone numbers for all of their human resources departments, and requesting a list of jobs and application forms. Social networking sites such as LinkedIn have changed how people find work as well.
- The growth of the temporary worker industry has probably helped to reduce the natural rate of unemployment. In the early 1980s, only about 0.5% of all workers held jobs through temp agencies. By the early 2000s, the figure had risen above 2%. Temp agencies can provide jobs for workers while they are looking for permanent work. They can also serve as a clearinghouse, helping workers find out about jobs with certain employers and getting a tryout with the employer. For many workers, a temp job is a stepping-stone to a permanent job that they might not have heard about or obtained any other way, so the growth of temp jobs will also tend to reduce frictional unemployment.
- The aging of the “baby boom generation”—the especially large generation of Americans born between 1946 and 1964—meant that the proportion of young workers in the economy was relatively high in the 1970s, as the boomers entered the labor market, but is relatively low today. As we noted earlier, middle-aged and older workers are far more likely to experience low unemployment than younger workers, a factor that tends to reduce the natural rate of unemployment as the baby boomers age.
The combined result of these factors is that the natural rate of unemployment was on average lower in the 1990s and the early 2000s than in the 1980s. The 2008–2009 Great Recession pushed monthly unemployment rates up to 10% in late 2009. However, even at that time, the Congressional Budget Office was forecasting that by 2015, unemployment rates would fall back to about 5%. During the last four months of 2015 the unemployment rate held steady at 5.0%. Throughout 2016 and up through January 2017, the unemployment rate has remained at or slightly below 5%. As of the fourth quarter of 2019, the Congressional Budget Office estimates the natural rate to be 4.56%, and the measured unemployment rate for November 2019 is 3.5%.
By the standards of other high-income economies, the natural rate of unemployment in the U.S. economy appears relatively low. Through good economic years and bad, many European economies have had unemployment rates hovering near 10%, or even higher, since the 1970s. European rates of unemployment have been higher not because recessions in Europe have been deeper, but rather because the conditions underlying supply and demand for labor have been different in Europe, in a way that has created a much higher natural rate of unemployment.
Many European countries have a combination of generous welfare and unemployment benefits, together with nests of rules that impose additional costs on businesses when they hire. In addition, many countries have laws that require firms to give workers months of notice before laying them off and to provide substantial severance or retraining packages after laying them off. The legally required notice before laying off a worker can be more than three months in Spain, Germany, Denmark, and Belgium, and the legally required severance package can be as high as a year’s salary or more in Austria, Spain, Portugal, Italy, and Greece. Such laws will surely discourage laying off or firing current workers. However, when companies know that it will be difficult to fire or lay off workers, they also become hesitant about hiring in the first place.
We can attribute the typically higher levels of unemployment in many European countries in recent years, which have prevailed even when economies are growing at a solid pace, to the fact that the sorts of laws and regulations that lead to a high natural rate of unemployment are much more prevalent in Europe than in the United States.

