Business Intelligence – Continued

Business Intelligence Basics

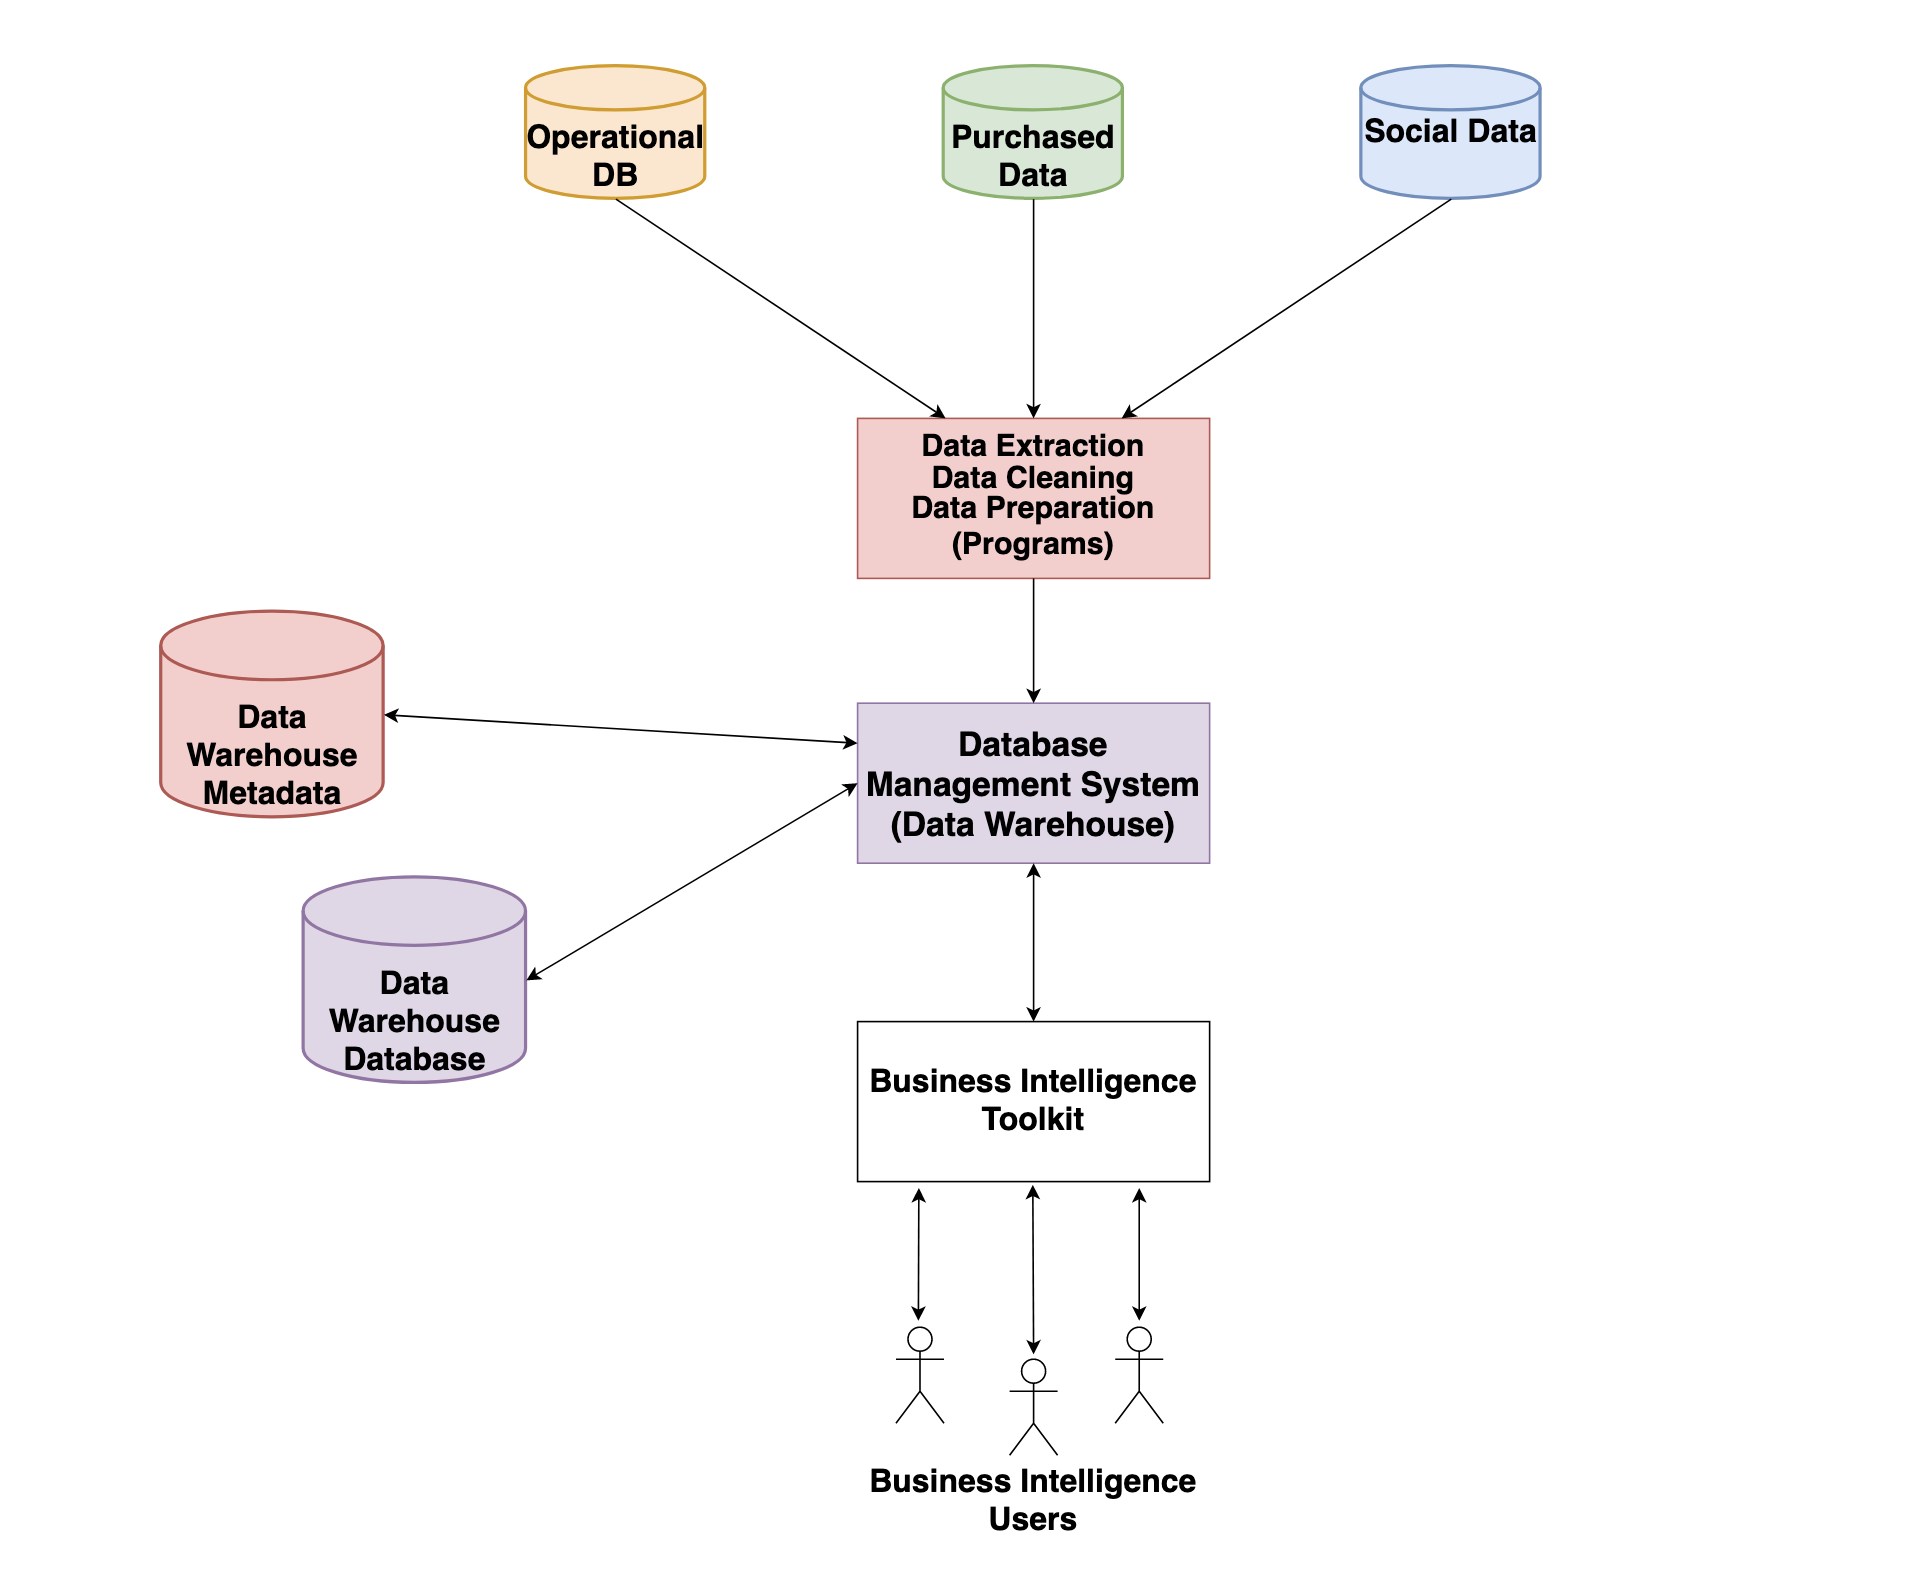
Data Acquisition – Obtaining, Cleansing, organizing, relating


Analytics – Converting data to information reporting, data mining and Big Data


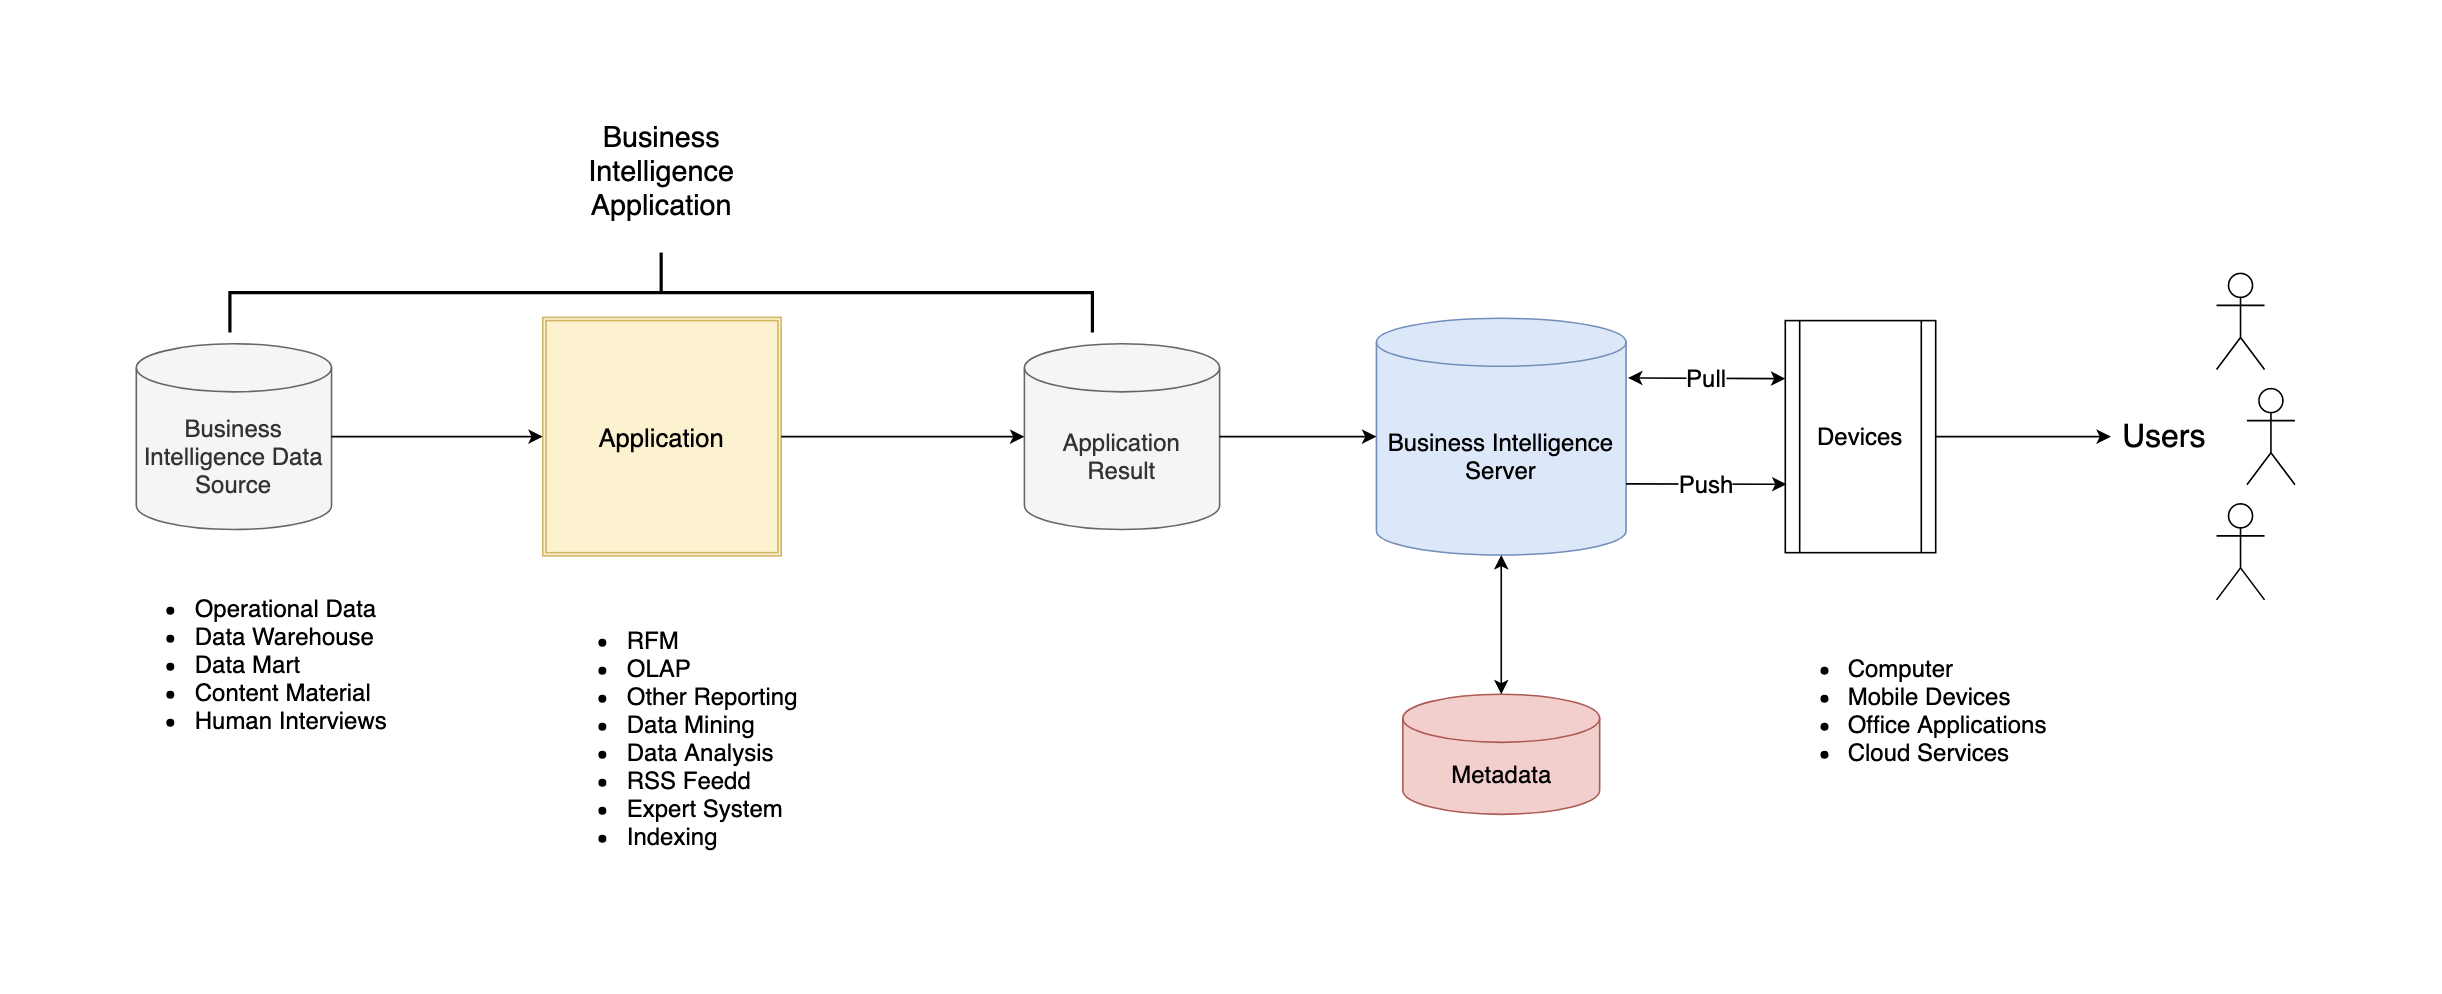
Publish – Delivery – Push, Pull


Data sources flow to - acquire data (obtain, organize and relate, cleanse, and catalog). Acquire data flows to data analysis (big data, data mining). Data analysis flows to publish result (printing, web servers, report servers, automation). publish results flow to and from knowledge workers as pushes and pulls. Published results also flows and loops back to the starting - data sources.

Data Marts

Sales Order, Customer, Product, Inventory, Manufacturing, AR, AP, Budgets, Human Resources, flow to - Extract, transform, load, which then flows to the following data marts: CRM, Orders, Inventory, Human Resources. These data marts then flow to - Analytics Engine, which then flows to - publish to users.

Operational, purchased, and social data flow into the data extraction programs. From there the data extracted goes to the database management system, or the data warehouse. From the data ware house data flows to and from the data warehouse database, and metadata. Data also flows to and from the business intelligence tool kit to thhe database management system. From the business intelligence toolkit that data in applications translate to the business intelligence users.


data from the data producers flow to the data warehouse, which has meta data that flows to and from the database to the database management system for the data warehouse. From the data warehouse data flows to the web sales data mart (business intelligence toolkit for web click stream analysis) which is pushed to website pages design features. Also from the data warehouse, data flows to the store sales data mart (business intelligence toolkit for store management) which then translates to market-basket analysis for sales training. The last data mart that flows from the data warehouse is the inventory sales data mart (business intelligence toolkit for inventory management) which translates to inventory layouts for optimal item picking.

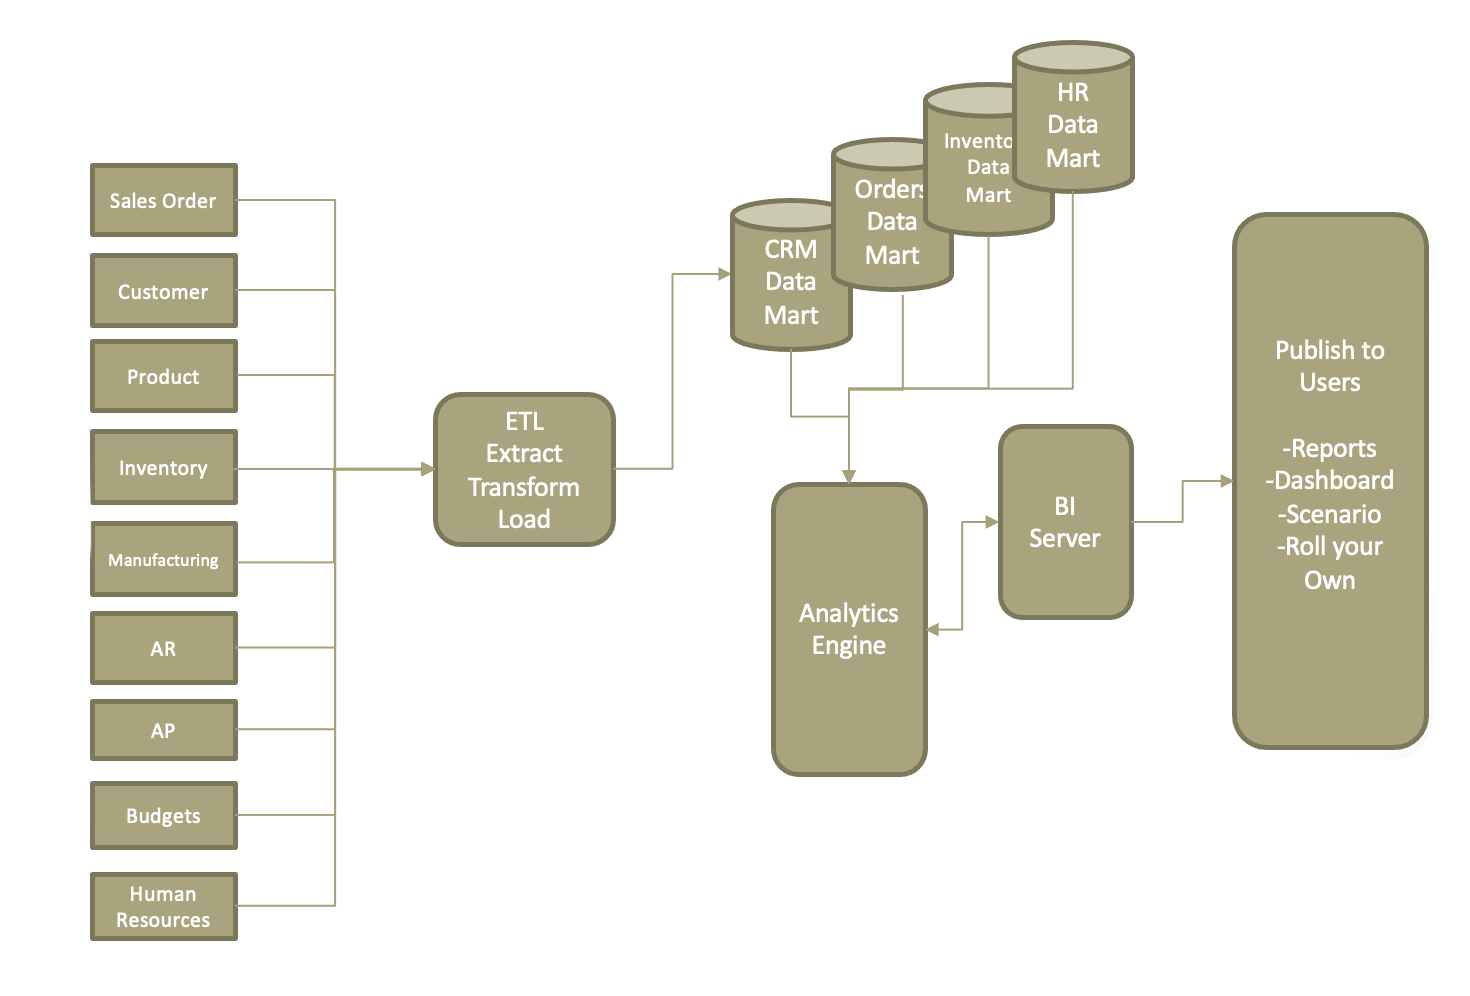
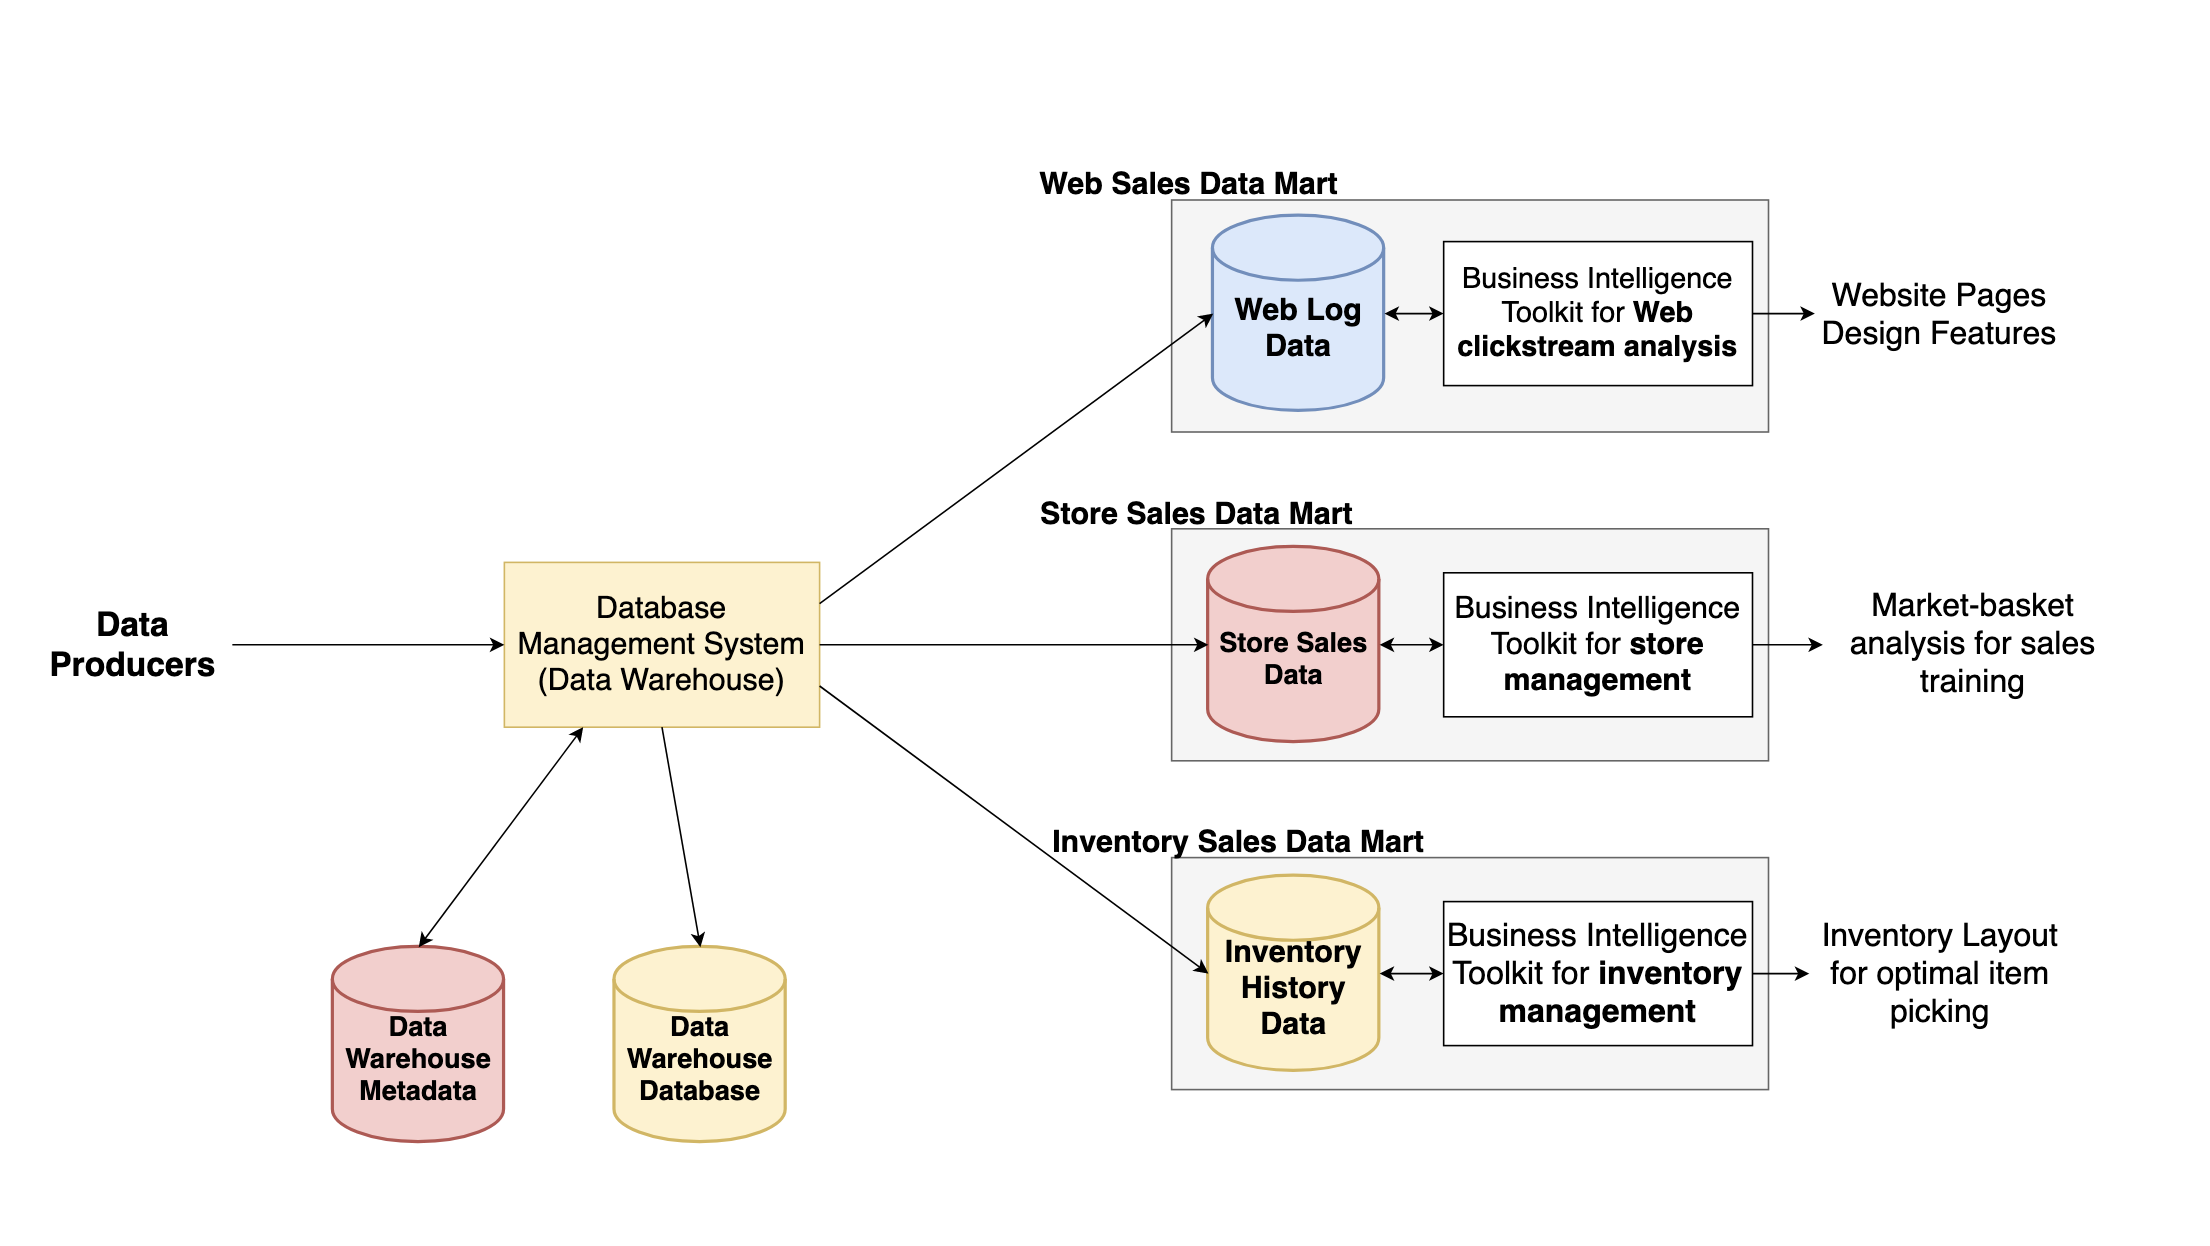
Processing Business Intelligence Data

Reporting

  • Create information about past performance
  • Static, usually, can create on request

Data Mining

  • Classify
  • Predictive
  • Support Hunches

Data Mining

  • Discover Patterns and Relationships
  • From Enormous  amounts of Data (eg. Sensor, Social Media)


Reporting

  • Sort
  • Group
  • Sum
  • Average
  • Filter
  • Format
  • Structured Data – Rows and Columns
  • Relational or Spreadsheet
  • Exception Reports
  • Conditional Formatting
  • Can be Dynamic (created at request time)


Data Mining

  • Apply Statistical Analysis to find patterns and relationships
  • Statistics, mathematics, AI, machine learning – combined
  • Standard Deviation, Area Under the curve, Coefficient of Correlation
  • Unsupervised
    • Apply technique and observer results
    • Identify groups of entities that have similar characteristics
    • Eg. Cluster Analysis
    • Looking for the pattern
  • Supervised
    • Start with a model or pattern
    • Use statistics to estimate parameters
    • Predictive

Marketing Experts believe Cell phone usage on weekends is a factor of age of the customer and the number of months the customer has had the phone.


Run analysis – Sample Result:

CellPhoneWeekendMinutes – 12+(17.5 x customer age)+(23.7 x NumberMonthsAccount)


  • Data Brokers, Data Aggregators
  • Sammy, Nielsen, Majors – Scanner Data
  • Affinity Cards
  • Diapers and Beer
  • AT&T example?
  • Cause and Effect  Which first?


Publish to the Right User at the Right time

Static – Fixed

Dynamic – Updating

Push vs Pull


Business intelligence data source data flows to the application and the application produces results, all of those three components (BI data source, application, application results) are part of the business intelligence application. thhe business intelligence server receives the application results and stores that metadata for later reference, and pushes and pulls the data to any device, that then in turn reach the user.


Dynamic reports are BI documents that are updated at the time they are requested. A sales report that is current as of the time the user accessed it on a web server is a dynamic report. In almost all cases, publishing a dynamic report requires the BI application to access a ddatabase or other data source at the time the report is delivered to the user.

A table showing BI publishing alternatives with information on the server, report type, push options, and the skill level needed for each.
Server Report Type Push Options Skill Requirement
Email or collaboration tool Static Manual Low
Web Server Static Dynamic Alert/RSS Low for static, High for dynamic
SharePoint Static Dynamic Alert/RSS Low for static, High for dynamic
BI Server Dynamic Alert/RSS Subscription High
  • Volume
  • Velocity (rapid)
  • Variety
  • Petabyte?
    • PB = 1024 Terabytes = 1024×1024 gigabytes
  • Changing rapidly – Google Searches in a day
  • Structured + Free Form Text + BLOB+ Log Files + etc.

Search logs reduced to log segments, then map phases, then the reduction phase of all searched items.


Screen shot of the claims star information architecture.MapReduce Result

License

Icon for the Creative Commons Attribution-NonCommercial-ShareAlike 4.0 International License

Information and Organizations (IST 301) Copyright © by Bill Meyerowitz is licensed under a Creative Commons Attribution-NonCommercial-ShareAlike 4.0 International License, except where otherwise noted.

Share This Book