Enterprise Structures
Information System
In the last chapter we defined a 5 component model for Information Systems including;
Hardware, Software, People, Procedures, Data
The following cartoon while amusing tells us a little about the cultures of some organizations you may be familiar with.
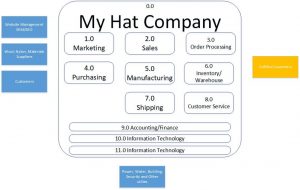
Enterprise – What is it made up of?
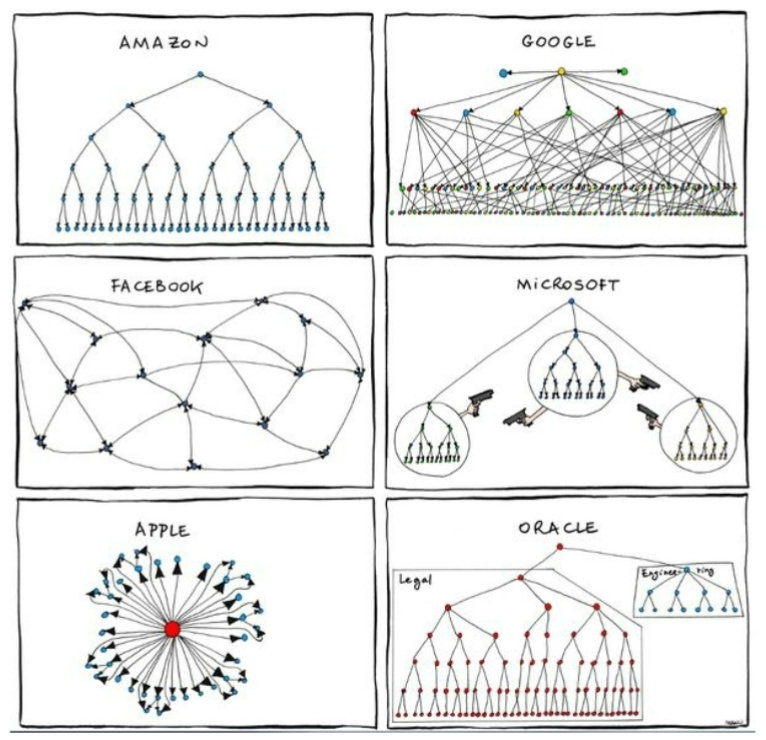
Manu Cornet, CC BY-SA 3.0, via Wikimedia Commons
The Amazon diagram shows a more format hierarchy with traditional span of control and reporting along traditional departmental lines.
Google shows what looks like a traditional structure at the top with what looks like to be connections between the management and all employees below the top level. Multiple lines of communication with communication not following a structure.
Facebook looks like a smaller number of managers and lower level employees each reporting to a few. Sort of like Google but less confusing.
Microsoft shows autonomous departments each with a hierarchy pointing guns at each other. Microsoft has in the past tasked multiple teams with the same problem/issue to solve selecting the best one, making it competitive between the teams (the guns.)
Apple shows a fat circle with communications to all emanating out from the center person. This is supposed to represent how Steve Jobs liked to work, apparently overriding all formal lines of communication.
Oracle is shown with a small engineering department and a large legal department. Referring to their tendency to purchase technology and their litigious approach to the marketplace.
While somewhat tongue in cheek the cartoon does indicate that operations at each of these would be quite different. This is an example of how organizational culture would shape communications and operations. And for our purposes the way data is captured and organized would follow. Questions like who owns the data and which is the official record of source for any data item.
Other factors to consider as we look at how organizations work and how they collect data and use information.
Source System of Record
As an example lets think about sales? In a mid to large organization, data identified as sales may reside in the CRM (Customer Relationship Management), Order Processing, Financial, or Warehouse systems as shipments.
And the data might be different. What was shipped might not be exactly what was ordered? Stock outs backorders etc. Finance will have the revenue transactions? so how do we report on sales? Which is the true number?
What we need is a source of truth or a SSOR. According tour handy Wikipedia: “A system of record (SOR) or source system of record (SSoR) is a data management term for an information storage system (commonly implemented on a computer system running a database management system) that is the authoritative data source for a given data element or piece of information.”
So we might say that when we talk about Sales $ we are interested in sales revenue which we define as what is recognized in the General Ledger or Financial Systems. If we are interested in Sales units we might look at the order processing system which should hold a collection of sales orders. If we want to know what are popular items for our largest customers, we might look at CRM possibly with Sales Order data.
Organizations that have sophisticated data practices may have defined a data dictionary which would hold information identifying SSOR for us along with how it is stored how often it is updated etc.
Transaction Volume
The are other factors besides culture that define how and when data is stored and used and therefore available to become information. one that is certainly relevant is Transaction Volume. How many sales do I have in a time period and how much information do I keep about each.
If I am making boxes of Jell-O I may have a large plant where tens of thousands of boxes of Jell-O are produced per hour. I might keep track of information about a lot number, which may contain thousands of boxes. But even though I sell millions of boxes per month, I don’t keep mush data about each.
In contrast lets consider a large company that does tree trimming, like Asplundh. They probably have tens or thousand jobs in a year. For each they have to keep track of what work was done what the contract amount was, what crew members were involved, what equipment was used, how many days it took, how it was paid, etc. There are certainly more data items to store multiplied by the number of jobs it, could be more data than I store to make millions of boxes of Jell-O. So volume alone does not define the amount of data available nor does it define what useful information can be gleaned about products?
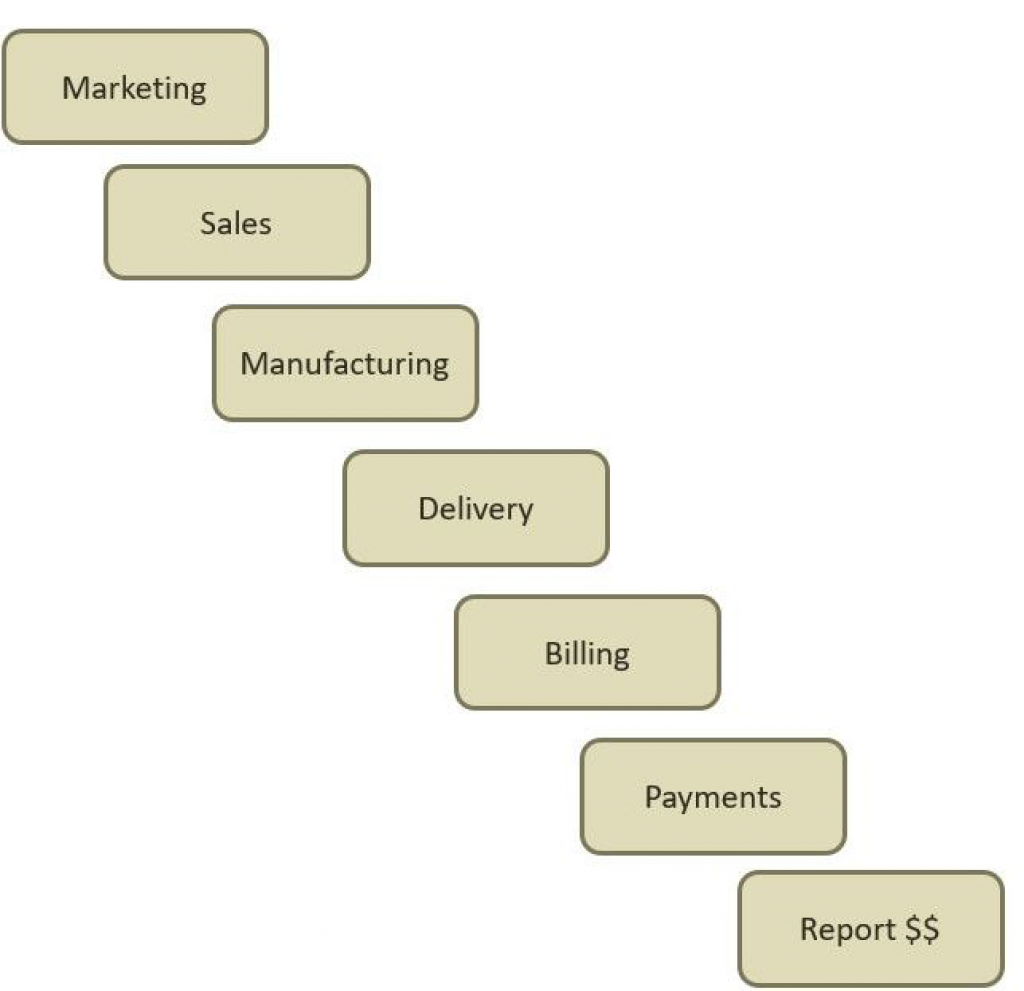
Revenue Cycle
This is really a process we can define as the steps to sell (get order), fulfill, and collect on delivery of a product or service to a customer. As we know data is collected along the way at each one of these steps. The Revenue Cycle can also be thought of in terms of elapsed time. If my product is Jell-O or athletic shoes my revenue cycle would likely be a lot shorter than if I am building in ground residential swimming pools, homes or producing movies.
Sometimes this is also referred to as order-to-cash.
What do you think the internet has done to these cycles and when is it most effective?
Customer Interactions and Relationships
- B2B Primary focus is Business to Business
- Our grocery apple supplier
- Intel
- Xerox
- We Work
- B2C Primary focus is Business to Consumer
- Nike
- Barnes and Noble
- LA Fitness
- Non profits
- Amazon ?
- Both
- Staples
- Microsoft
- Amazon?
Culture – Ingrained tied to the primary relationship. Information systems will be designed around a specific model. What systems might be different between for B2B and B2C. What did Zappos do? Warby Parker? Others?
- EDI?
- Example
- Walmart uses starting 1990- Impact supply chain.
- Example
- CRM?
- Example
- Sales Funnel
- Example
- Catalog?
- Example
- Sears
- Bookstore
- Grocery
- Others
- Example
Some terms.
Lets take a Deeper Look
A business analyst (BA) is someone who analyzes an organization or business domain (real or hypothetical) and documents its business or processes or systems, assessing the business model or its integration with technology. Business Analyst helps in guiding businesses in improving processes, products, services and software through data analysis.
- The BA may also support the development of training material, participates in the implementation, and provides post-implementation support. This may involve the development of project plans, dataflow diagrams, and flowcharts:
- To-be processes, e.g. dataflow diagrams, flowcharts
- Data models, i.e. data requirements expressed as a documented data model of some sort
- Business case, a financial analysis containing shareholders risk and return
- Roadmap, a strategic plan
- The BA records requirements in some form of requirements management tool, whether a simple spreadsheet or a complex application. Within the systems development life cycle, the business analyst typically performs a liaison function between the business side of an enterprise and the providers of IT services.
A systems analyst is an information technology (IT) professional who specializes in analyzing, designing and implementing information systems. Systems analysts assess the suitability of information systems in terms of their intended outcomes and liaise with end users, software vendors and programmers in order to achieve these outcomes. A systems analyst is a person who uses analysis and design techniques to solve business problems using information technology. Systems analysts may serve as change agents who identify the organizational improvements needed, design systems to implement those changes, and train and motivate others to use the systems.
- Can be a bridge between the business problems and the technology solutions. Here business problems can be anything about business systems, for example the model, process, or method. The technology solutions can be the use of technology architecture, tools, or software applications. System analysts are required to analyze, transform and ultimately resolve the business problems with the help of technology.
- Some dedicated professionals possess practical knowledge in both areas (business and systems analysis) and manage to successfully combine both of these occupations, effectively blurring the line between business analyst and systems analyst.
OK let’s take a test drive!
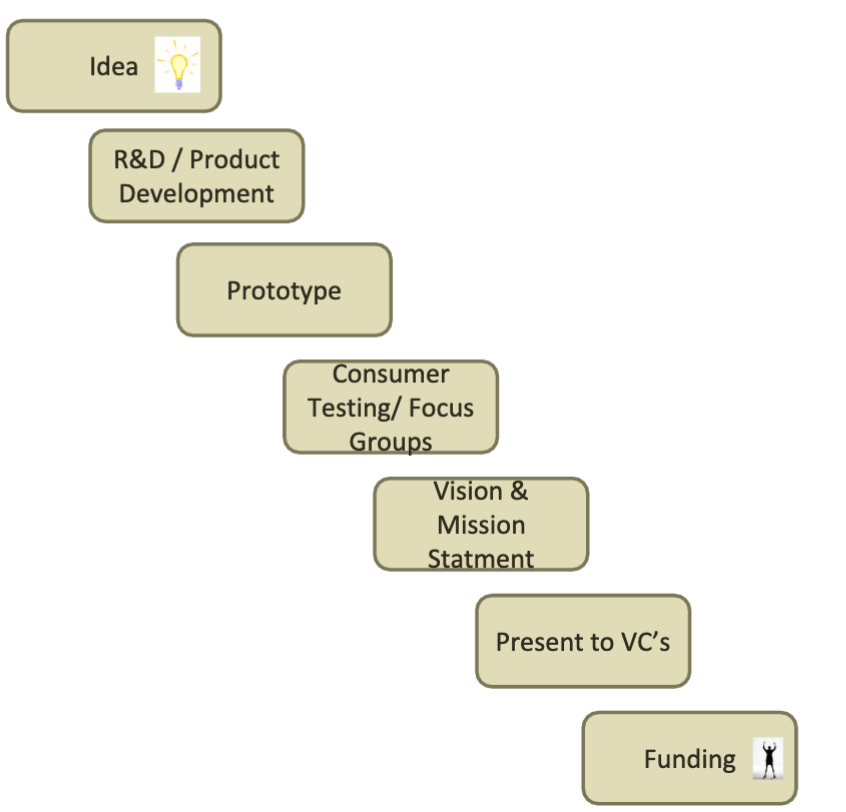
Lets think about a New Enterprise
Enterprise – Basics
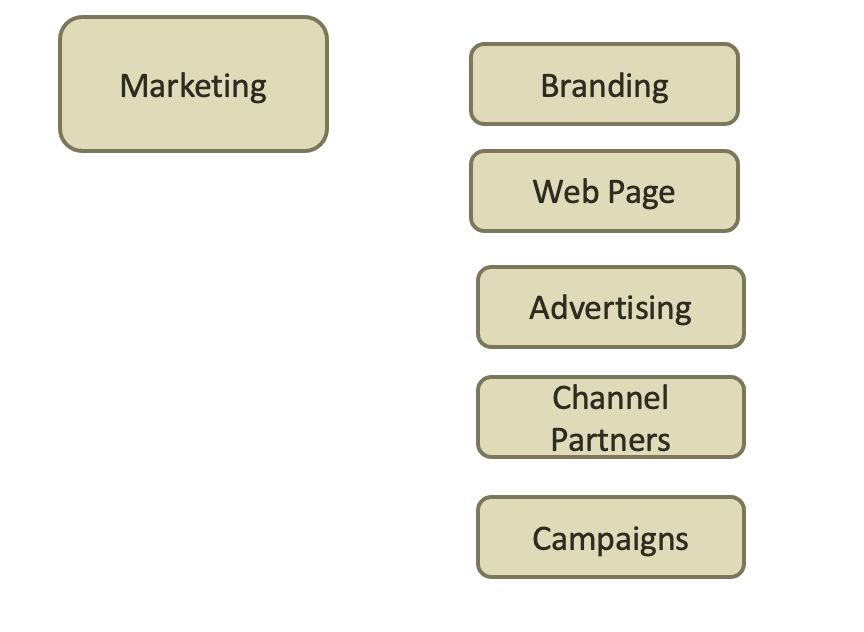
Enterprise – Marketing
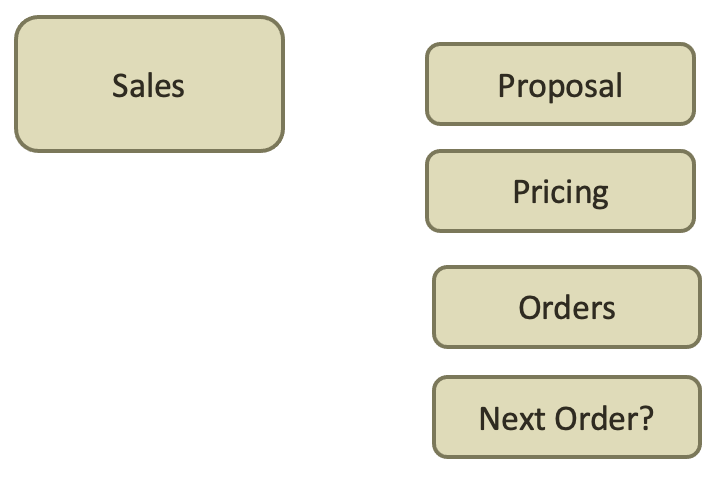
Enterprise – Sales
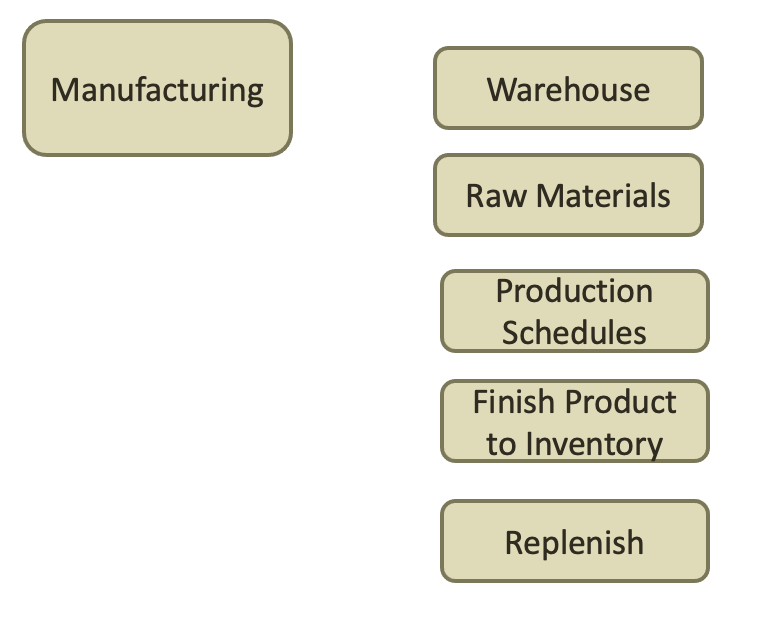
Enterprise – Manufacturing
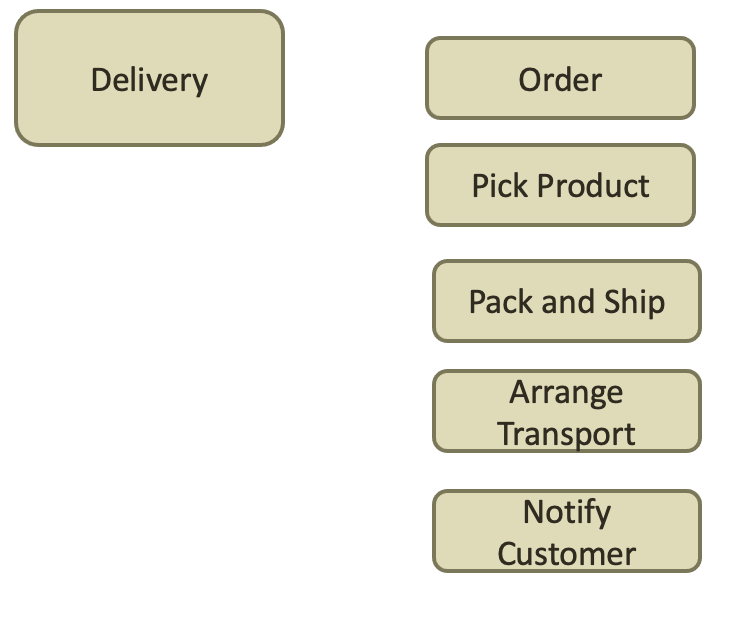
Enterprise – Delivery
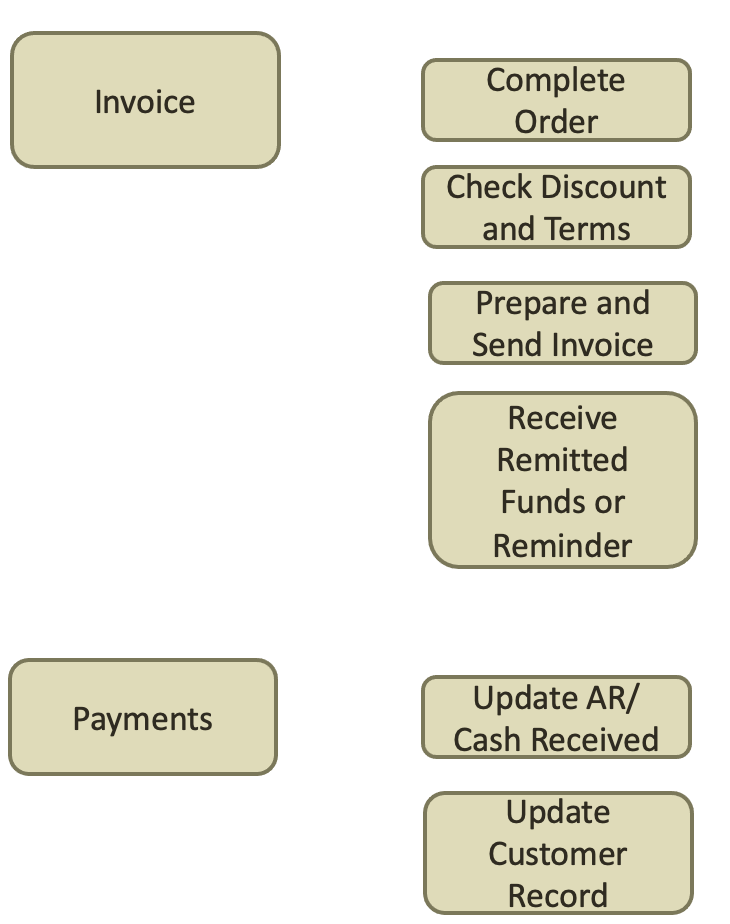
Enterprise – Invoice and Payments
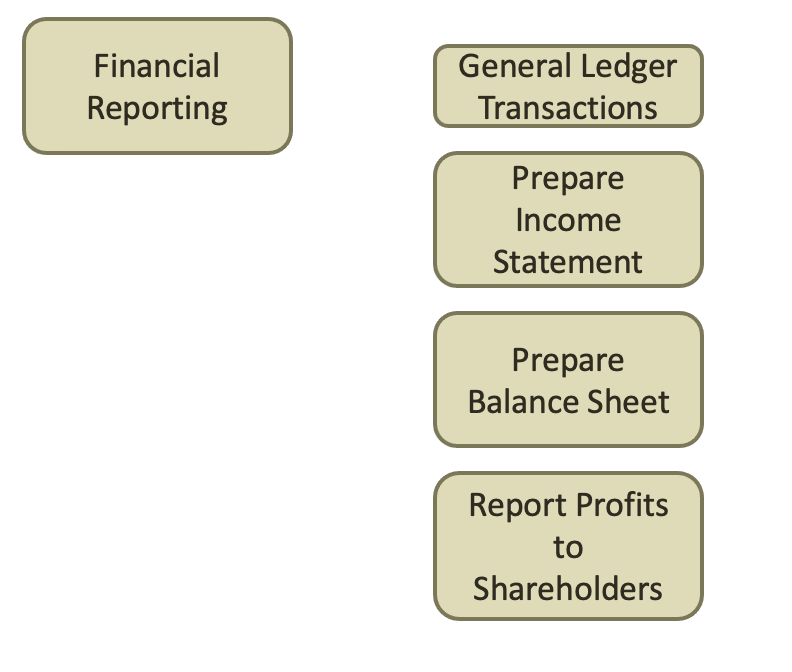
Enterprise – Financial Reporting
Context Model