
Business Intelligence
Data refers simply to raw facts and figures. Alone it tells you nothing. The real goal is to turn data into information. Data becomes information when it’s presented in a context so that it can answer a question or support decision making. And it’s when this information can be combined with a manager’s knowledge—their insight from experience and expertise—that stronger decisions can be made.
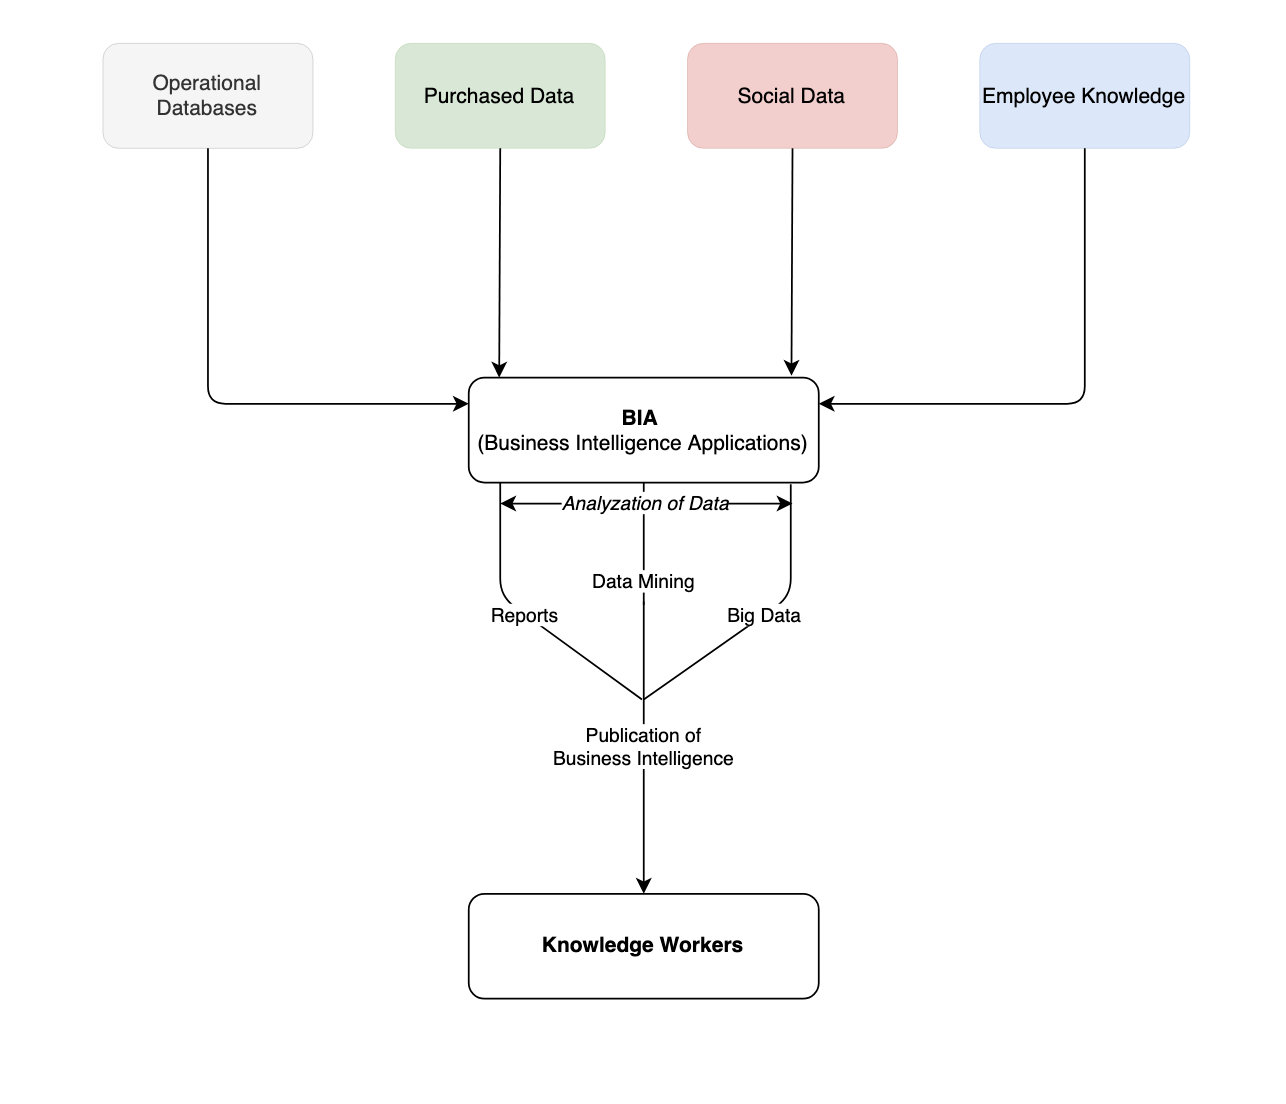
Business Intelligence Systems are information systems
(Hardware, Software, Data, Procedures, People)
That process operational data and other data to analyze past performance and to make predictions
Purchased Data, Scanner Data, Social Media, SCADA, Weather Temperature, Performance Data, Market Data, Building permits, Cell Phone Data, etc.
Business Intelligence = patterns, relationship, trends and insights exposed or identified by BI systems.
Hunch in the field, with data becomes strategic insight
How do Organizations use Business Intelligence?
Sales Vs Forecast
By Part, By Supplier, By Category
Changes in Purchasing Patterns
Scanner Data, Target?
Consumer Preferences for investment
Netflix, Amazon
- Expose Patterns
- Purchasing (people who bought what you’re buying also bought…
- Diapers and Beer
- Target – Lotions and vitamins = pregnant?
- Materials usage/Supply chain – efficiencies, early buys
- WalMart buying patterns and data reduce warehouses and push cost onto suppliers.
- AMAZON, Netflix producing shows?
- Buyers are Liars?
- Purchasing (people who bought what you’re buying also bought…
- Monitor, exception reporting
- Gunshot noise detection
- Influenza
As processing and storage continue to become cheaper we can store more events and understand more norms.
Tesco Mines Data
Tesco: Tracked Transactions, Increased Insights, and Surging Sales UK grocery giant Tesco, the planet’s third-largest retailer, is envied worldwide for what analysts say is the firm’s unrivaled ability to collect vast amounts of retail data and translate this into sales (Capell, 2008).
Tesco’s data collection relies heavily on its ClubCard loyalty program, an effort pioneered back in 1995. But Tesco isn’t just a physical retailer. As the world’s largest Internet grocer, the firm gains additional data from Web site visits, too. Remove products from your virtual shopping cart? Tesco can track this. Visited a product comparison page? Tesco watches which product you’ve chosen to go with and which you’ve passed over. Done your research online, then traveled to a store to make a purchase? Tesco sees this, too.
Tesco then mines all this data to understand how consumers respond to factors such as product mix, pricing, marketing campaigns, store layout, and Web design. Consumer-level targeting allows the firm to tailor its marketing messages to specific subgroups, promoting the right offer through the right channel at the right time and the right price. To get a sense of Tesco’s laser-focused targeting possibilities, consider that the firm sends out close to ten million different, targeted offers each quarter (Davenport & Harris, 2007). Offer redemption rates are the best in the industry, with some coupons scoring an astronomical 90 percent usage (Lowenstein, 2002)!
The firm’s data-driven management is clearly delivering results. In April 2009, while operating in the teeth of a global recession, Tesco posted record corporate profits and the highest earnings ever for a British retailer (Capell, 2009).
Brinker uses Outside Data to Correlate Results
Consider restaurant chain Brinker, a firm that runs seventeen hundred eateries in twenty-seven countries under the Chili’s, On The Border, and Maggiano’s brands. Brinker (whose ticker symbol is EAT), supplements their own data with external feeds on weather, employment statistics, gas prices, and other factors, and uses this in predictive models that help the firm in everything from determining staffing levels to switching around menu items (King, 2009).
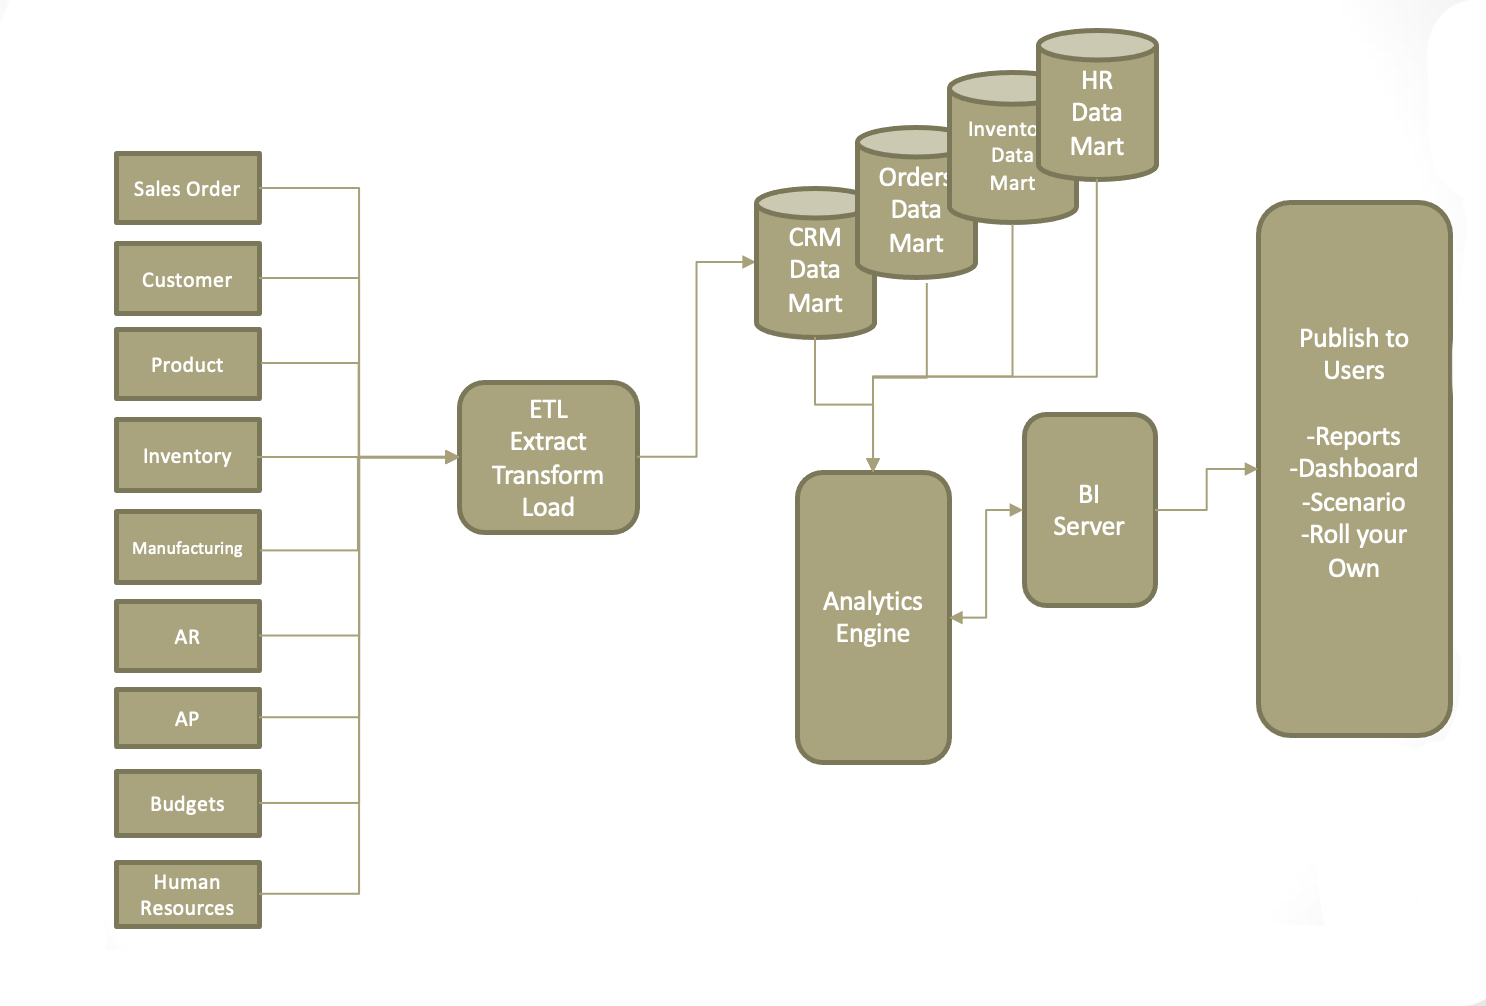
Business Intelligence Basics
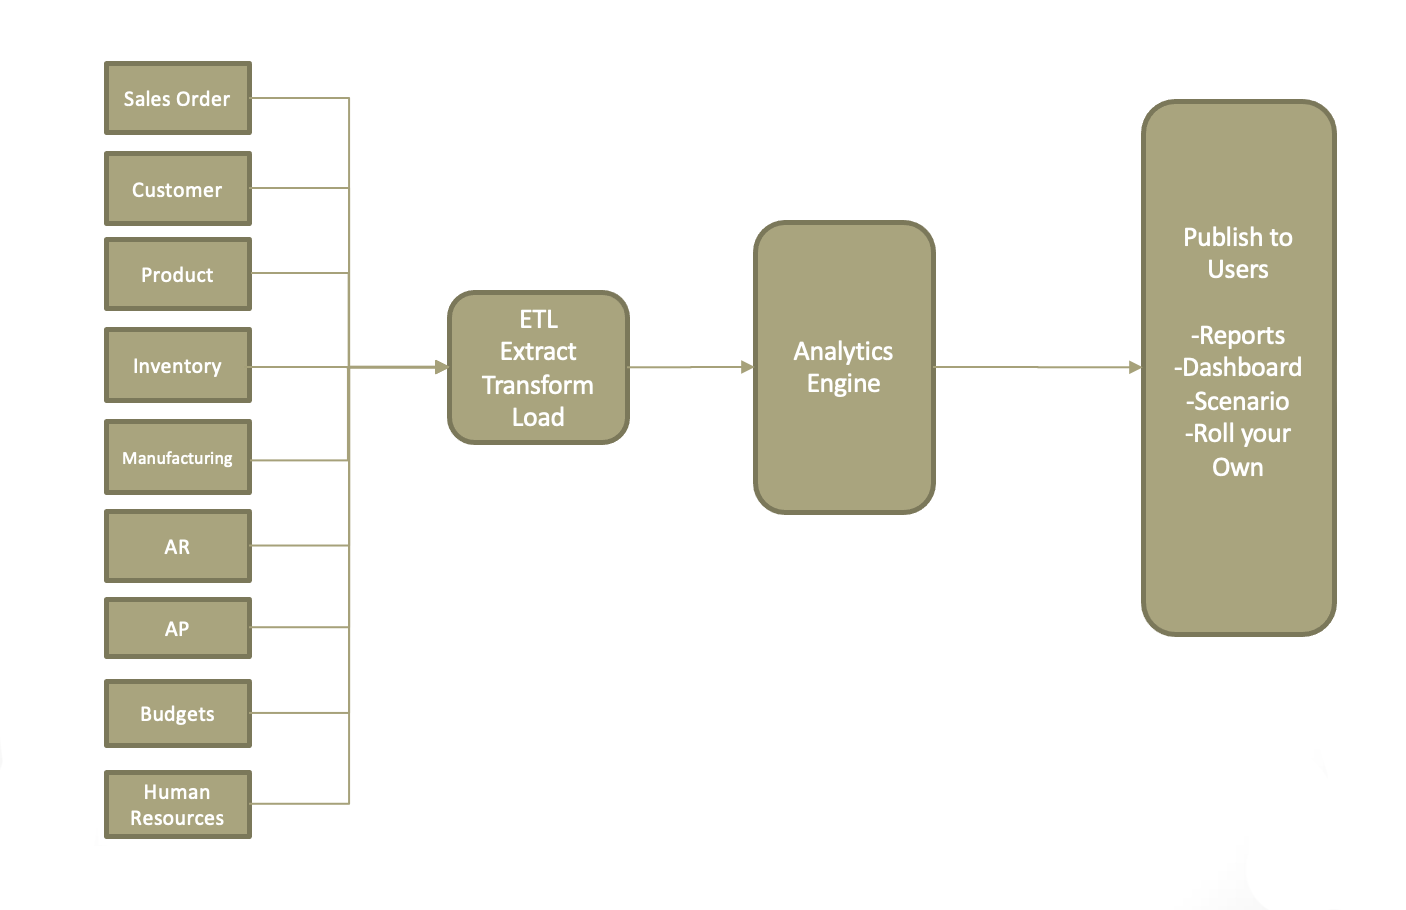
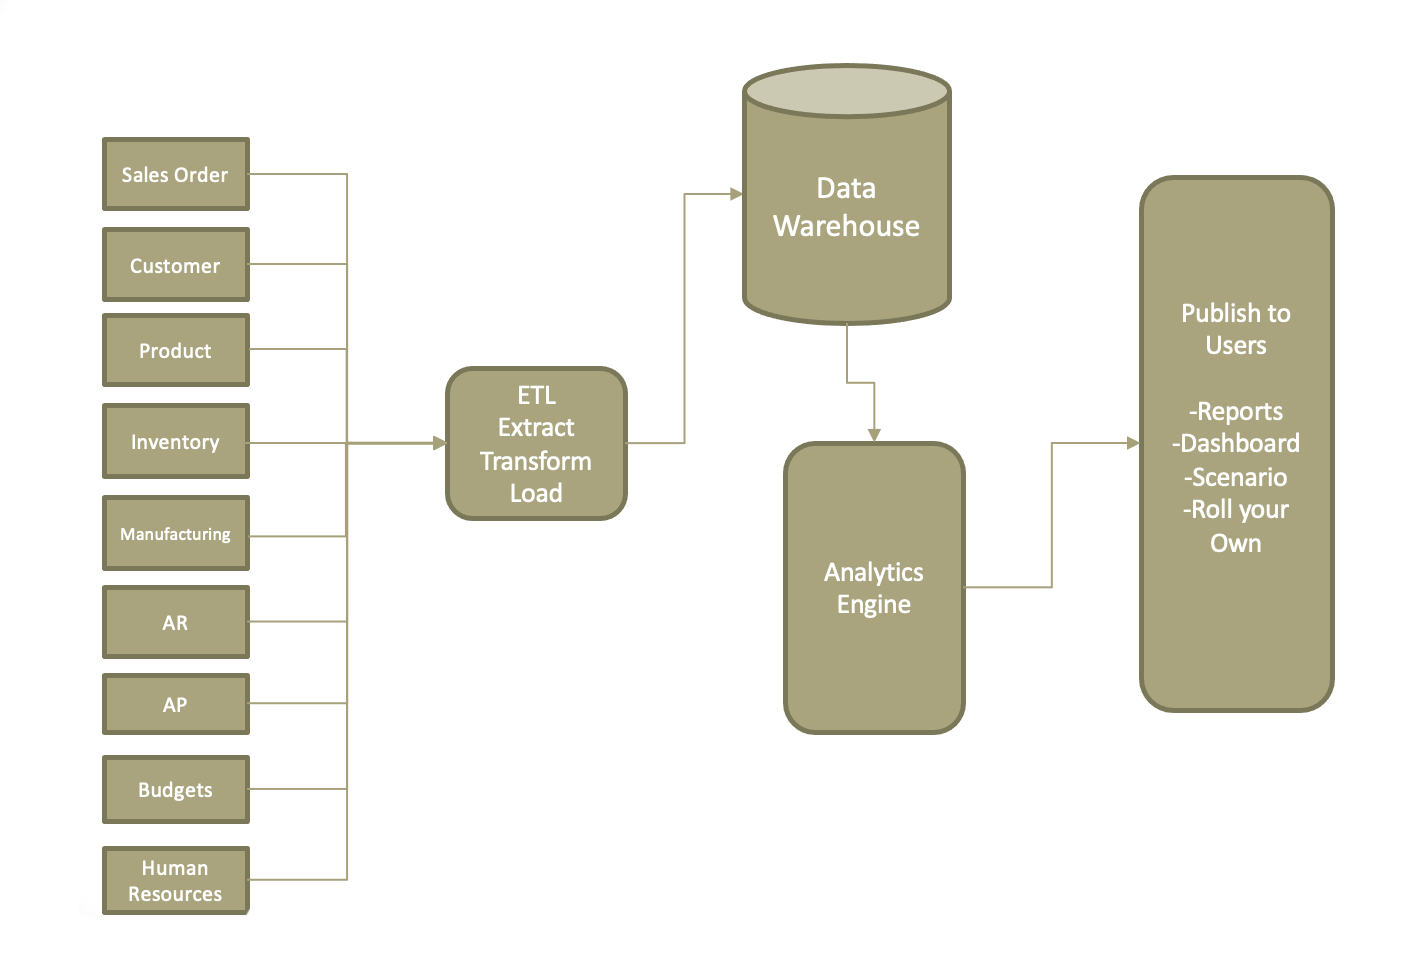
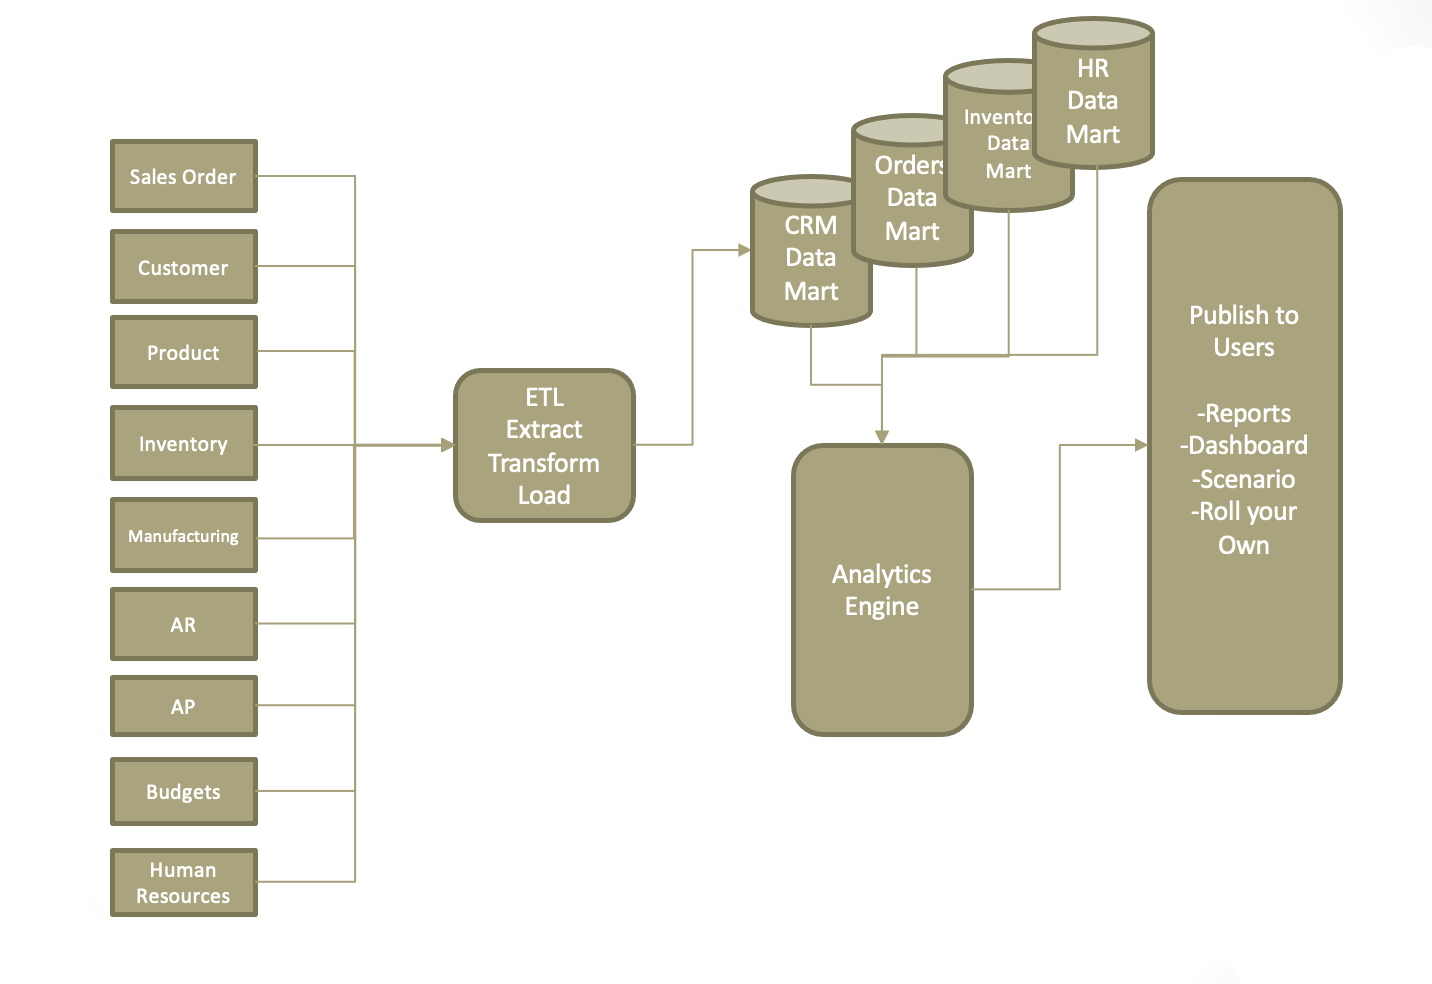
Data Acquisition – Obtaining, Cleansing, organizing, relating
Analytics – Converting data to information reporting, data mining and Big Data
Publish – Delivery – Push, Pull

| Department | Application |
|---|---|
| Sales and Marketing |
|
| Operations |
|
| Manufacturing |
|
| Customer Service |
|
| Human Resources |
|
| Accounting |
|

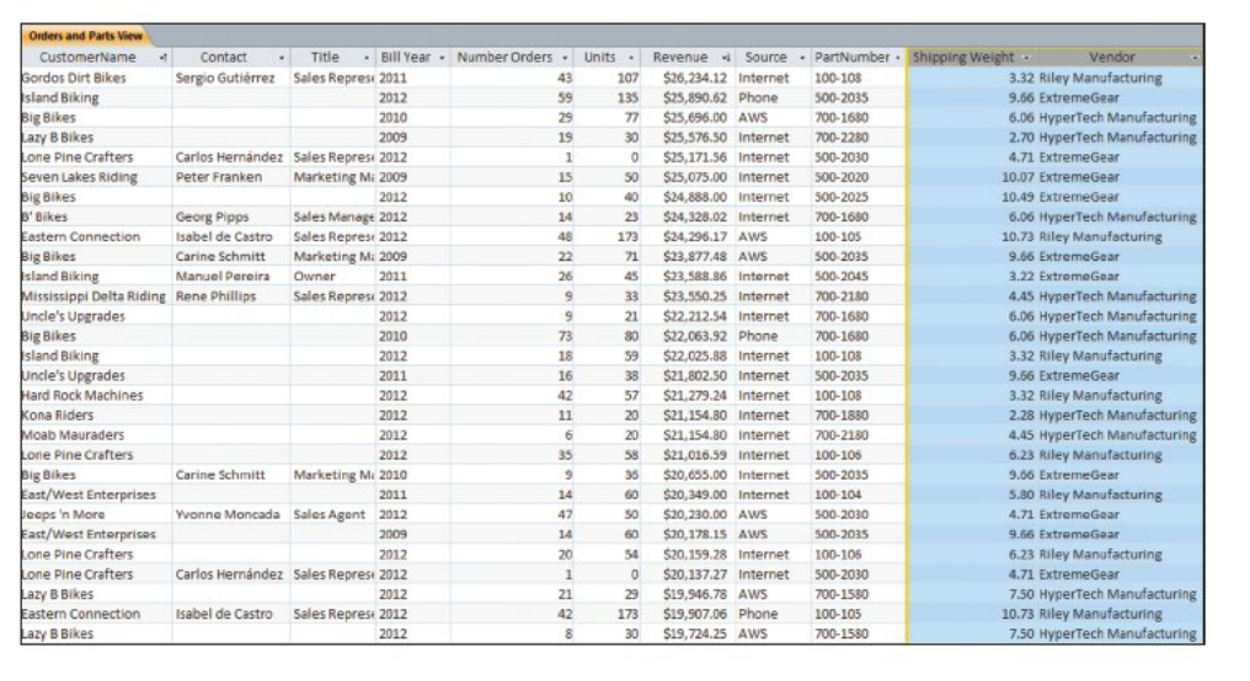
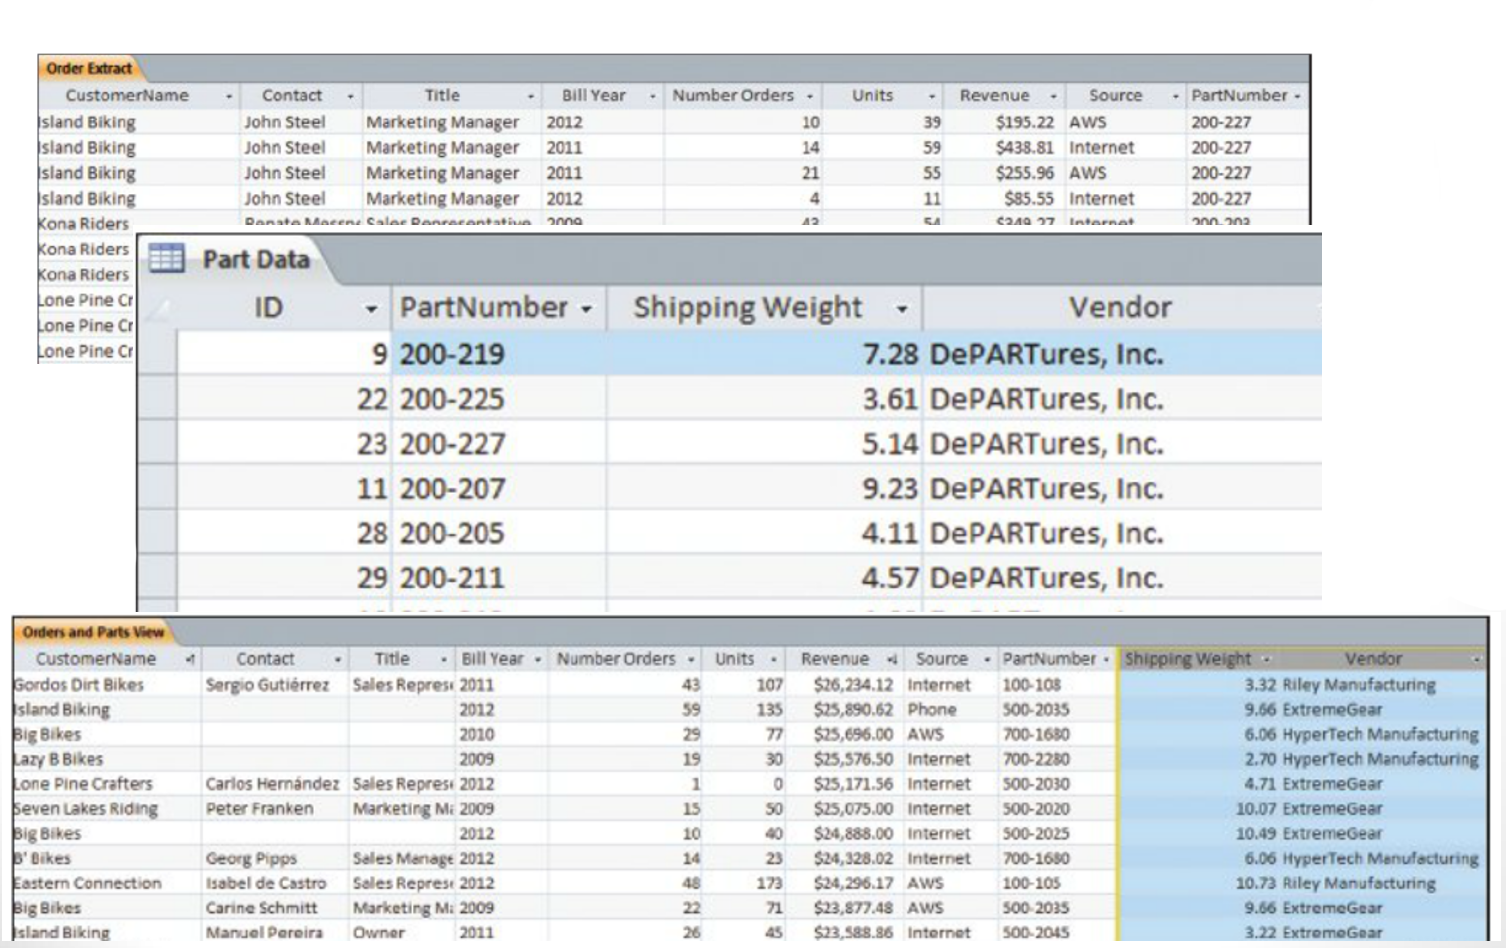
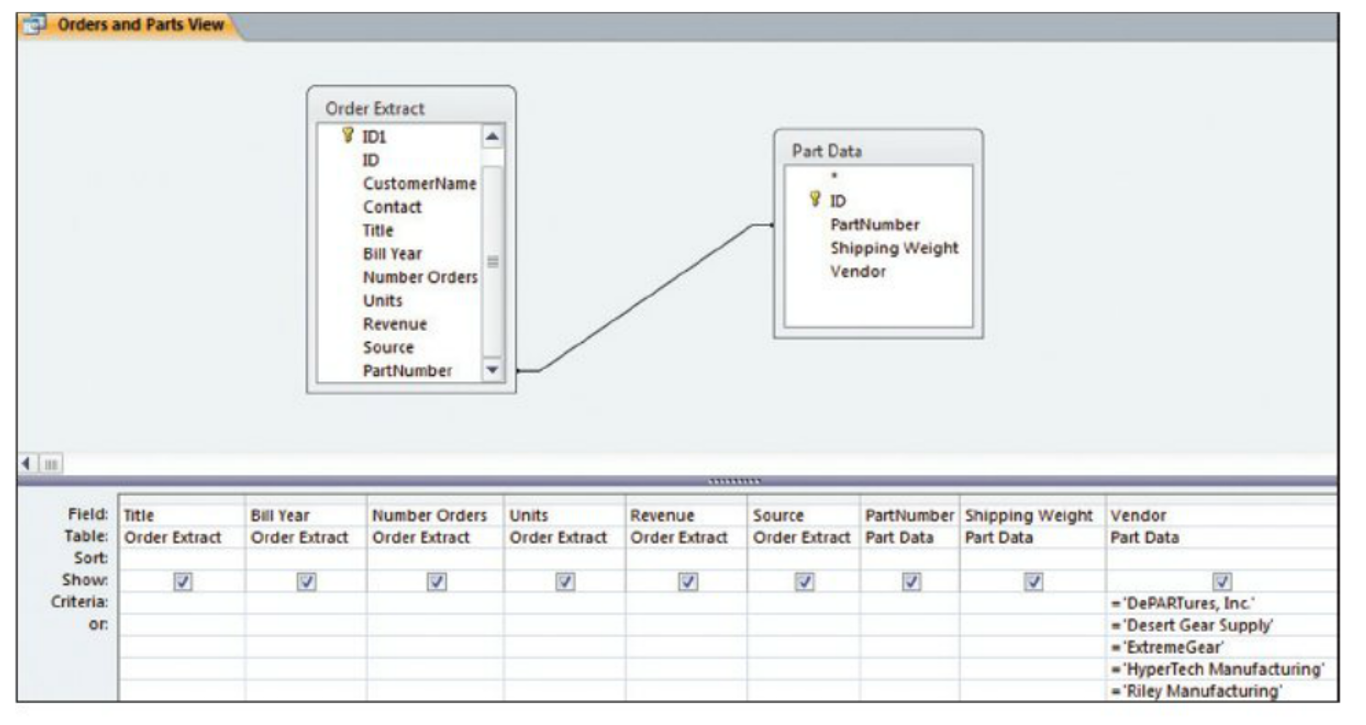
What does the Join Look Like?
Select CustomerName, Revenue, Units, Price
Into # temp1
From Order_Extract Left Outer Join Parts
On Order_Extract.partnumber = Parts.Partnumber
Inner Join
Left Outer Join
Right Outer Join
(Full) Outer Join
Cross Join
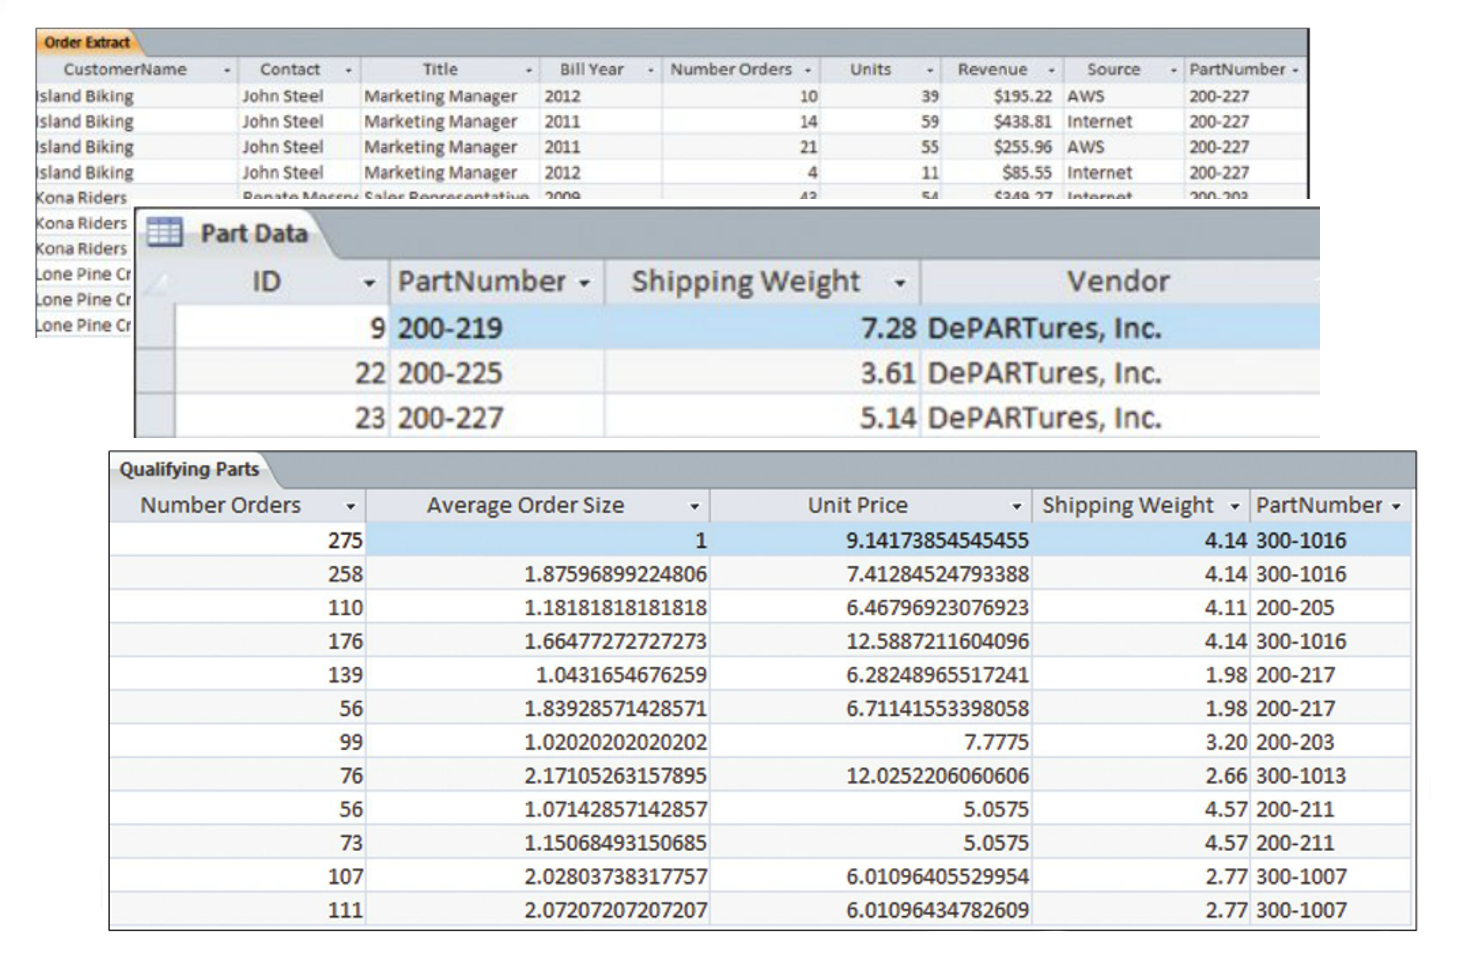
Finishing the Query?
Select PartNumber, SUM(revenue) as Sum_Rev, SUM(NumberOrders) as Sum_Orders, SUM(units) as Sum_Units,
Into #temp_summary
From Order_Extract
Group by PartNumber
Select Sum_Order, AVG_Order =Sum_Units/Sum_Orders,
Unit Price =Sum_Rev/Sum_Units,
Shipping_weight
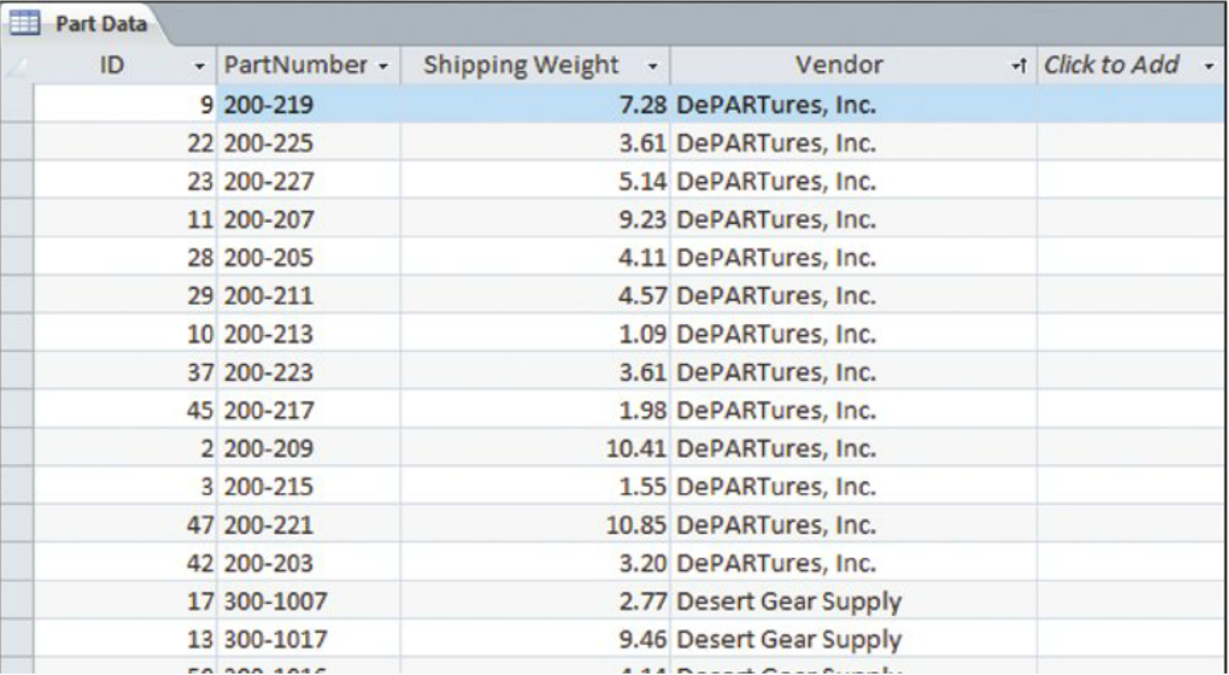
From #Temp_Summary Left Outer Join Parts_data on
#Temp_Summary.PartNumber = Parts_Data.PartNumber
Where?
Homework – AllRoads
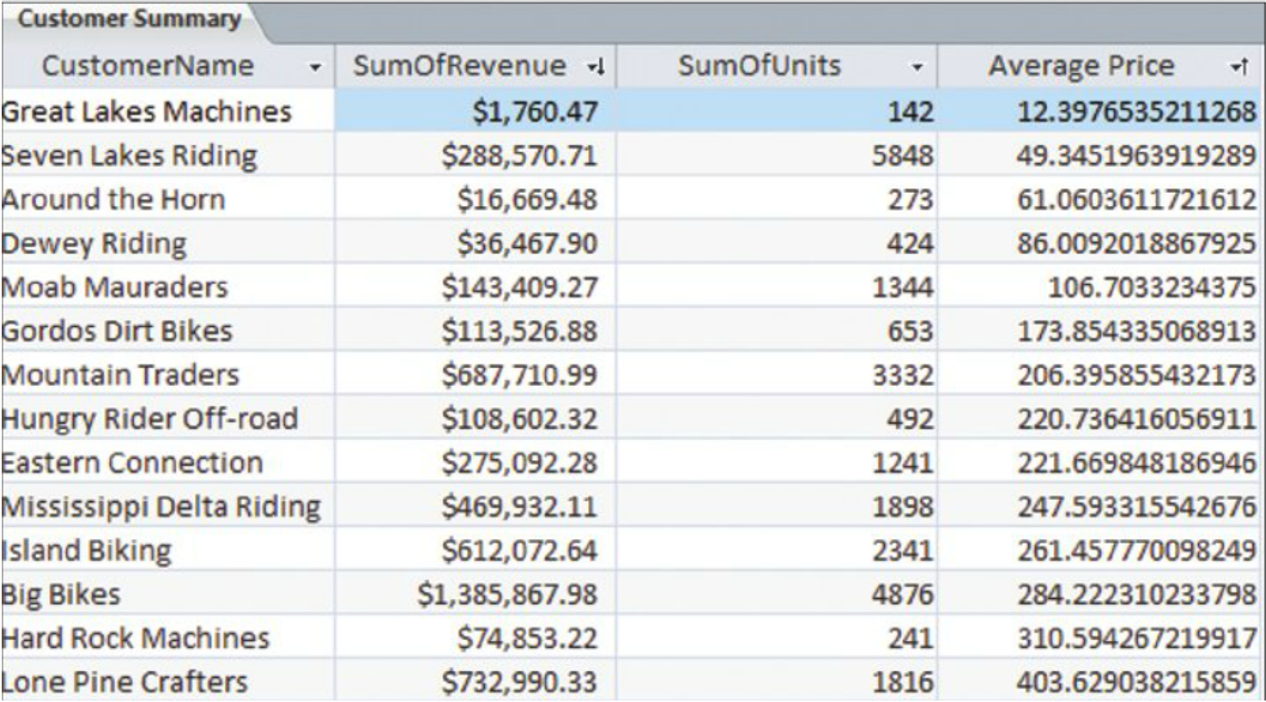
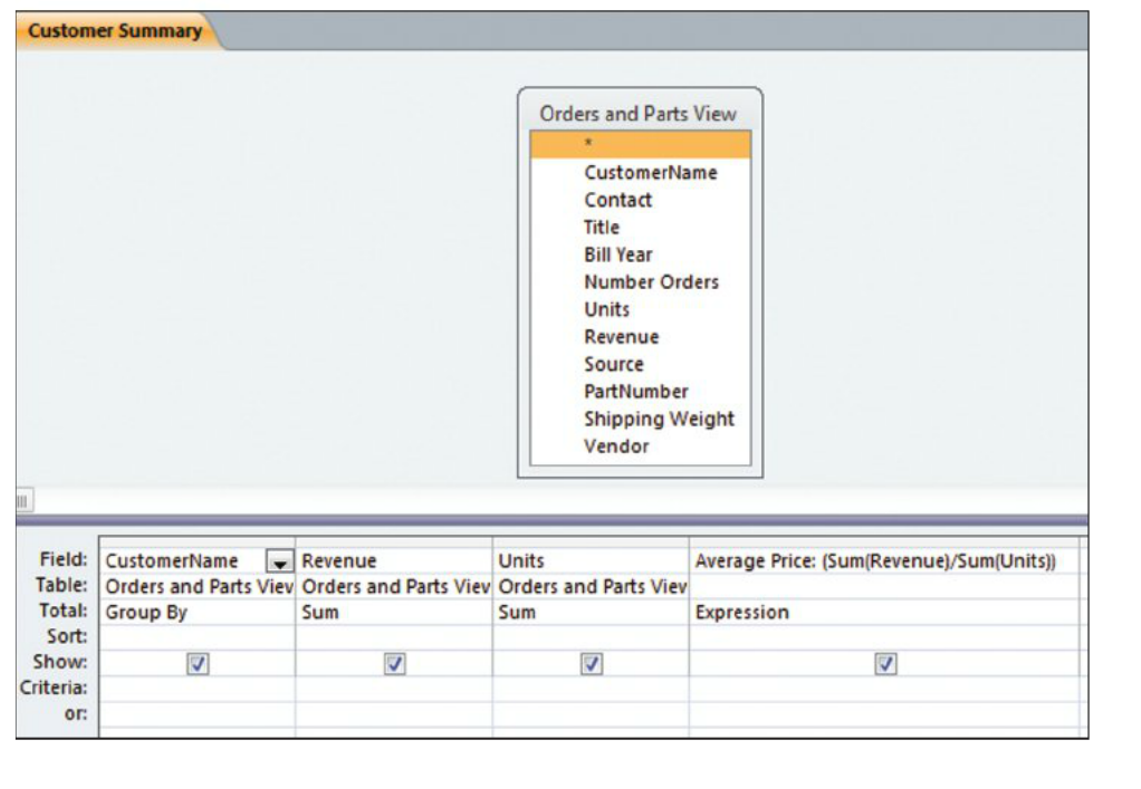
Customer Summary
Business Focus is Important
The old saying from the movie Field of Dreams, “If you build it, they will come,” doesn’t hold up well for largescale data analytics projects. This work should start with a clear vision with business-focused objectives. When senior executives can see objectives illustrated in potential payoff, they’ll be able to champion the effort, and experts agree, having an executive champion is a key success factor. Focusing on business issues will also drive technology choice, with the firm better able to focus on products that best fit its needs.
Data Issues?
- Clean – Cleansing
- Missing
- Address Info – scrub with mail database?
- Consistency – Source System of Record
- Timing
- Granularity
- Aggregated
- Sprawl
