Operational Data Stores (ODS) – CRM and Sales Funnel
Using Porter’s model of the generic value chain coupled with our work on context models we can begin to identify the generic major repositories of data within an organization. Thinking about the transactions involved in producing a product or service we have the following table with departments on the left and applications in the right column. Let’s call these Operational Data Stores or ODS. All organizations have ODS however they may not be stored as separate databases. As we will earn in a future chapter Enterprise Resource planning, ERP software provides value by linking all the data together in common database structures. But for our purposes functionally, let’s consider them as discrete for now.
So in our model each Department in the left column will have at least one ODS supporting the applications in the right column. Let’s talk about each of these.
| Department | Application |
|---|---|
| Sales and Marketing |
|
| Operations |
|
| Manufacturing |
|
| Customer Service |
|
| Human Resources |
|
| Accounting |
|
We will go through all of them in turn, with some real-world examples, let start with Sales and Marketing. This ODs will need for us to be able to store information about our Marketing efforts, our leads that were generated and then follow the lead as it goes through a process to become a customer. This process to acquire a new customer is generally quite linear. That is, it proceeds in a stepwise fashion and can therefore be measured as it is in fact a state transition process.
For example, if we break it down, we may see that it starts with marketing to generate brand awareness. We need to tell people who we are and what we have to offer. Once we get interest, we have generated prospects, as they have responded in some way to our campaign. These have not been qualified, a sales process that involves understanding the customers needs, budget, and timing for our products. Once qualified they become viable leads. Not all prospects will become leads, some will fall off at this step as we discover they are not ready, or have budget or need for our product. The next step might be a sales call, or several, whereby we further qualify the lead and present a proposal to the customer. for example lets assume we are selling window replacements, a fairly large ticket item that might occur once for a customer.
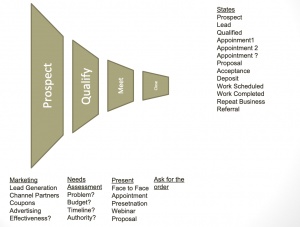
If we add some data and start to track what state our leads are in we see something like the picture below.
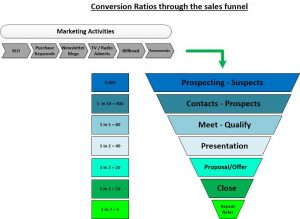
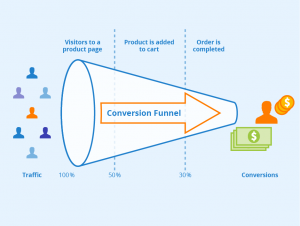
Lets take a look at an online purchase, similar concepts apply
Title: Conversion Funnel
Author: Seobility
License: CC BY-SA 4.0
What is interesting about this sales process is that we can quantify the number of active participants (potential sales) at each step. If we can measure we can create benchmarks, often called KPI (Key Performance indicators.)
There is a programming concept of a state machine, or state machine model. This is defined as an entity that can be in one of multiple states and moves between them based on an input. Some examples might be a turnstile which is either open or closed based on a payment. Or an elevator that moves between floors in response to a button push. At any point in time we can see where the elevator or turnstile is, it is at a predefined state. State is also status.
So our lead model has defined states, identified by status flag, as well. In our example above a potential new Customer could be a Suspect, Prospect, Lead, Lead with an appointment, a Lead with a 2nd appointment, a lead with a proposal, a sold lead, etc. All of these are steps or statuses on the way to a sale. In our CRM we have a field called Status that has a predefined list of steps. If we count the number of leads at each status we can measure Sales Effectiveness, by source, salesperson, division, etc.
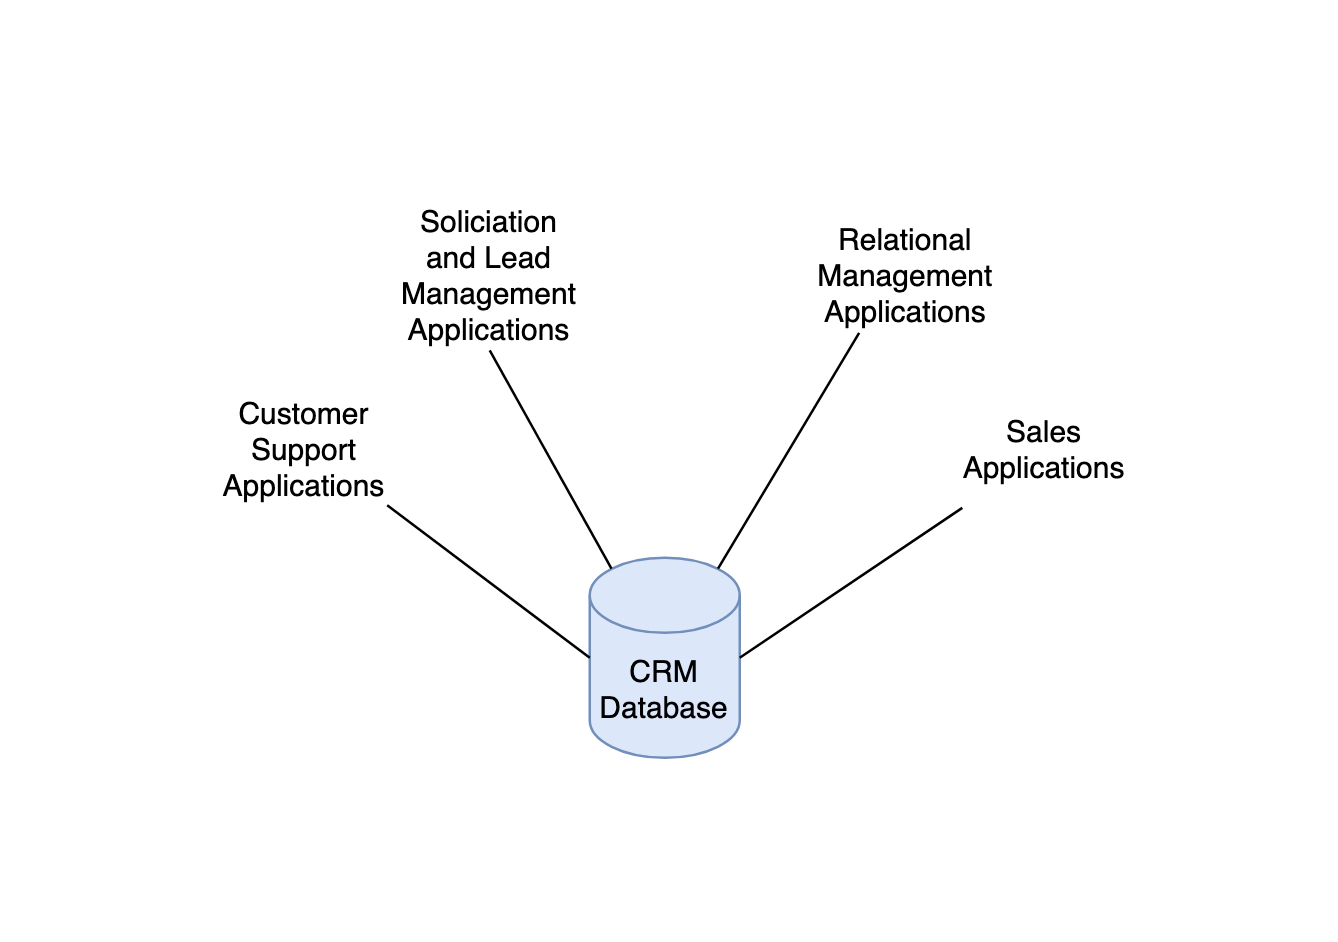
This data and the associated processes often occupy a CRM (Customer Relationship Management) system. You may have heard of Salesforce which is a good example of a popular SaaS (Software as a Service) option, but there are many premise based systems as well such as Infor CRM (aka SalesLogix.) A typical system configuration is pictured below.
| Account |
|---|
| AccountID |
| FName, LName |
| Addressid |
| Contact |
|---|
| ContactID |
| AccountID |
| FName,LName |
| Addressid |
| Type, Status |
| Address |
|---|
| AddressID |
| Street Number |
| City |
| State, Zip |
| Opportunity |
|---|
| OpportunityID |
| ContactID |
| AccountID |
| Type |
| Status |
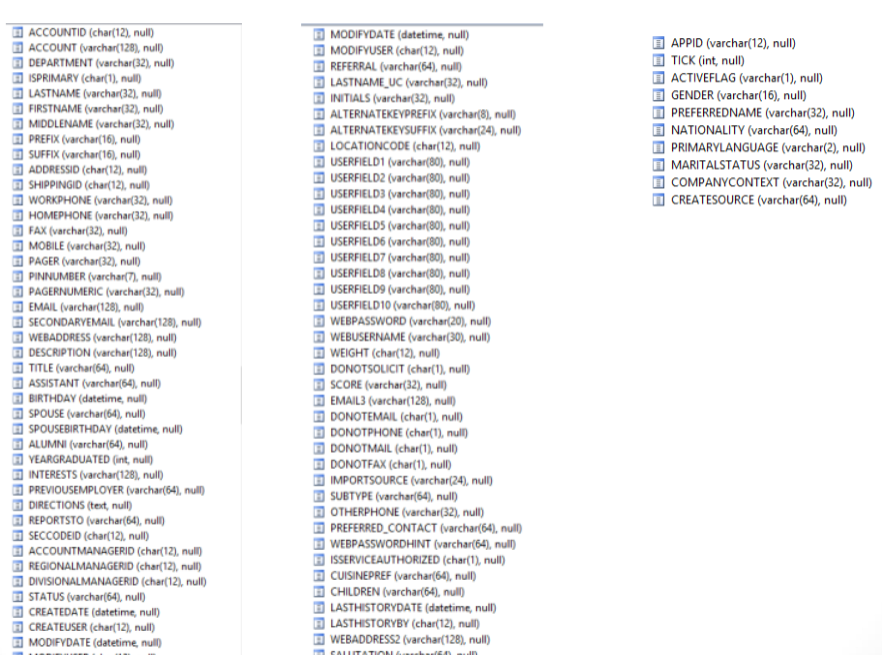
Our CRM database might include the table definitions below:
Account Table
Contact Table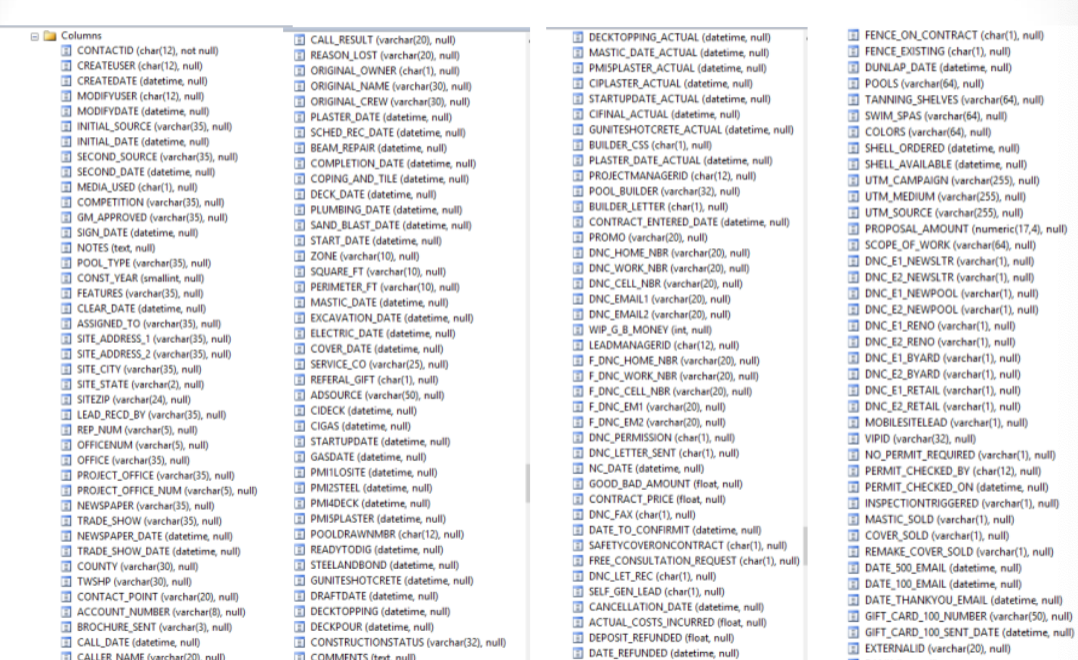
Activity / History Table