
11.19 – Water Concerns
Learning Objective
- Evaluate nutrition labels of beverages for their nutritional adequacy and health claims.
At this point, you have learned how critical water is to support human life, how it is distributed and moved in the body, how fluid balance and composition is maintained, and the recommended amount of fluids a person should consume daily. In America, you have a choice of thousands of different beverages. Which should you choose to receive the most health benefit and achieve your recommended fluid intake?
Reading the Label
Most beverages marketed in the United States have a Nutrition Facts panel and ingredients list, but some, such as coffee (for home consumption), beer, and wine, do not. As with foods, beverages that are nutrient-dense are the better choices, with the exception of plain water, which contains few to no other nutrients. Beverages do not make you full; they satiate your thirst. Therefore, the fewer calories in a beverage the better it is for avoiding weight gain. For an estimate of 11.16.1.
| Beverage | Serving Size | Kilocalories |
|---|---|---|
| Soda | 12.0 | 124–189 |
| Bottled sweet tea | 12.0 | 129–143 |
| Orange juice | 12.0 | 157–168 |
| Tomato/vegetable juice | 12.0 | 80 |
| Whole milk | 12.0 | 220 |
| Nonfat milk | 12.0 | 125 |
| Soy milk | 12.0 | 147–191 |
| Coffee, black | 12.0 | 0–4 |
| Coffee, with cream | 12.0 | 39–43 |
| Caffe latte, whole milk | 12.0 | 200 |
| Sports drink | 12.0 | 94 |
| Beer | 12.0 | 153 |
| White wine | 5.0 | 122 |
Beverage Consumption in the United States
Bleich et al. reported in Obesity that sugar-sweetened beverage (S.S.B.) consumption has begun to decline from the levels consumed in 2003-2004. About 50% of adults and 60% of children reported drinking a S.S.B. on most days. The levels of consumption of S.S.B. remain highest among blacks, Mexican-Americans and non-Mexican Hispanic children, adolescents, and young adults. 1 Bottled water outsold carbonated soft drinks for the first time in the US in 2016 according to the Beverage Marketing Corporation.
Scientific studies have demonstrated that while all beverages are capable of satisfying thirst they do not make you feel full, or satiated. This means that drinking a calorie-containing beverage with a meal only provides more calories, as it won’t be offset by eating less food. The Beverage Panel of the University of North Carolina, Chapel Hill has taken on the challenge of scientifically evaluating the health benefits and risks of beverage groups and providing recommendations for beverage groups (Table 11.16.2 “Recommendations of the Beverage Panel”). In regards to soft drinks and fruit drinks, The Beverage Panel states that they increase energy intake, are not satiating, and that there is little if any reduction in other foods to compensate for the excess calories. All of these factors contribute to increased energy intake and obesity.
The Beverage Panel recommends an even lower intake of calories from beverages than IOM—10 percent or less of total caloric intake.
Trends in Beverage Consumption Among Children and Adults, 2003‐2014. Obesity. 2018;26(2),432-441. https://doi.org/10.1002/oby.22056 Accessed June 4, 2019.
| Beverage | Servings Per Day* |
|---|---|
| Water | ≥ 4 (women), ≥ 6 (men) |
| Unsweetened coffee and tea | ≤ 8 for tea, ≤ 4 for coffee |
| Nonfat and low-fat milk; fortified soy drinks | ≤ 2 |
| Diet beverages with sugar substitutes | ≤ 4 |
| 100 percent fruit juices, whole milk, sports drinks | ≤ 1 |
| Calorie-rich beverages without nutrients | ≤ 1, less if trying to lose weight |
*One serving is eight ounces.
Source: Beverage Panel Recommendations and Analysis. University of North Carolina, Chapel Hill. US Beverage Guidance Council. Accessed November 6, 2012.
Sources of Drinking Water
The Beverage Panel recommends that women drink at least 32 ounces and men drink at least 48 ounces of water daily. In 1974, the US federal government enacted The Safe Drinking Water Act with the intention of providing the American public with safe drinking water. This act requires the Environmental Protection Agency (E.P.A.) to set water-quality standards and assure that the 150,000-plus public water systems in the country adhere to the standards. About 15 percent of Americans obtain drinking water from private wells, which are not subject to E.P.A. standards.
Producing water safe for drinking involves some or all of the following processes: screening out large objects, removing excess calcium carbonate from hard water sources, flocculation, which adds a precipitating agent to remove solid particles, clarification, sedimentation, filtration, and disinfection. These processes aim to remove unhealthy substances and produce high-quality, colorless, odorless, good-tasting water.
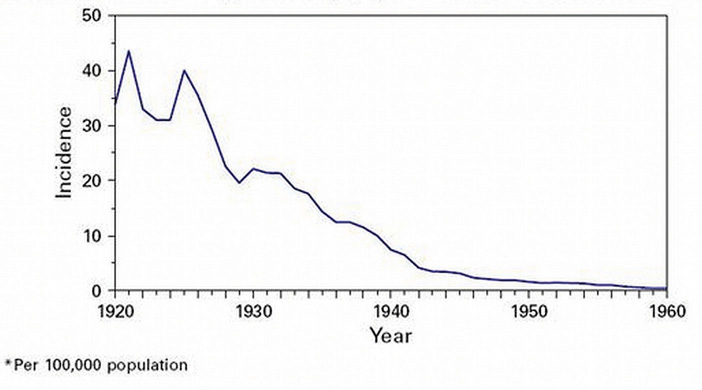
Most drinking water is disinfected by the process of chlorination, which involves adding chlorine compounds to the water. Chlorination is cheap and effective at killing bacteria. However, it is less effective at removing protozoa, such as Giardia lamblia. Chlorine-resistant protozoa and viruses are instead removed by extensive filtration methods. In the decades immediately following the implementation of water chlorination and disinfection methods in this country, waterborne illnesses, such as cholera and typhoid fever, essentially disappeared in the United States (Figure 11.16.1 ). In fact, the treatment of drinking water is touted as one of the top public-health achievements of the last century.
Chlorine reaction with inadequately filtered water can result in the formation of potentially harmful substances. Some of these chlorinated compounds, when present at extremely high levels, have been shown to cause cancer in studies conducted in rodents. In addition to many other contaminants, the E.P.A. has set maximum contaminant levels (legal threshold limits) for these chlorinated compounds in water, in order to guard against disease risk. The oversight of public water systems in this country is not perfect and water-borne illnesses are significantly underreported; however, there are far fewer cases of water-borne illnesses than those attributed to food-borne illnesses that have occurred in the recent past.
In addition, in recent years, the identification of lead in drinking water has been in the news. Cities across the US have been identified with lead-contaminated water. Water systems use of lead pipes or lead solder in their water pipes. This lead can leach into the water. The cost of replacement is substantial to upgrade our nation’s water delivery systems. See Lead Abatement in the United States in Wikipedia for more information.
Despite all of these issues, water quality in the United States is good. Tap water is cheap, safe, and readily available. Instead of reaching for purchased bottled water, fill up your own bottle at home. Be sure to clean your water bottle regularly. Use hot, soapy water to clean your bottle daily. Bacteria can and does grow in warm, moist environments. No one wants a self-induced bout of diarrhea from their dirty water bottle.
Discussion Starter
- What beverages do you drink each day? How much added sugar is in each 8 oz of that beverage? What change would you be willing to make to start reducing your S.S.B. consumption?
Contributors
University of Hawai’i at Mānoa Food Science and Human Nutrition Program: Allison Calabrese, Cheryl Gibby, Billy Meinke, Marie Kainoa Fialkowski Revilla, and Alan Titchenal
