
8.3 – Indicators of Health: Body Mass Index, Body Composition, and Fat Distribution
Learning Objectives
- Describe the methods used for assessing body composition and determining whether body weight and composition are healthy.
Although the terms “overweight” and “obese” are often used interchangeably and considered as gradations of the same thing, they can denote different things. You weigh what you weigh because of your: water weight, lean muscle weight, bone weight, and weight from body fat (adipose). “Overweight” refers to having more weight than is typical for a particular height. That weight may be the result of water weight, muscle weight, or fat mass. “Obese” refers specifically to having excess body fat.
The “ideal” healthy body weight for a particular person is dependent on many things, such as frame size, sex (hormone profile), muscle mass, bone density, age, and height. The perception of the “ideal” body weight can be additionally dependent on cultural factors and the mainstream societal advertisement of beauty.
In this author’s opinion, the concept of “ideal body weight” is concerning. I feel that each of us should be eating healthfully (not just saying it but doing it), exercising healthfully and then allowing our body weight to go where it wants to go. However, medical doctors, public health officials, and others needed to find a simple tool to look at patterns of weight gain in the U.S. and elsewhere. The easy tool that was developed is called the Body Mass Index (B.M.I.). B.M.I. was developed to tell an individual if they weight too much, too little or just right. B.M.I. uses the information that we already have readily available from every doctor’s visit: weight and height. The general idea is if you are very tall and have a low weight you are probably underweight. If you are very short and you weigh a lot you are probably overweight. It is a crude tool but one that can quickly, and inexpensively give estimates of overweight and/or underweight. You can read more about how and when B.M.I. was developed and concerns that exist with this measurement here. Woolcott and Bergman have developed and begun validation of a potentially more accurate measurement called Relative Fat Mass. In their research, R.F.M. better predicted total body fat mass.1
1 Woolcott, OO, and Bergman, RN. Relative fat mass (RFM) as a new estimator of whole-body fat percentage-A cross-sectional study in American adult individuals. Scientific Reports. 2018; 8: 10980.
The Body Mass Index (B.M.I.)
Body mass index (B.M.I.) is calculated using height and weight measurements and is more predictive of a health risk than using weight alone. B.M.I. measurements are used to indicate whether an individual may be underweight (with a B.M.I. less than 18.5), overweight (with a B.M.I. over 25), or obese (with a B.M.I. over 30). The B.M.I. is defined as the body mass divided by the square of the body height and is universally expressed in units of kg/m2, resulting from mass in kilograms and height in meters.
The B.M.I. attempts to quantify the amount of tissue mass (muscle, fat, and bone) in an individual, and then categorize that person as underweight, normal weight, overweight, or obese based on that value. However, there is some debate about where on the B.M.I. scale the dividing lines between categories should be placed. Commonly accepted B.M.I. ranges are underweight: under 18.5 kg/m2, normal weight: 18.5 to 25, overweight: 25 to 30, obese: over 30 (Figure 8.3.1).
| Categories | B.M.I. |
|---|---|
| Underweight | < 18.5 |
| Normal weight | 18.5–24.9 |
| Overweight | 25–29.9 |
| Obese | > 30.0 |
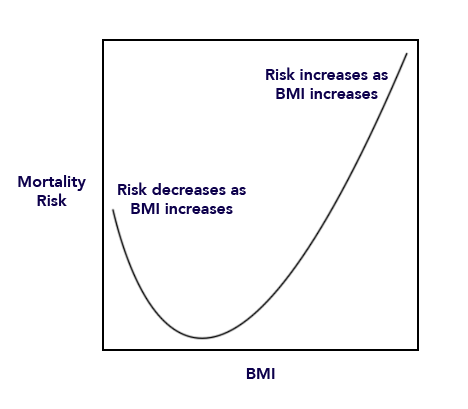
Very high AND very low B.M.I.’s appear to increase a person’s risk of dying. If you look at a graph of B.M.I. as it relates to your risk of dying, it has a “J shaped Curve” or a “U shaped Curve” because being too low and/or too high both raise your risk of mortality (Figure 8.3.2 ). Instead, you’d like to be in the middle range of the B.M.I. which is what is called “Normal weight”. You will notice that, even though you will be categorized as “overweight” at a B.M.I. of 25 and “obese” at a B.M.I. of 30, the risk of dying goes up gradually. Like a teacher assigning a letter grade, the decision of exactly where to draw the lines for underweight, normal weight, overweight and obese are somewhat arbitrary.
Body Composition
Body composition is the proportion of fat and fat-free mass (which includes bones, muscles, and organs) in your body. A healthy and physically fit individual has a greater proportion of muscle and a smaller proportion of fat than an unfit individual of the same weight. Although habitual physical activity can promote a more healthful body composition, other factors like age, sex, genetics, and diet contribute to an individual’s body composition. Women have a higher healthy fat percentage than men. For adult women, a healthy amount of body fat ranges from 20 to 32 percent. Adult males on the other hand range from 10 to 22 percent of body fat.
Limitations of B.M.I.
A B.M.I. is a fairly simple measurement and does not take into account fat mass or fat distribution in the body, both of which are additional predictors of disease risk. Body fat weighs less than muscle mass per unit volume. Therefore, B.M.I. can sometimes underestimate the amount of body fat in overweight or obese people and overestimate it in more muscular people. For instance, a muscular athlete will have more muscle mass than a couch potato of the same height. Based on their B.M.I.s the muscular athlete would be less “ideal” and may be categorized as more overweight or obese than the couch potato; however, this is an infrequent problem with B.M.I. calculation. Additionally, an older person with osteoporosis (decreased bone mass) will have a lower B.M.I. then an older person of the same height without osteoporosis, even though the person with osteoporosis may have more fat mass. A B.M.I. is a useful inexpensive tool to categorize people and is highly correlative with disease risk, but other measurements are needed to diagnose obesity and more accurately assess disease risk.
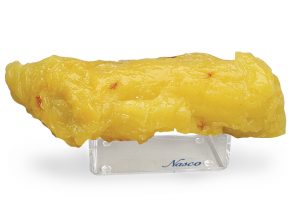

Figure 8.3.3-Nasco Healthcare models of five pounds of body fat (top) and five pounds of muscle (bottom). Used with permission of company.
Measuring Body Fat Content
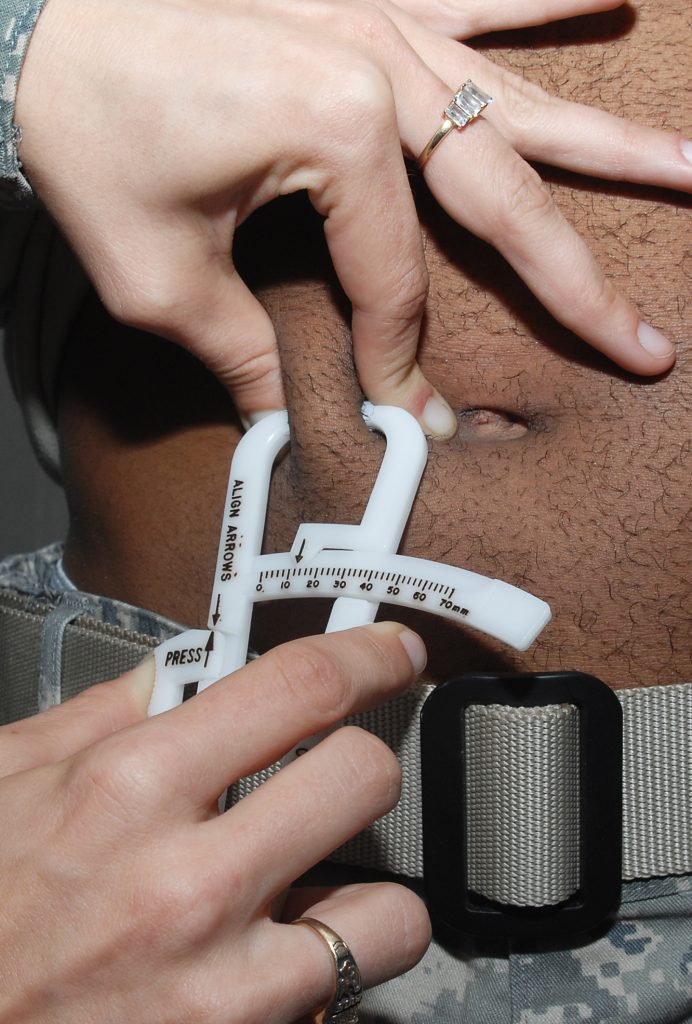
Water, organs, bone tissue, fat, and muscle tissue make up a person’s weight. Having more fat mass may be indicative of disease risk, but fat mass also varies with sex, age, and physical activity level. Females have more fat mass, which is needed for reproduction and, in part, is a consequence of different levels of hormones. The optimal fat content of a female is between 20 and 30 percent of her total weight and for a male is between 12 and 20 percent. Fat mass can be measured in a variety of ways. The simplest and lowest-cost way is the skin-fold test. A health professional uses a caliper to measure the thickness of skin on the back, arm, and other parts of the body and compares it to standards to assess body fatness. It is a noninvasive and fairly accurate method of measuring fat mass, but similar to B.M.I., is compared to standards of mostly young to middle-aged adults. Other methods of measuring fat mass are more expensive and more technically challenging. They include:
- Underwater weighing. This technique requires a chamber full of water big enough for the whole body can fit in. First, a person is weighed outside the chamber and then weighed again while immersed in water. Bone and muscle weigh more than water, but fat does not—therefore a person with a higher muscle and bone mass will weigh more when in water than a person with less bone and muscle mass.
- Bioelectric Impedance Analysis (B.I.A.). This device is based on the fact that fat slows down the passage of electricity through the body. When a small amount of electricity is passed through the body, the rate at which it travels is used to determine body composition. These devices are also sold for home use and commonly called body composition scales.
- Dual-energy x-ray absorptiometry. This technique can be used to measure bone density. It also can determine fat content via the same method, which directs two low-dose x-ray beams through the body and determines the amount of the energy absorbed from the beams. The amount of energy absorbed is dependent on the body’s content of bone, lean tissue mass, and fat mass. Using standard mathematical formulas, fat content can be accurately estimated.
Measuring Fat Distribution
Total body-fat mass is one predictor of health; another is how the fat is distributed in the body. You may have heard that fat on the hips is better than fat in the belly—this is true. Fat can be found in different areas in the body and it does not all act the same, meaning it differs physiologically based on location. Fat deposited in the abdominal cavity is called visceral fat and it is a better predictor of disease risk than total fat mass. Visceral fat releases hormones and inflammatory factors that contribute to disease risk.
The only tool required for measuring visceral fat is a measuring tape. The measurement (of waist circumference) is taken just above the belly button. Men with a waist circumference greater than 40 inches and women with a waist circumference greater than 35 inches are predicted to face greater health risks.
There are two other measurements in use for studying disease risk in populations. These include waist-to-height ratio and waist-to-hip ratio. Each of these attempts to distinguish location of adipose tissue within the body.
Observational studies have demonstrated that people with “apple-shaped” bodies, (who carry more weight around the waist) have greater risks for chronic disease than those with “pear-shaped” bodies, (who carry more weight around the hips). A study published in the November 2005 issue of Lancet with more than twenty-seven thousand participants from fifty-two countries concluded that the waist-to-hip ratio is highly correlated with heart attack risk worldwide and is a better predictor of heart attacks than B.M.I.. 1
Abdominal obesity is defined by the World Health Organization (WHO) as having a waist-to-hip ratio above 0.90 for males and above 0.85 for females.
1 Yusuf, S. et al. “Obesity and the Risk of Myocardial Infarction in 27,000 Participants from 52 Countries: A Case-Control Study.” Lancet 366, no. 9497 (2005): 1640–9. Accessed June 30, 2019.
Key Takeaways
- Most people who are overweight also have excessive body fat and therefore body weight is an indicator of obesity in much of the population.
- To standardize the “ideal” body weight and relate it to health, scientists have devised some computational measurements to better define a healthy ideal weight.
- Bodyweight in relation to height is called B.M.I. and is correlated with disease risk.
- Total body fat mass is another predictor of disease risk; another is where the fat is distributed.
- Relative Fat Mass (RFM) is a newer estimator of total body fat mass that is simple to calculate.
- Fat deposits in different areas in the body and does not all act the same, meaning it differs physiologically based on location. Visceral fat contributes more to disease risk, for example.
Discussion Starters
- Read the article, “Exercise Keeps Dangerous Visceral Fat Away a Year after Weight Loss, Study Finds,” then discuss the importance of exercise in eradicating excessive fat.
- Based on what you learned, why would an individual with a high B.M.I. have a decreased risk of osteoporosis?
