
Module 11: The Chi Square Distribution
Facts About the Chi-Square Distribution
Barbara Illowsky & OpenStax et al.
The notation for the chi-square distribution is [latex]displaystylechisimchi^2_{df}[/latex], where df = degrees of freedom which depends on how chi-square is being used. (If you want to practice calculating chi-square probabilities then use [latex]displaystyle{df}=n-1[/latex]. The degrees of freedom for the three major uses are each calculated differently.)
For the χ2 distribution, the population mean is μ = df and the population standard deviation is [latex]displaystylesigma_{chi^2}=sqrt{2(df)}[/latex].
The random variable is shown as χ2, but may be any upper case letter.
The random variable for a chi-square distribution with k degrees of freedom is the sum of k independent, squared standard normal variables.
[latex]displaystylechi^2=(Z_1)^2+(Z_2)^2+dots+(Z_k)^2[/latex]
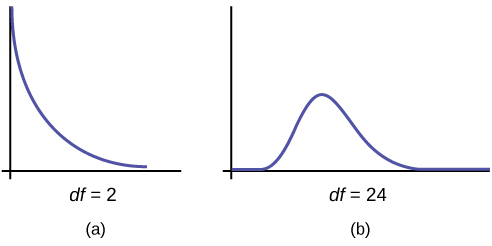
- The curve is nonsymmetrical and skewed to the right.
- There is a different chi-square curve for each df.
- The test statistic for any test is always greater than or equal to zero.
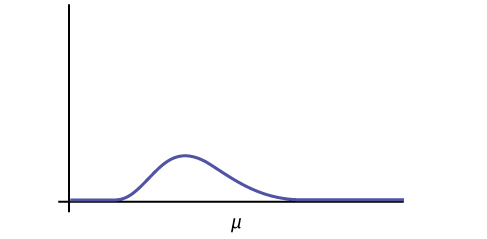
- When df > 90, the chi-square curve approximates the normal distribution. For [latex]displaystyle{X}simchi^2_{1,000}[/latex] the mean, [latex]displaystylemu=df=1,000[/latex] and the standard deviation, [latex]displaystylesigma=sqrt{2(1,000)}[/latex]. Therefore, [latex]displaystyle{X}sim{N}(1,000, 44.7)[/latex], approximately.
- The mean, μ, is located just to the right of the peak.
References
Data from Parade Magazine.
“HIV/AIDS Epidemiology Santa Clara County.”Santa Clara County Public Health Department, May 2011.
Concept Review
The chi-square distribution is a useful tool for assessment in a series of problem categories. These problem categories include primarily (i) whether a data set fits a particular distribution, (ii) whether the distributions of two populations are the same, (iii) whether two events might be independent, and (iv) whether there is a different variability than expected within a population.
An important parameter in a chi-square distribution is the degrees of freedom df in a given problem. The random variable in the chi-square distribution is the sum of squares of df standard normal variables, which must be independent. The key characteristics of the chi-square distribution also depend directly on the degrees of freedom.
The chi-square distribution curve is skewed to the right, and its shape depends on the degrees of freedom df. For df > 90, the curve approximates the normal distribution. Test statistics based on the chi-square distribution are always greater than or equal to zero. Such application tests are almost always right-tailed tests.
Formula Review
[latex]displaystylechi^2=(Z_1)^2+(Z_2)^2+dots(Z_{df})^2[/latex] chi-square distribution random variable
[latex]displaystylemu_{chi^2}=df[/latex] chi-square distribution population mean
[latex]displaystylesigma_{chi^2}=sqrt{2(df)}[/latex] Chi-Square distribution population standard deviation
