
Module 3: Probability
Tree and Venn Diagrams
Barbara Illowsky & OpenStax et al.
Sometimes, when the probability problems are complex, it can be helpful to graph the situation. Tree diagrams and Venn diagrams are two tools that can be used to visualize and solve conditional probabilities.
Tree Diagrams
A tree diagram is a special type of graph used to determine the outcomes of an experiment. It consists of “branches” that are labeled with either frequencies or probabilities. Tree diagrams can make some probability problems easier to visualize and solve. The following example illustrates how to use a tree diagram.
Example
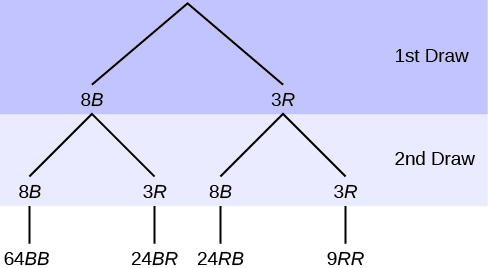
The first set of branches represents the first draw. The second set of branches represents the second draw. Each of the outcomes is distinct. In fact, we can list each red ball as R1, R2, and R3 and each blue ball as B1, B2, B3, B4, B5, B6, B7, andB8. Then the nine RR outcomes can be written as:
R1R1 R1R2 R1R3 R2R1 R2R2 R2R3 R3R1 R3R2 R3R3
The other outcomes are similar.
Solution:
Try it
a. List the 24 BR outcomes: B1R1, B1R2, B1R3, …
b. Using the tree diagram, calculate P(RR).
An urn has three red marbles and eight blue marbles in it. Draw two marbles, one at a time, this time without replacement, from the urn. “Without replacement” means that you do not put the first ball back before you select the second marble. Following is a tree diagram for this situation. The branches are labeled with probabilities instead of frequencies. The numbers at the ends of the branches are calculated by multiplying the numbers on the two corresponding branches, for example, (311)(210)=6110.
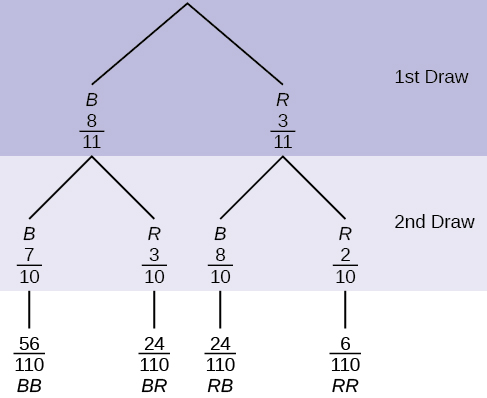
NOTE
If you draw a red on the first draw from the three red possibilities, there are two red marbles left to draw on the second draw. You do not put back or replace the first marble after you have drawn it. You draw without replacement, so that on the second draw there are ten marbles left in the urn.
Try it
a. P(RR) = ________
P(RB OR BR) = (311)(810) + (___)(___) = 48110
P(R on 1st AND B on 2nd) = P(RB) = (___)(___) = 24100
If we are using probabilities, we can label the tree in the following general way.
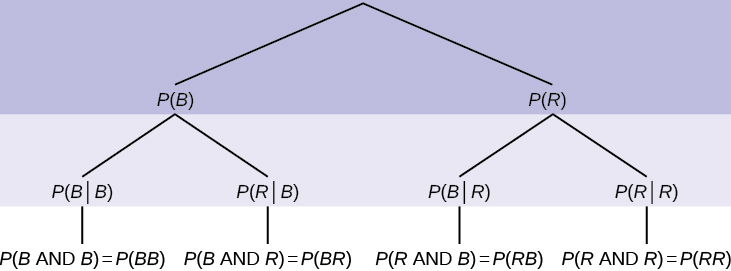
- P(R|R) here means P(R on 2nd|R on 1st)
- P(B|R) here means P(B on 2nd|R on 1st)
- P(R|B) here means P(R on 2nd|B on 1st)
- P(B|B) here means P(B on 2nd|B on 1st)
Venn Diagram
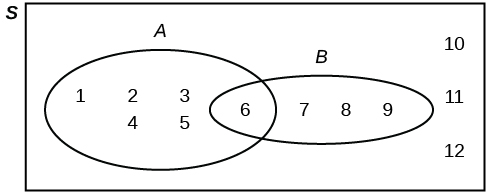
A Venn diagram is a picture that represents the outcomes of an experiment. It generally consists of a box that represents the sample space S together with circles or ovals. The circles or ovals represent events.
Suppose an experiment has the outcomes 1, 2, 3, … , 12 where each outcome has an equal chance of occurring. Let event A = {1, 2, 3, 4, 5, 6} and event B = {6, 7, 8, 9}. Then A AND B = {6} and A OR B = {1, 2, 3, 4, 5, 6, 7, 8, 9}. The Venn diagram is as follows:
Example
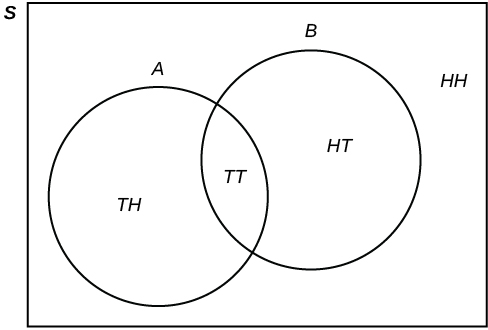
Flip two fair coins. Let A = tails on the first coin. Let B = tails on the second coin. Then A = {TT, TH} and B = {TT, HT}. Therefore,A AND B = {TT}. A OR B = {TH, TT, HT}.
The sample space when you flip two fair coins is X = {HH, HT, TH, TT}. The outcome HH is in NEITHER A NOR B. The Venn diagram is as follows:
Glossary
- Tree Diagram
- the useful visual representation of a sample space and events in the form of a “tree” with branches marked by possible outcomes together with associated probabilities (frequencies, relative frequencies)
- Venn Diagram
- the visual representation of a sample space and events in the form of circles or ovals showing their intersections
e. P(R on 2nd draw GIVEN B on 1st draw) = P(R on 2nd|B on 1st) = 2488 = 311
This problem is a conditional one. The sample space has been reduced to those outcomes that already have a blue on the first draw. There are 24 + 64 = 88 possible outcomes (24 BR and 64 BB). Twenty-four of the 88 possible outcomes are BR. 2488 = 311.
f. P(BB) = 64121
g. P(B on 2nd draw|R on 1st draw) = 811
There are 9 + 24 outcomes that have R on the first draw (9 RR and 24 RB). The sample space is then 9 + 24 = 33. 24 of the 33 outcomes have B on the second draw. The probability is then 2433.
Solutions to Try These 2:
