
Module 12: Linear Regression and Correlation
Linear Equations
Barbara Illowsky & OpenStax et al.
Linear regression for two variables is based on a linear equation with one independent variable. The equation has the form:
where a and b are constant numbers.
The variable x is the independent variable, and y is the dependent variable. Typically, you choose a value to substitute for the independent variable and then solve for the dependent variable.
try it
y = –0.125 – 3.5x
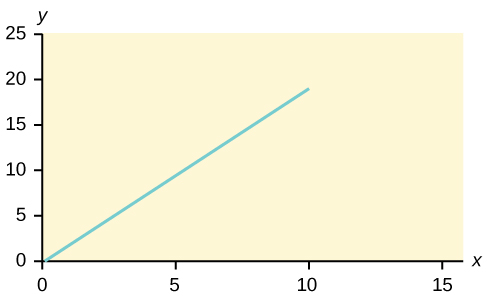
The graph of a linear equation of the form y = a + bx is a straight line. Any line that is not vertical can be described by this equation.
Graph the equation y = –1 + 2x.
try it
- Is the following an example of a linear equation? Why or why not?
Aaron’s Word Processing Service (AWPS) does word processing. The rate for services is $32 per hour plus a $31.50 one-time charge. The total cost to a customer depends on the number of hours it takes to complete the job.
Find the equation that expresses the total cost in terms of the number of hoursrequired to complete the job.
try it
Slope and Y-Intercept of a Linear Equation
For the linear equation y = a + bx, b = slope and a = y-intercept. From algebra recall that the slope is a number that describes the steepness of a line, and the y-intercept is the y coordinate of the point (0, a) where the line crosses the y-axis.
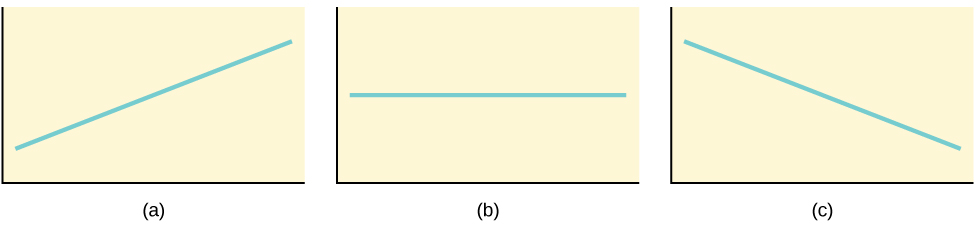 0 and so the line slopes upward to the right. For the second, b = 0 and the graph of the equation is a horizontal line. In the third graph, (c), b < 0 and the line slopes downward to the right.” width=”480″ data-media-type=”image/jpg”>
What are the independent and dependent variables? What is the y-intercept and what is the slope? Interpret them using complete sentences.
try it
Ethan repairs household appliances like dishwashers and refrigerators. For each visit, he charges $25 plus $20 per hour of work. A linear equation that expresses the total amount of money Ethan earns per visit is y = 25 + 20x.
What are the independent and dependent variables? What is the y-intercept and what is the slope? Interpret them using complete sentences.
References
Data from the Centers for Disease Control and Prevention.
Data from the National Center for HIV, STD, and TB Prevention.
Concept Review
The most basic type of association is a linear association. This type of relationship can be defined algebraically by the equations used, numerically with actual or predicted data values, or graphically from a plotted curve. (Lines are classified as straight curves.) Algebraically, a linear equation typically takes the form y = mx + b, where m and b are constants, x is the independent variable, y is the dependent variable. In a statistical context, a linear equation is written in the form y = a + bx, where aand b are the constants. This form is used to help readers distinguish the statistical context from the algebraic context. In the equation y = a + bx, the constant b that multiplies the x variable (b is called a coefficient) is called as the slope. The slope describes the rate of change between the independent and dependent variables; in other words, the rate of change describes the change that occurs in the dependent variable as the independent variable is changed. In the equation y = a + bx, the constant a is called as the y-intercept. Graphically, the y-intercept is the y coordinate of the point where the graph of the line crosses the y axis. At this point x = 0.
The slope of a line is a value that describes the rate of change between the independent and dependent variables. The slope tells us how the dependent variable (y) changes for every one unit increase in the independent (x) variable, on average. The y-intercept is used to describe the dependent variable when the independent variable equals zero. Graphically, the slope is represented by three line types in elementary statistics.
Formula Review
y = a + bx where a is the y-intercept and b is the slope. The variable x is the independent variable andy is the dependent variable.
