Module 1: Sampling and Data
Section Exercises
Barbara Illowsky & OpenStax et al.
Definitions of Statistics, Probability, and Key Terms
Use the following information to answer the next five exercises. Studies are often done by pharmaceutical companies to determine the effectiveness of a treatment program. Suppose that a new AIDS antibody drug is currently under study. It is given to patients once the AIDS symptoms have revealed themselves. Of interest is the average (mean) length of time in months patients live once they start the treatment. Two researchers each follow a different set of 40 patients with AIDS from the start of treatment until their deaths. The following data (in months) are collected.
Researcher A:3 4 11 15 16 17 22 44 37 16 14 24 25 15 26 27 33 29 35 44 13 21 22 10 12 8 40 32 26 27 31 34 29 17 8 24 18 47 33 34
Researcher B:3 14 11 5 16 17 28 41 31 18 14 14 26 25 21 22 31 2 35 44 23 21 21 16 12 18 41 22 16 25 33 34 29 13 18 24 23 42 33 29
Determine what the key terms refer to in the example for Researcher A.
1. population
3. parameter
5. variable
For each of the following eight exercises, identify: a. the population, b. the sample, c. the parameter, d. the statistic, e. the variable, and f. the data. Give examples where appropriate.
6. A fitness center is interested in the mean amount of time a client exercises in the center each week.
7. Ski resorts are interested in the mean age that children take their first ski and snowboard lessons. They need this information to plan their ski classes optimally.
9. Insurance companies are interested in the mean health costs each year of their clients, so that they can determine the costs of health insurance.
11. A marriage counselor is interested in the proportion of clients she counsels who stay married.
13. A marketing company is interested in the proportion of people who will buy a particular product.
14. What is the population she is interested in?
- all Lake Tahoe Community College students
- all Lake Tahoe Community College English students
- all Lake Tahoe Community College students in her classes
- all Lake Tahoe Community College math students
Consider the following:
X = number of days a Lake Tahoe Community College math student is absent
15. In this case, X is an example of a:
- variable.
- population.
- statistic.
- data.
16. The instructor’s sample produces a mean number of days absent of 3.5 days. This value is an example of a:
- parameter.
- data.
- statistic.
- variable.
Data, Sampling, and Variation in Data and Sampling
17. “Number of times per week” is what type of data?
a. qualitative b. quantitative discrete c. quantitative continuous
Use the following information to answer the next four exercises: A study was done to determine the age, number of times per week, and the duration (amount of time) of residents using a local park in San Antonio, Texas. The first house in the neighborhood around the park was selected randomly, and then the resident of every eighth house in the neighborhood around the park was interviewed.
18. The sampling method was
a. simple random b. systematic c. stratified d. cluster
a. qualitative b. quantitative discrete c. quantitative continuous
20. The colors of the houses around the park are what kind of data?
a. qualitative b. quantitative discrete c. quantitative continuous
The table contains the total number of deaths worldwide as a result of earthquakes from 2000 to 2012.
| Year | Total Number of Deaths |
|---|---|
| 2000 | 231 |
| 2001 | 21,357 |
| 2002 | 11,685 |
| 2003 | 33,819 |
| 2004 | 228,802 |
| 2005 | 88,003 |
| 2006 | 6,605 |
| 2007 | 712 |
| 2008 | 88,011 |
| 2009 | 1,790 |
| 2010 | 320,120 |
| 2011 | 21,953 |
| 2012 | 768 |
| Total | 823,856 |
22. Use the table to answer the following questions.
- What is the proportion of deaths between 2007 and 2012?
- What percent of deaths occurred before 2001?
- What is the percent of deaths that occurred in 2003 or after 2010?
- What is the fraction of deaths that happened before 2012?
- What kind of data is the number of deaths?
- Earthquakes are quantified according to the amount of energy they produce (examples are 2.1, 5.0, 6.7). What type of data is that?
- What contributed to the large number of deaths in 2010? In 2004? Explain.
For the following four exercises, determine the type of sampling used (simple random, stratified, systematic, cluster, or convenience).
23. A group of test subjects is divided into twelve groups; then four of the groups are chosen at random.
24. A market researcher polls every tenth person who walks into a store.
26. A computer generates 100 random numbers, and 100 people whose names correspond with the numbers on the list are chosen.
Researcher A: 3; 4; 11; 15; 16; 17; 22; 44; 37; 16; 14; 24; 25; 15; 26; 27; 33; 29; 35; 44; 13; 21; 22; 10; 12; 8; 40; 32; 26; 27; 31; 34; 29; 17; 8; 24; 18; 47; 33; 34
Researcher B: 3; 14; 11; 5; 16; 17; 28; 41; 31; 18; 14; 14; 26; 25; 21; 22; 31; 2; 35; 44; 23; 21; 21; 16; 12; 18; 41; 22; 16; 25; 33; 34; 29; 13; 18; 24; 23; 42; 33; 29
27. Complete the tables using the data provided:
| Survival Length (in months) | Frequency | Relative Frequency | Cumulative Relative Frequency |
|---|---|---|---|
| 0.5–6.5 | |||
| 6.5–12.5 | |||
| 12.5–18.5 | |||
| 18.5–24.5 | |||
| 24.5–30.5 | |||
| 30.5–36.5 | |||
| 36.5–42.5 | |||
| 42.5–48.5 |
| Survival Length (in months) | Frequency | Relative Frequency | Cumulative Relative Frequency |
|---|---|---|---|
| 0.5–6.5 | |||
| 6.5–12.5 | |||
| 12.5–18.5 | |||
| 18.5–24.5 | |||
| 24.5–30.5 | |||
| 30.5–36.5 | |||
| 36.5-45.5 |
28. Determine what the key term data refers to in the above example for Researcher A.
29. List two reasons why the data may differ.
30. Can you tell if one researcher is correct and the other one is incorrect? Why?
31. Would you expect the data to be identical? Why or why not?
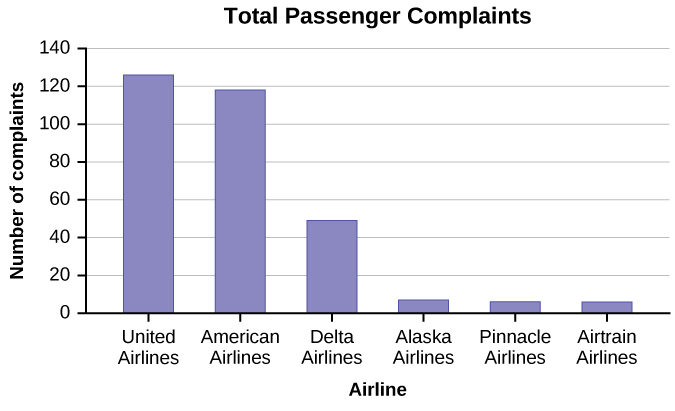
32. How might the researchers gather random data?
33. Suppose that the first researcher conducted his survey by randomly choosing one state in the nation and then randomly picking 40 patients from that state. What sampling method would that researcher have used?
34. Suppose that the second researcher conducted his survey by choosing 40 patients he knew. What sampling method would that researcher have used? What concerns would you have about this data set, based upon the data collection method?
Use the following data to answer the next five exercises: Two researchers are gathering data on hours of video games played by school-aged children and young adults. They each randomly sample different groups of 150 students from the same school. They collect the following data.
| Hours Played per Week | Frequency | Relative Frequency | Cumulative Relative Frequency |
|---|---|---|---|
| 0–2 | 26 | 0.17 | 0.17 |
| 2–4 | 30 | 0.20 | 0.37 |
| 4–6 | 49 | 0.33 | 0.70 |
| 6–8 | 25 | 0.17 | 0.87 |
| 8–10 | 12 | 0.08 | 0.95 |
| 10–12 | 8 | 0.05 | 1 |
| Hours Played per Week | Frequency | Relative Frequency | Cumulative Relative Frequency |
|---|---|---|---|
| 0–2 | 48 | 0.32 | 0.32 |
| 2–4 | 51 | 0.34 | 0.66 |
| 4–6 | 24 | 0.16 | 0.82 |
| 6–8 | 12 | 0.08 | 0.90 |
| 8–10 | 11 | 0.07 | 0.97 |
| 10–12 | 4 | 0.03 | 1 |
35. Give a reason why the data may differ.
36. Would the sample size be large enough if the population is the students in the school?
37. Would the sample size be large enough if the population is school-aged children and young adults in the United States?
38. Researcher A concludes that most students play video games between four and six hours each week. Researcher B concludes that most students play video games between two and four hours each week. Who is correct?
Use the following data to answer the next five exercises: A pair of studies was performed to measure the effectiveness of a new software program designed to help stroke patients regain their problem-solving skills. Patients were asked to use the software program twice a day, once in the morning and once in the evening. The studies observed 200 stroke patients recovering over a period of several weeks. The first study collected the data in the table. The second study collected the data in the table.
| Group | Showed improvement | No improvement | Deterioration |
|---|---|---|---|
| Used program | 142 | 43 | 15 |
| Did not use program | 72 | 110 | 18 |
| Group | Showed improvement | No improvement | Deterioration |
|---|---|---|---|
| Used program | 105 | 74 | 19 |
| Did not use program | 89 | 99 | 12 |
40. Given what you know, which study is correct?
42. Both groups that performed the study concluded that the software works. Is this accurate?
44. Patients who used the software were also a part of an exercise program whereas patients who did not use the software were not. Does this change the validity of the conclusions from 44?
46. Is a sample of 500 volunteers a reliable measure for a population of 2,500?
48. Is a sample size of two representative of a population of five?
For the following exercises, identify the type of data that would be used to describe a response (quantitative discrete, quantitative continuous, or qualitative), and give an example of the data.
50. number of tickets sold to a concert
51. percent of body fat
52. favorite baseball team
54. number of students enrolled at Evergreen Valley College
56. brand of toothpaste
58. age of executives in Fortune 500 companies
Use the following information to answer the next two exercises: A study was done to determine the age, number of times per week, and the duration (amount of time) of resident use of a local park in San Jose. The first house in the neighborhood around the park was selected randomly and then every 8th house in the neighborhood around the park was interviewed.
60. “Number of times per week” is what type of data?
- qualitative
- quantitative discrete
- quantitative continuous
61. “Duration (amount of time)” is what type of data?
- qualitative
- quantitative discrete
- quantitative continuous
62. Airline companies are interested in the consistency of the number of babies on each flight, so that they have adequate safety equipment. Suppose an airline conducts a survey. Over Thanksgiving weekend, it surveys six flights from Boston to Salt Lake City to determine the number of babies on the flights. It determines the amount of safety equipment needed by the result of that study.
- Using complete sentences, list three things wrong with the way the survey was conducted.
- Using complete sentences, list three ways that you would improve the survey if it were to be repeated.
63. Suppose you want to determine the mean number of students per statistics class in your state. Describe a possible sampling method in three to five complete sentences. Make the description detailed.
64. Suppose you want to determine the mean number of cans of soda drunk each month by students in their twenties at your school. Describe a possible sampling method in three to five complete sentences. Make the description detailed.
66. List some practical difficulties involved in getting accurate results from a mailed survey.
68. The instructor takes her sample by gathering data on five randomly selected students from each Lake Tahoe Community College math class. The type of sampling she used is
- cluster sampling
- stratified sampling
- simple random sampling
- convenience sampling
69. A study was done to determine the age, number of times per week, and the duration (amount of time) of residents using a local park in San Jose. The first house in the neighborhood around the park was selected randomly and then every eighth house in the neighborhood around the park was interviewed. The sampling method was:
- simple random
- systematic
- stratified
- cluster
Name the sampling method used in each of the following situations:
- Do you consider the sample size large enough for a study of this type? Why or why not?
- Based on your “gut feeling,” do you believe the percents accurately reflect the U.S. population for those individuals born since 1971? If not, do you think the percents of the population are actually higher or lower than the sample statistics? Why?
Additional information: The survey, reported by Intel Corporation, was filled out by individuals who visited the Los Angeles Convention Center to see the Smithsonian Institute’s road show called “America’s Smithsonian.”
- With this additional information, do you feel that all demographic and ethnic groups were equally represented at the event? Why or why not?
- With the additional information, comment on how accurately you think the sample statistics reflect the population parameters.
77. The Gallup-Healthways Well-Being Index is a survey that follows trends of U.S. residents on a regular basis. There are six areas of health and wellness covered in the survey: Life Evaluation, Emotional Health, Physical Health, Healthy Behavior, Work Environment, and Basic Access. Some of the questions used to measure the Index are listed below.
78. Identify the type of data obtained from each question used in this survey: qualitative, quantitative discrete, or quantitative continuous.
- Do you have any health problems that prevent you from doing any of the things people your age can normally do?
- During the past 30 days, for about how many days did poor health keep you from doing your usual activities?
- In the last seven days, on how many days did you exercise for 30 minutes or more?
- Do you have health insurance coverage?
79. In advance of the 1936 Presidential Election, a magazine titled Literary Digest released the results of an opinion poll predicting that the republican candidate Alf Landon would win by a large margin. The magazine sent post cards to approximately 10,000,000 prospective voters. These prospective voters were selected from the subscription list of the magazine, from automobile registration lists, from phone lists, and from club membership lists. Approximately 2,300,000 people returned the postcards.
- Think about the state of the United States in 1936. Explain why a sample chosen from magazine subscription lists, automobile registration lists, phone books, and club membership lists was not representative of the population of the United States at that time.
- What effect does the low response rate have on the reliability of the sample?
- Are these problems examples of sampling error or nonsampling error?
- During the same year, George Gallup conducted his own poll of 30,000 prospective voters. His researchers used a method they called “quota sampling” to obtain survey answers from specific subsets of the population. Quota sampling is an example of which sampling method described in this module?
80. Crime-related and demographic statistics for 47 US states in 1960 were collected from government agencies, including the FBI’s Uniform Crime Report. One analysis of this data found a strong connection between education and crime indicating that higher levels of education in a community correspond to higher crime rates.
Which of the potential problems with samples discussed below could explain this connection?
Critical Evaluation
We need to evaluate the statistical studies we read about critically and analyze them before accepting the results of the studies. Common problems to be aware of include
- Problems with samples: A sample must be representative of the population. A sample that is not representative of the population is biased. Biased samples that are not representative of the population give results that are inaccurate and not valid.
- Self-selected samples: Responses only by people who choose to respond, such as call-in surveys, are often unreliable.
- Sample size issues: Samples that are too small may be unreliable. Larger samples are better, if possible. In some situations, having small samples is unavoidable and can still be used to draw conclusions. Examples: crash testing cars or medical testing for rare conditions
- Undue influence: collecting data or asking questions in a way that influences the response
- Non-response or refusal of subject to participate: The collected responses may no longer be representative of the population. Often, people with strong positive or negative opinions may answer surveys, which can affect the results.
- Causality: A relationship between two variables does not mean that one causes the other to occur. They may be related (correlated) because of their relationship through a different variable.
- Self-funded or self-interest studies: A study performed by a person or organization in order to support their claim. Is the study impartial? Read the study carefully to evaluate the work. Do not automatically assume that the study is good, but do not automatically assume the study is bad either. Evaluate it on its merits and the work done.
- Misleading use of data: improperly displayed graphs, incomplete data, or lack of context
- Confounding: When the effects of multiple factors on a response cannot be separated. Confounding makes it difficult or impossible to draw valid conclusions about the effect of each factor.
YouPolls is a website that allows anyone to create and respond to polls. One question posted April 15 asks:
“Do you feel happy paying your taxes when members of the Obama administration are allowed to ignore their tax liabilities?”
As of April 25, 11 people responded to this question. Each participant answered “NO!”
81. Which of the potential problems with samples could explain this connection?
82. A scholarly article about response rates begins with the following quote:
“Declining contact and cooperation rates in random digit dial (RDD) national telephone surveys raise serious concerns about the validity of estimates drawn from such research.”
The Pew Research Center for People and the Press admits:
“The percentage of people we interview – out of all we try to interview – has been declining over the past decade or more.”3
- What are some reasons for the decline in response rate over the past decade?
- Explain why researchers are concerned with the impact of the declining response rate on public opinion polls.
| Have computer at home | 96% |
| Unable to come to campus for classes | 65% |
| Age 41 or over | 24% |
| Would like LBCC to offer more DL courses | 95% |
| Took DL classes due to a disability | 17% |
| Live at least 16 miles from campus | 13% |
| Took DL courses to fulfill transfer requirements | 71% |
- What percent of the students surveyed do not have a computer at home?
- About how many students in the survey live at least 16 miles from campus?
- If the same survey were done at Great Basin College in Elko, Nevada, do you think the percentages would be the same? Why?
84. Several online textbook retailers advertise that they have lower prices than on-campus bookstores. However, an important factor is whether the Internet retailers actually have the textbooks that students need in stock. Students need to be able to get textbooks promptly at the beginning of the college term. If the book is not available, then a student would not be able to get the textbook at all, or might get a delayed delivery if the book is back ordered.
85. A college newspaper reporter is investigating textbook availability at online retailers. He decides to investigate one textbook for each of the following seven subjects: calculus, biology, chemistry, physics, statistics, geology, and general engineering. He consults textbook industry sales data and selects the most popular nationally used textbook in each of these subjects. He visits websites for a random sample of major online textbook sellers and looks up each of these seven textbooks to see if they are available in stock for quick delivery through these retailers. Based on his investigation, he writes an article in which he draws conclusions about the overall availability of all college textbooks through online textbook retailers.
Write an analysis of his study that addresses the following issues: Is his sample representative of the population of all college textbooks? Explain why or why not. Describe some possible sources of bias in this study, and how it might affect the results of the study. Give some suggestions about what could be done to improve the study.
Frequency, Frequency Tables, and Levels of Measurement
86. What type of measure scale is being used? Nominal, ordinal, interval or ratio.
- High school soccer players classified by their athletic ability: Superior, Average, Above average
- Baking temperatures for various main dishes: 350, 400, 325, 250, 300
- The colors of crayons in a 24-crayon box
- Social security numbers
- Incomes measured in dollars
- A satisfaction survey of a social website by number: 1 = very satisfied, 2 = somewhat satisfied, 3 = not satisfied
- Political outlook: extreme left, left-of-center, right-of-center, extreme right
- Time of day on an analog watch
- The distance in miles to the closest grocery store
- The dates 1066, 1492, 1644, 1947, and 1944
- The heights of 21–65 year-old women
- Common letter grades: A, B, C, D, and F
87. Fifty part-time students were asked how many courses they were taking this term. The (incomplete) results are shown below:
| # of Courses | Frequency | Relative Frequency | Cumulative Relative Frequency |
|---|---|---|---|
| 1 | 30 | 0.6 | |
| 2 | 15 | ||
| 3 |
- Fill in the blanks in Table.
- What percent of students take exactly two courses?
- What percent of students take one or two courses?
88. Sixty adults with gum disease were asked the number of times per week they used to floss before their diagnosis. The (incomplete) results are shown in Table.
| # Flossing per Week | Frequency | Relative Frequency | Cumulative Relative Freq. |
|---|---|---|---|
| 0 | 27 | 0.4500 | |
| 1 | 18 | ||
| 3 | 0.9333 | ||
| 6 | 3 | 0.0500 | |
| 7 | 1 | 0.0167 |
- Fill in the blanks in Table.
- What percent of adults flossed six times per week?
- What percent flossed at most three times per week?
89. Nineteen immigrants to the U.S were asked how many years, to the nearest year, they have lived in the U.S. The data are as follows: 2 5 7 2 2 10 20 15 0 7 0 20 5 12 15 12 4 5 10 .
This table was produced.
| Data | Frequency | Relative Frequency | Cumulative Relative Frequency |
|---|---|---|---|
| 0 | 2 | 219 | 0.1053 |
| 2 | 3 | 319 | 0.2632 |
| 4 | 1 | 119 | 0.3158 |
| 5 | 3 | 319 | 0.4737 |
| 7 | 2 | 219 | 0.5789 |
| 10 | 2 | 219 | 0.6842 |
| 12 | 2 | 219 | 0.7895 |
| 15 | 1 | 119 | 0.8421 |
| 20 | 1 | 119 | 1.0000 |
- Fix the errors in Table. Also, explain how someone might have arrived at the incorrect number(s).
- Explain what is wrong with this statement: “47 percent of the people surveyed have lived in the U.S. for 5 years.”
- Fix the statement in b to make it correct.
- What fraction of the people surveyed have lived in the U.S. five or seven years?
- What fraction of the people surveyed have lived in the U.S. at most 12 years?
- What fraction of the people surveyed have lived in the U.S. fewer than 12 years?
- What fraction of the people surveyed have lived in the U.S. from five to 20 years, inclusive?
90. How much time does it take to travel to work? The table below shows the mean commute time by state for workers at least 16 years old who are not working at home. Find the mean travel time, and round off the answer properly.
| 24.0 | 24.3 | 25.9 | 18.9 | 27.5 | 17.9 | 21.8 | 20.9 | 16.7 | 27.3 |
| 18.2 | 24.7 | 20.0 | 22.6 | 23.9 | 18.0 | 31.4 | 22.3 | 24.0 | 25.5 |
| 24.7 | 24.6 | 28.1 | 24.9 | 22.6 | 23.6 | 23.4 | 25.7 | 24.8 | 25.5 |
| 21.2 | 25.7 | 23.1 | 23.0 | 23.9 | 26.0 | 16.3 | 23.1 | 21.4 | 21.5 |
| 27.0 | 27.0 | 18.6 | 31.7 | 23.3 | 30.1 | 22.9 | 23.3 | 21.7 | 18.6 |
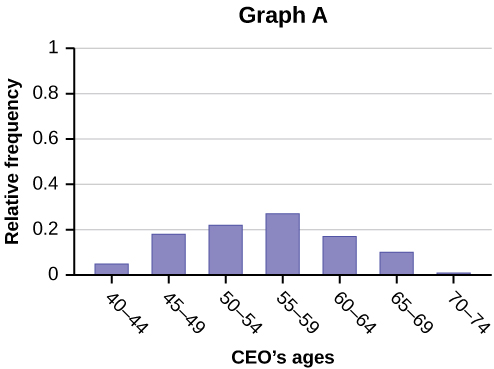
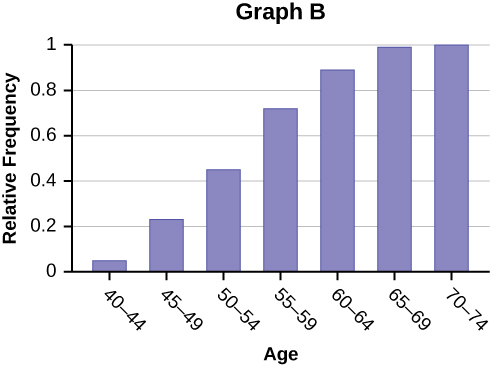
91. Forbes magazine published data on the best small firms in 2012. These were firms which had been publicly traded for at least a year, have a stock price of at least $5 per share, and have reported annual revenue between $5 million and $1 billion. The table below shows the ages of the chief executive officers for the first 60 ranked firms.
| Age | Frequency | Relative Frequency | Cumulative Relative Frequency |
|---|---|---|---|
| 40–44 | 3 | ||
| 45–49 | 11 | ||
| 50–54 | 13 | ||
| 55–59 | 16 | ||
| 60–64 | 10 | ||
| 65–69 | 6 | ||
| 70–74 | 1 |
- What is the frequency for CEO ages between 54 and 65?
- What percentage of CEOs are 65 years or older?
- What is the relative frequency of ages under 50?
- What is the cumulative relative frequency for CEOs younger than 55?
- Which graph shows the relative frequency and which shows the cumulative relative frequency?
Use the following information to answer the next two exercises: the table below contains data on hurricanes that have made direct hits on the U.S. Between 1851 and 2004. A hurricane is given a strength category rating based on the minimum wind speed generated by the storm.
| Category | Number of Direct Hits | Relative Frequency | Cumulative Frequency |
|---|---|---|---|
| Total = 273 | |||
| 1 | 109 | 0.3993 | 0.3993 |
| 2 | 72 | 0.2637 | 0.6630 |
| 3 | 71 | 0.2601 | |
| 4 | 18 | 0.9890 | |
| 5 | 3 | 0.0110 | 1.0000 |
92. What is the relative frequency of direct hits that were category 4 hurricanes?
- 0.0768
- 0.0659
- 0.2601
- Not enough information to calculate
93. What is the relative frequency of direct hits that were AT MOST a category 3 storm?
- 0.3480
- 0.9231
- 0.2601
- 0.3370
Experimental Design and Ethics
94. Design an experiment. Identify the explanatory and response variables. Describe the population being studied and the experimental units. Explain the treatments that will be used and how they will be assigned to the experimental units. Describe how blinding and placebos may be used to counter the power of suggestion.
95. Discuss potential violations of the rule requiring informed consent.
- Inmates in a correctional facility are offered good behavior credit in return for participation in a study.
- A research study is designed to investigate a new children’s allergy medication.
- Participants in a study are told that the new medication being tested is highly promising, but they are not told that only a small portion of participants will receive the new medication. Others will receive placebo treatments and traditional treatments.
96. How does sleep deprivation affect your ability to drive? A recent study measured the effects on 19 professional drivers. Each driver participated in two experimental sessions: one after normal sleep and one after 27 hours of total sleep deprivation. The treatments were assigned in random order. In each session, performance was measured on a variety of tasks including a driving simulation.
Use key terms from this module to describe the design of this experiment.
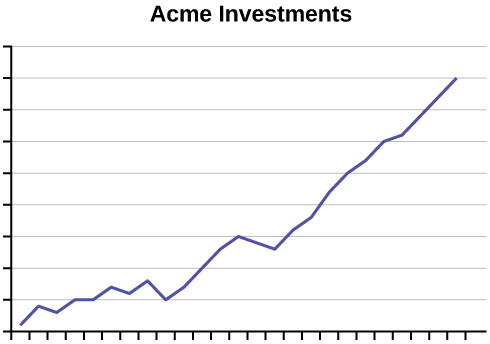
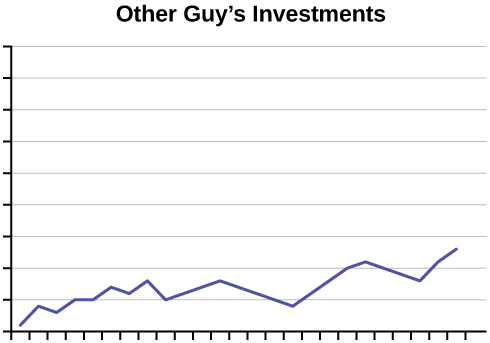
97. An advertisement for Acme Investments displays the two graphs in the figure below to show the value of Acme’s product in comparison with the Other Guy’s product. Describe the potentially misleading visual effect of these comparison graphs. How can this be corrected?
98. The graph in the figure below shows the number of complaints for six different airlines as reported to the US Department of Transportation in February 2013. Alaska, Pinnacle, and Airtran Airlines have far fewer complaints reported than American, Delta, and United. Can we conclude that American, Delta, and United are the worst airline carriers since they have the most complaints?