
Module 3: Probability
Section Exercises
Barbara Illowsky & OpenStax et al.
Terminology
1. In a particular college class, there are male and female students. Some students have long hair and some students have short hair. Write the symbols for the probabilities of the events for parts a through j. (Note that you cannot find numerical answers here. You were not given enough information to find any probability values yet; concentrate on understanding the symbols.)
- Let F be the event that a student is female.
- Let M be the event that a student is male.
- Let S be the event that a student has short hair.
- Let L be the event that a student has long hair.
- The probability that a student does not have long hair.
- The probability that a student is male or has short hair.
- The probability that a student is a female and has long hair.
- The probability that a student is male, given that the student has long hair.
- The probability that a student has long hair, given that the student is male.
- Of all the female students, the probability that a student has short hair.
- Of all students with long hair, the probability that a student is female.
- The probability that a student is female or has long hair.
- The probability that a randomly selected student is a male student with short hair.
- The probability that a student is female.
Use the following information to answer the next four exercises. A box is filled with several party favors. It contains 12 hats, 15 noisemakers, ten finger traps, and five bags of confetti.
Let H = the event of getting a hat.Let N = the event of getting a noisemaker.
Let F = the event of getting a finger trap.
2. Find P(H).
3. Find P(N).
5. Find P(C).
Let B = the event of getting a blue jelly bean
6. Find P(B).
7. Find P(G).
9. Find P(R).
11. Find P(O).
Use the following information to answer the next six exercises. There are 23 countries in North America, 12 countries in South America, 47 countries in Europe, 44 countries in Asia, 54 countries in Africa, and 14 in Oceania (Pacific Ocean region).
Let A = the event that a country is in Asia.
12. Find P(A).
13. Find P(E).
14. Find P(F).
15. Find P(N).
17. Find P(S).
Use the following information to answer the next two exercises. You see a game at a local fair. You have to throw a dart at a color wheel. Each section on the color wheel is equal in area.
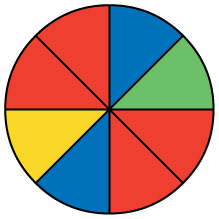
Let B = the event of landing on blue.
22. If you land on Y, you get the biggest prize. Find P(Y).
23. If you land on red, you don’t get a prize. What is P(R)?
Use the following information to answer the next ten exercises. On a baseball team, there are infielders and outfielders. Some players are great hitters, and some players are not great hitters.
24. Write the symbols for the probability that a player is not an outfielder.
26. Write the symbols for the probability that a player is an infielder and is not a great hitter.
27. Write the symbols for the probability that a player is a great hitter, given that the player is an infielder.
28. Write the symbols for the probability that a player is an infielder, given that the player is a great hitter.
31. Write the symbols for the probability that a player is an infielder or is not a great hitter.
33. Write the symbols for the probability that a player is an infielder.
b) What is the sum of the probabilities of an event and its complement?
37. What does P(E|M) mean in words?
38. What does P(E OR M) mean in words?
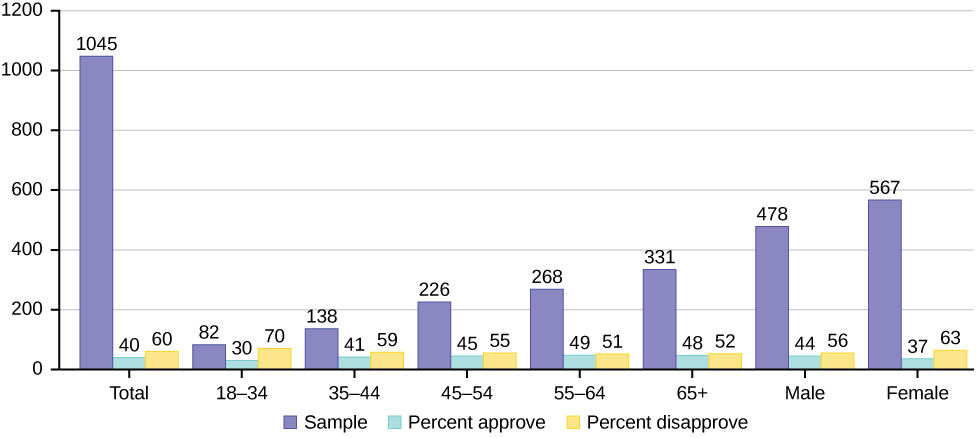
39. The graph in the figure displays the sample sizes and percentages of people in different age and gender groups who were polled concerning their approval of Mayor Ford’s actions in office. The total number in the sample of all the age groups is 1,045.
- Define three events in the graph.
- Describe in words what the entry 40 means.
- Describe in words the complement of the entry in question 2.
- Describe in words what the entry 30 means.
- Out of the males and females, what percent are males?
- Out of the females, what percent disapprove of Mayor Ford?
- Out of all the age groups, what percent approve of Mayor Ford?
- Find P(Approve|Male).
- Out of the age groups, what percent are more than 44 years old?
- Find P(Approve|Age < 35).
40. Explain what is wrong with the following statements. Use complete sentences.
- If there is a 60% chance of rain on Saturday and a 70% chance of rain on Sunday, then there is a 130% chance of rain over the weekend.
- The probability that a baseball player hits a home run is greater than the probability that he gets a successful hit.
Independent and Mutually Exclusive Events
41. E and F are mutually exclusive events. P(E) = 0.4; P(F) = 0.5. Find P(E∣F).
42. J and K are independent events. P(J|K) = 0.3. Find P(J).
- P(U AND V) =
- P(U|V) =
- P(U OR V) =
44. Q and R are independent events. P(Q) = 0.4 and P(Q AND R) = 0.1. Find P(R).
Use the following information to answer the next 12 exercises. The graph shown is based on more than 170,000 interviews done by Gallup that took place from January through December 2012. The sample consists of employed Americans 18 years of age or older. The Emotional Health Index Scores are the sample space. We randomly sample one Emotional Health Index Score.
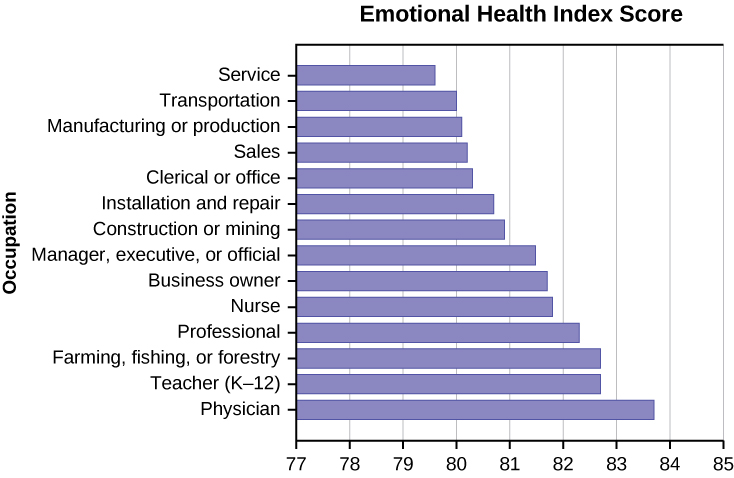
45. Find the probability that an Emotional Health Index Score is 82.7.
46. Find the probability that an Emotional Health Index Score is 81.0.
48. Find the probability that an Emotional Health Index Score is between 80.5 and 82?
52. What occupation has the highest emotional index score?
54. What is the range of the data?
56. If all occupations are equally likely for a certain individual, what is the probability that he or she will have an occupation with lower than average EHIS?
| Shirt# | ≤ 210 | 211–250 | 251–290 | 290≤ |
|---|---|---|---|---|
| 1–33 | 21 | 5 | 0 | 0 |
| 34–66 | 6 | 18 | 7 | 4 |
| 66–99 | 6 | 12 | 22 | 5 |
For the following, suppose that you randomly select one player from the 49ers or Cowboys.
57. If having a shirt number from one to 33 and weighing at most 210 pounds were independent events, then what should be true about P(Shirt# 1–33|≤ 210 pounds)?
58. The probability that a male develops some form of cancer in his lifetime is 0.4567. The probability that a male has at least one false positive test result (meaning the test comes back for cancer when the man does not have it) is 0.51. Some of the following questions do not have enough information for you to answer them. Write “not enough information” for those answers. Let C = a man develops cancer in his lifetime and P = man has at least one false positive.
- Find P(H OR G).
- Find the probability of the complement of event (H AND G).
- Find the probability of the complement of event (H OR G).
60. Given events J and K: P(J) = 0.18; P(K) = 0.37; P(J OR K) = 0.45
- Find P(J AND K).
- Find the probability of the complement of event (J AND K).
- Find the probability of the complement of event (J AND K).
Two Basic Rules of Probability
Use the following information to answer the next ten exercises. Forty-eight percent of all Californians registered voters prefer life in prison without parole over the death penalty for a person convicted of first degree murder. Among Latino California registered voters, 55% prefer life in prison without parole over the death penalty for a person convicted of first degree murder. 37.6% of all Californians are Latino.
In this problem, let:
Suppose that one Californian is randomly selected.
61. Find P(C).
62. Find P(L).
64. In words, what is C|L?
66. In words, what is L AND C?
68. Find P(L OR C).
70. Are L and C mutually exclusive events? Show why or why not.
In this problem, let:
- C = California registered voters who support same-sex marriage.
- B = California registered voters who say the Supreme Court’s ruling about the constitutionality of California’s Proposition 8 is very or somewhat important to them
- A = California registered voters who are 18 to 39 years old.
- Find P(C).
- Find P(B).
- Find P(C|A).
- Find P(B|C).
- In words, what is C|A?
- In words, what is B|C?
- Find P(C AND B).
- In words, what is C AND B?
- Find P(C OR B).
- Are C and B mutually exclusive events? Show why or why not.
72. After Rob Ford, the mayor of Toronto, announced his plans to cut budget costs in late 2011, the Forum Research polled 1,046 people to measure the mayor’s popularity. Everyone polled expressed either approval or disapproval. These are the results their poll produced:
- In early 2011, 60 percent of the population approved of Mayor Ford’s actions in office.
- In mid-2011, 57 percent of the population approved of his actions.
- In late 2011, the percentage of popular approval was measured at 42 percent.
- What is the sample size for this study?
- What proportion in the poll disapproved of Mayor Ford, according to the results from late 2011?
- How many people polled responded that they approved of Mayor Ford in late 2011?
- What is the probability that a person supported Mayor Ford, based on the data collected in mid-2011?
- What is the probability that a person supported Mayor Ford, based on the data collected in early 2011?
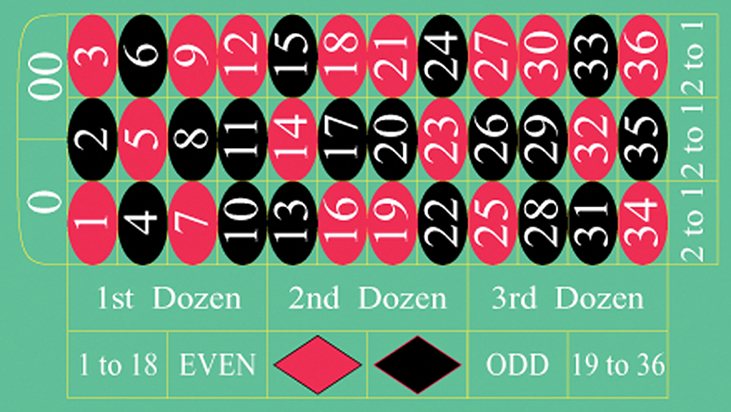
73.
- List the sample space of the 38 possible outcomes in roulette.
- You bet on red. Find P(red).
- You bet on -1st 12- (1st Dozen). Find P(-1st 12-).
- You bet on an even number. Find P(even number).
- Is getting an odd number the complement of getting an even number? Why?
- Find two mutually exclusive events.
- Are the events Even and 1st Dozen independent?
74. Compute the probability of winning the following types of bets:
- Betting on two lines that touch each other on the table as in 1-2-3-4-5-6
- Betting on three numbers in a line, as in 1-2-3
- Betting on one number
- Betting on four numbers that touch each other to form a square, as in 10-11-13-14
- Betting on two numbers that touch each other on the table, as in 10-11 or 10-13
- Betting on 0-00-1-2-3
- Betting on 0-1-2; or 0-00-2; or 00-2-3
- Betting on a color
- Betting on one of the dozen groups
- Betting on the range of numbers from 1 to 18
- Betting on the range of numbers 19–36
- Betting on one of the columns
- Betting on an even or odd number (excluding zero)
76. Suppose that you have eight cards. Five are green and three are yellow. The five green cards are numbered 1, 2, 3, 4, and 5. The three yellow cards are numbered 1, 2, and 3. The cards are well shuffled. You randomly draw one card.
- G = card drawn is green
- E = card drawn is even-numbered
- List the sample space.
- P(G) = _____
- P(G|E) = _____
- P(G AND E) = _____
- P(G OR E) = _____
- Are G and E mutually exclusive? Justify your answer numerically.
- List the sample space.
- Let A be the event that either a three or four is rolled first, followed by an even number. Find P(A).
- Let B be the event that the sum of the two rolls is at most seven. Find P(B).
- In words, explain what “P(A|B)” represents. Find P(A|B).
- Are A and B mutually exclusive events? Explain your answer in one to three complete sentences, including numerical justification.
- Are A and B independent events? Explain your answer in one to three complete sentences, including numerical justification.
78. A special deck of cards has ten cards. Four are green, three are blue, and three are red. When a card is picked, its color of it is recorded. An experiment consists of first picking a card and then tossing a coin.
- List the sample space.
- Let A be the event that a blue card is picked first, followed by landing a head on the coin toss. Find P(A).
- Let B be the event that a red or green is picked, followed by landing a head on the coin toss. Are the events A and B mutually exclusive? Explain your answer in one to three complete sentences, including numerical justification.
- Let C be the event that a red or blue is picked, followed by landing a head on the coin toss. Are the events A and C mutually exclusive? Explain your answer in one to three complete sentences, including numerical justification.
- List the sample space.
- Let A be the event that either a three or a four is rolled first, followed by landing a head on the coin toss. Find P(A).
- Let B be the event that the first and second tosses land on heads. Are the events A and B mutually exclusive? Explain your answer in one to three complete sentences, including numerical justification.
80. An experiment consists of tossing a nickel, a dime, and a quarter. Of interest is the side the coin lands on.
- List the sample space.
- Let A be the event that there are at least two tails. Find P(A).
- Let B be the event that the first and second tosses land on heads. Are the events A and B mutually exclusive? Explain your answer in one to three complete sentences, including justification.
Consider the following scenario:
Let P(C) = 0.4.
Let P(D) = 0.5.
Let P(C|D) = 0.6.
86. Y and Z are independent events.
- Rewrite the basic Addition Rule P(Y OR Z) = P(Y) + P(Z) – P(Y AND Z) using the information that Y and Z are independent events.
- Use the rewritten rule to find P(Z) if P(Y OR Z) = 0.71 and P(Y) = 0.42.
- Explain why the following statement MUST be false: P(H|G) = 0.4.
- Find P(H OR G).
- Are G and H independent or dependent events? Explain in a complete sentence.
88. Approximately 281,000,000 people over age five live in the United States. Of these people, 55,000,000 speak a language other than English at home. Of those who speak another language at home, 62.3% speak Spanish.
Let: E = speaks English at home; E′ = speaks another language at home; S = speaks Spanish;
Finish each probability statement by matching the correct answer.
| Probability Statements | Answers |
|---|---|
| a. P(E′) = | i. 0.8043 |
| b. P(E) = | ii. 0.623 |
| c. P(S and E′) = | iii. 0.1957 |
| d. P(S|E′) = | iv. 0.1219 |
89. 1994, the U.S. government held a lottery to issue 55,000 Green Cards (permits for non-citizens to work legally in the U.S.). Renate Deutsch, from Germany, was one of approximately 6.5 million people who entered this lottery. Let G = won green card.
- What was Renate’s chance of winning a Green Card? Write your answer as a probability statement.
- In the summer of 1994, Renate received a letter stating she was one of 110,000 finalists chosen. Once the finalists were chosen, assuming that each finalist had an equal chance to win, what was Renate’s chance of winning a Green Card? Write your answer as a conditional probability statement. Let F = was a finalist.
- Are G and F independent or dependent events? Justify your answer numerically and also explain why.
- Are G and F mutually exclusive events? Justify your answer numerically and explain why.
90. Three professors at George Washington University did an experiment to determine if economists are more selfish than other people. They dropped 64 stamped, addressed envelopes with $10 cash in different classrooms on the George Washington campus. 44% were returned overall. From the economics classes 56% of the envelopes were returned. From the business, psychology, and history classes 31% were returned.
Let: R = money returned; E = economics classes; O = other classes
- Write a probability statement for the overall percent of money returned.
- Write a probability statement for the percent of money returned out of the economics classes.
- Write a probability statement for the percent of money returned out of the other classes.
- Is money being returned independent of the class? Justify your answer numerically and explain it.
- Based upon this study, do you think that economists are more selfish than other people? Explain why or why not. Include numbers to justify your answer.
| Name | Single | Double | Triple | Home Run | Total Hits |
|---|---|---|---|---|---|
| Babe Ruth | 1,517 | 506 | 136 | 714 | 2,873 |
| Jackie Robinson | 1,054 | 273 | 54 | 137 | 1,518 |
| Ty Cobb | 3,603 | 174 | 295 | 114 | 4,189 |
| Hank Aaron | 2,294 | 624 | 98 | 755 | 3,771 |
| Total | 8,471 | 1,577 | 583 | 1,720 | 12,351 |
Are “the hit being made by Hank Aaron” and “the hit being a double” independent events?
- Yes, because P(hit by Hank Aaron|hit is a double) = P(hit by Hank Aaron)
- No, because P(hit by Hank Aaron|hit is a double) ≠ P(hit is a double)
- No, because P(hit is by Hank Aaron|hit is a double) ≠ P(hit by Hank Aaron)
- Yes, because P(hit is by Hank Aaron|hit is a double) = P(hit is a double)
- Find the probability that a person has both type O blood and the Rh- factor.
- Find the probability that a person does NOT have both type O blood and the Rh- factor.
- Find the probability that a course has a final exam or a research project.
- Find the probability that a course has NEITHER of these two requirements.
94. In a box of assorted cookies, 36% contain chocolate and 12% contain nuts. Of those, 8% contain both chocolate and nuts. Sean is allergic to both chocolate and nuts.
- Find the probability that a cookie contains chocolate or nuts (he can’t eat it).
- Find the probability that a cookie does not contain chocolate or nuts (he can eat it).
- Find P(D AND E).
- Find P(E|D).
- Find P(D OR E).
- Using an appropriate test, show whether D and E are independent.
- Using an appropriate test, show whether D and E are mutually exclusive.
Contingency Tables
Use the following information to answer the next four exercises. The table shows a random sample of musicians and how they learned to play their instruments.
| Gender | Self-taught | Studied in School | Private Instruction | Total |
|---|---|---|---|---|
| Female | 12 | 38 | 22 | 72 |
| Male | 19 | 24 | 15 | 58 |
| Total | 31 | 62 | 37 | 130 |
96. Find P(musician is a female).
97. Find P(musician is a male AND had private instruction).
100.Complete the table using the data provided. Suppose that one person from the study is randomly selected. Find the probability that person smoked 11 to 20 cigarettes per day.
| Smoking Level | African American | Native Hawaiian | Latino | Japanese Americans | White | TOTALS |
|---|---|---|---|---|---|---|
| 1–10 | ||||||
| 11–20 | ||||||
| 21–30 | ||||||
| 31+ | ||||||
| TOTALS |
101. Suppose that one person from the study is randomly selected. Find the probability that person smoked 11 to 20 cigarettes per day. Find the probability that the person was Latino.
104. In words, explain what it means to pick one person from the study who is “Japanese American GIVEN that person smokes 21 to 30 cigarettes per day.” Also, find the probability.
105. Prove that smoking level/day and ethnicity are dependent events.
Use the information in the Table to answer the next eight exercises. The table shows the political party affiliation of each of 67 members of the US Senate in June 2012, and when they are up for reelection.
| Up for reelection: | Democratic Party | Republican Party | Other | Total |
|---|---|---|---|---|
| November 2014 | 20 | 13 | 0 | |
| November 2016 | 10 | 24 | 0 | |
| Total |
106. What is the probability that a randomly selected senator has an “Other” affiliation?
108. What is the probability that a randomly selected senator is a Democrat and up for reelection in November 2016?
110. Suppose that a member of the US Senate is randomly selected. Given that the randomly selected senator is up for reelection in November 2016, what is the probability that this senator is a Democrat?
- mutually exclusive.
- independent.
- both mutually exclusive and independent.
- neither mutually exclusive nor independent.
113. The events “Other” and “Up for reelection in November 2016” are ________
- mutually exclusive.
- independent.
- both mutually exclusive and independent.
- neither mutually exclusive nor independent.
| Race and Sex | 1–14 | 15–24 | 25–64 | over 64 | TOTALS |
|---|---|---|---|---|---|
| white, male | 210 | 3,360 | 13,610 | 22,050 | |
| white, female | 80 | 580 | 3,380 | 4,930 | |
| black, male | 10 | 460 | 1,060 | 1,670 | |
| black, female | 0 | 40 | 270 | 330 | |
| all others | |||||
| TOTALS | 310 | 4,650 | 18,780 | 29,760 |
Do not include “all others” for parts f and g.
| NAME | Single | Double | Triple | Home Run | TOTAL HITS |
|---|---|---|---|---|---|
| Babe Ruth | 1,517 | 506 | 136 | 714 | 2,873 |
| Jackie Robinson | 1,054 | 273 | 54 | 137 | 1,518 |
| Ty Cobb | 3,603 | 174 | 295 | 114 | 4,189 |
| Hank Aaron | 2,294 | 624 | 98 | 755 | 3,771 |
| TOTAL | 8,471 | 1,577 | 583 | 1,720 | 12,351 |
- 15182873
- 287312351
- 58312351
- 418912351
122. Find P(hit was made by Ty Cobb|The hit was a Home Run).
- 418912351
- 1141720
- 17204189
- 11412351
| Hair Type | Brown | Blond | Black | Red | Totals |
|---|---|---|---|---|---|
| Wavy | 20 | 15 | 3 | 43 | |
| Straight | 80 | 15 | 12 | ||
| Totals | 20 | 215 |
- Complete the table.
- What is the probability that a randomly selected child will have wavy hair?
- What is the probability that a randomly selected child will have either brown or blond hair?
- What is the probability that a randomly selected child will have wavy brown hair?
- What is the probability that a randomly selected child will have red hair, given that he or she has straight hair?
- If B is the event of a child having brown hair, find the probability of the complement of B.
- In words, what does the complement of B represent?
124. In a previous year, the weights of the members of the San Francisco 49ers and the Dallas Cowboys were published in the San Jose Mercury News. The factual data were compiled into the following table.
| Shirt# | ≤ 210 | 211–250 | 251–290 | > 290 |
|---|---|---|---|---|
| 1–33 | 21 | 5 | 0 | 0 |
| 34–66 | 6 | 18 | 7 | 4 |
| 66–99 | 6 | 12 | 22 | 5 |
For the following, suppose that you randomly select one player from the 49ers or Cowboys.
Tree and Venn Diagrams
Use the following information to answer the next two exercises. This tree diagram shows the tossing of an unfair coin followed by drawing one bead from a cup containing three red (R), four yellow (Y) and five blue (B) beads. For the coin, P(H) = 23 and P(T) = 13 where H is heads and T is tails.
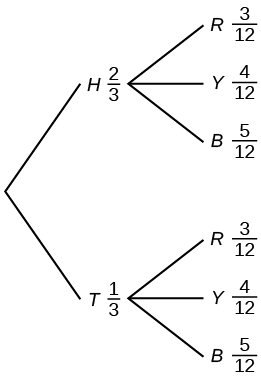
131. Find P(tossing a Head on the coin AND a Red bead)
- 23
- 515
- 636
- 536
132. Find P(Blue bead).
- 1536
- 1036
- 1012
- 636
- Draw the tree that represents the possibilities for the cookie selections. Write the probabilities along each branch of the tree.
- Are the probabilities for the flavor of the SECOND cookie that Miguel selects independent of his first selection? Explain.
- For each complete path through the tree, write the event it represents and find the probabilities.
- Let S be the event that both cookies selected were the same flavor. Find P(S).
- Let T be the event that the cookies selected were different flavors. Find P(T) by two different methods: by using the complement rule and by using the branches of the tree. Your answers should be the same with both methods.
- Let U be the event that the second cookie selected is a butter cookie. Find P(U).
Use the following information to answer the next two exercises. Suppose that you have eight cards. Five are green and three are yellow. The cards are well shuffled.
134. Suppose that you randomly draw two cards, one at a time, with replacement.
Let G1 = first card is green
Let G2 = second card is green
- Draw a tree diagram of the situation.
- Find P(G1 AND G2).
- Find P(at least one green).
- Find P(G2|G1).
- Are G2 and G1 independent events? Explain why or why not.
G1 = first card is green
G2 = second card is green
- Draw a tree diagram of the situation.
- Find P(G1 AND G2).
- Find P(at least one green).
- Find P(G2|G1).
- Are G2 and G1 independent events? Explain why or why not.
Use the following information to answer the next two exercises. The percent of licensed U.S. drivers (from a recent year) that are female is 48.60. Of the females, 5.03% are age 19 and under; 81.36% are age 20–64; 13.61% are age 65 or over. Of the licensed U.S. male drivers, 5.04% are age 19 and under; 81.43% are age 20–64; 13.53% are age 65 or over.
136. Complete the following.
- Construct a table or a tree diagram of the situation.
- Find P(driver is female).
- Find P(driver is age 65 or over|driver is female).
- Find P(driver is age 65 or over AND female).
- In words, explain the difference between the probabilities in part c and part d.
- Find P(driver is age 65 or over).
- Are being age 65 or over and being female mutually exclusive events? How do you know?
137. Suppose that 10,000 U.S. licensed drivers are randomly selected.
- How many would you expect to be male?
- Using the table or tree diagram, construct a contingency table of gender versus age group.
- Using the contingency table, find the probability that out of the age 20–64 group, a randomly selected driver is female.
138. Approximately 86.5% of Americans commute to work by car, truck, or van. Out of that group, 84.6% drive alone and 15.4% drive in a carpool. Approximately 3.9% walk to work and approximately 5.3% take public transportation.
- Construct a table or a tree diagram of the situation. Include a branch for all other modes of transportation to work.
- Assuming that the walkers walk alone, what percent of all commuters travel alone to work?
- Suppose that 1,000 workers are randomly selected. How many would you expect to travel alone to work?
- Suppose that 1,000 workers are randomly selected. How many would you expect to drive in a carpool?
139. When the Euro coin was introduced in 2002, two math professors had their statistics students test whether the Belgian one Euro coin was a fair coin. They spun the coin rather than tossing it and found that out of 250 spins, 140 showed a head (event H) while 110 showed a tail (event T). On that basis, they claimed that it is not a fair coin.
- Based on the given data, find P(H) and P(T).
- Use a tree to find the probabilities of each possible outcome for the experiment of tossing the coin twice.
- Use the tree to find the probability of obtaining exactly one head in two tosses of the coin.
- Use the tree to find the probability of obtaining at least one head.
Use the following information to answer the next two exercises. The following are real data from Santa Clara County, CA. As of a certain time, there had been a total of 3,059 documented cases of AIDS in the county. They were grouped into the following categories:
| Homosexual/Bisexual | IV Drug User* | Heterosexual Contact | Other | Totals | |
|---|---|---|---|---|---|
| Female | 0 | 70 | 136 | 49 | ____ |
| Male | 2,146 | 463 | 60 | 135 | ____ |
| Totals | ____ | ____ | ____ | ____ | ____ |
140. Suppose a person with AIDS in Santa Clara County is randomly selected.
- Find P(Person is female).
- Find P(Person has a risk factor heterosexual contact).
- Find P(Person is female OR has a risk factor of IV drug user).
- Find P(Person is female AND has a risk factor of homosexual/bisexual).
- Find P(Person is male AND has a risk factor of IV drug user).
- Find P(Person is female GIVEN person got the disease from heterosexual contact).
- Construct a Venn diagram. Make one group females and the other group heterosexual contact.
141. Answer these questions using probability rules. Do NOT use the contingency table. Three thousand fifty-nine cases of AIDS had been reported in Santa Clara County, CA, through a certain date. Those cases will be our population. Of those cases, 6.4% obtained the disease through heterosexual contact and 7.4% are female. Out of the females with the disease, 53.3% got the disease from heterosexual contact.
- Find P(Person is female).
- Find P(Person obtained the disease through heterosexual contact).
- Find P(Person is female GIVEN person got the disease from heterosexual contact)
- Construct a Venn diagram representing this situation. Make one group females and the other group heterosexual contact. Fill in all values as probabilities.
