
Module 9: Hypothesis Testing With One Sample
Section Exercises
Barbara Illowsky & OpenStax et al.
Null and Alternative Hypotheses
1. You are testing that the mean speed of your cable Internet connection is more than three Megabits per second. What is the random variable? Describe in words.
5. A sociologist claims the probability that a person picked at random in Times Square in New York City is visiting the area is 0.83. You want to test to see if the claim is correct. State the null and alternative hypotheses.
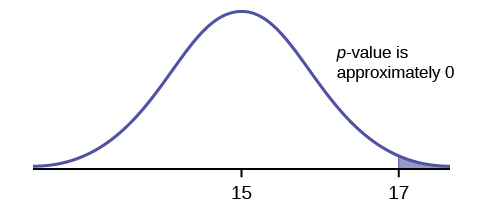
8. A random survey of 75 death row inmates revealed that the mean length of time on death row is 17.4 years with a standard deviation of 6.3 years. If you were conducting a hypothesis test to determine if the population mean time on death row could likely be 15 years, what would the null and alternative hypotheses be?
- H0: __________
- Ha: __________
10. Some of the following statements refer to the null hypothesis, some to the alternate hypothesis. State the null hypothesis, H0, and the alternative hypothesis. Ha, in terms of the appropriate parameter (μ or p).
- The mean number of years Americans work before retiring is 34.
- At most 60% of Americans vote in presidential elections.
- The mean starting salary for San Jose State University graduates is at least $100,000 per year.
- Twenty-nine percent of high school seniors get drunk each month.
- Fewer than 5% of adults ride the bus to work in Los Angeles.
- The mean number of cars a person owns in her lifetime is not more than ten.
- About half of Americans prefer to live away from cities, given the choice.
- Europeans have a mean paid vacation each year of six weeks.
- The chance of developing breast cancer is under 11% for women.
- Private universities’ mean tuition cost is more than $20,000 per year.
11. Over the past few decades, public health officials have examined the link between weight concerns and teen girls’ smoking. Researchers surveyed a group of 273 randomly selected teen girls living in Massachusetts (between 12 and 15 years old). After four years the girls were surveyed again. Sixty-three said they smoked to stay thin. Is there good evidence that more than thirty percent of the teen girls smoke to stay thin? The alternative hypothesis is:
- p < 0.30
- p ≤ 0.30
- p ≥ 0.30
- p > 0.30
12. A statistics instructor believes that fewer than 20% of Evergreen Valley College (EVC) students attended the opening night midnight showing of the latest Harry Potter movie. She surveys 84 of her students and finds that 11 attended the midnight showing. An appropriate alternative hypothesis is:
- p = 0.20
- p > 0.20
- p < 0.20
- p ≤ 0.20
13. Previously, an organization reported that teenagers spent 4.5 hours per week, on average, on the phone. The organization thinks that, currently, the mean is higher. Fifteen randomly chosen teenagers were asked how many hours per week they spend on the phone. The sample mean was 4.75 hours with a sample standard deviation of 2.0. Conduct a hypothesis test. The null and alternative hypotheses are:
- Ho:[latex]overline{x}[/latex] = 4.5, Ha :[latex]overline{x}[/latex] > 4.5
- Ho: μ ≥ 4.5, Ha: μ < 4.5
- Ho: μ = 4.75, Ha: μ > 4.75
- Ho: μ = 4.5, Ha: μ > 4.5
Outcomes and the Type I and Type II Errors
14. The mean price of mid-sized cars in a region is $32,000. A test is conducted to see if the claim is true. State the Type I and Type II errors in complete sentences.
15. A sleeping bag is tested to withstand temperatures of –15 °F. You think the bag cannot stand temperatures that low. State the Type I and Type II errors in complete sentences.
16. A group of doctors is deciding whether or not to perform an operation. Suppose the null hypothesis, H0, is: the surgical procedure will go well. State the Type I and Type II errors in complete sentences.
17.A group of doctors is deciding whether or not to perform an operation. Suppose the null hypothesis, H0, is: the surgical procedure will go well. Which is the error with the greater consequence?
19. A group of divers is exploring an old sunken ship. Suppose the null hypothesis, H0, is: the sunken ship does not contain buried treasure. State the Type I and Type II errors in complete sentences.
21. A microbiologist is testing a water sample for E-coli. Suppose the null hypothesis, H0, is: the sample does not contain E-coli. The probability that the sample does not contain E-coli, but the microbiologist thinks it does is 0.012. The probability that the sample does contain E-coli, but the microbiologist thinks it does not is 0.002. What is the power of this test?
- The mean number of years Americans work before retiring is 34.
- At most 60% of Americans vote in presidential elections.
- The mean starting salary for San Jose State University graduates is at least $100,000 per year.
- Twenty-nine percent of high school seniors get drunk each month.
- Fewer than 5% of adults ride the bus to work in Los Angeles.
- The mean number of cars a person owns in his or her lifetime is not more than ten.
- About half of Americans prefer to live away from cities, given the choice.
- Europeans have a mean paid vacation each year of six weeks.
- The chance of developing breast cancer is under 11% for women.
- Private universities mean tuition cost is more than $20,000 per year.
- State a consequence of committing a Type I error.
- State a consequence of committing a Type II error.
25. When a new drug is created, the pharmaceutical company must subject it to testing before receiving the necessary permission from the Food and Drug Administration (FDA) to market the drug. Suppose the null hypothesis is “the drug is unsafe.” What is the Type II Error?
- To conclude the drug is safe when in, fact, it is unsafe.
- Not to conclude the drug is safe when, in fact, it is safe.
- To conclude the drug is safe when, in fact, it is safe.
- Not to conclude the drug is unsafe when, in fact, it is unsafe.
26. A statistics instructor believes that fewer than 20% of Evergreen Valley College (EVC) students attended the opening midnight showing of the latest Harry Potter movie. She surveys 84 of her students and finds that 11 of them attended the midnight showing. The Type I error is to conclude that the percent of EVC students who attended is ________.
- at least 20%, when in fact, it is less than 20%.
- 20%, when in fact, it is 20%.
- less than 20%, when in fact, it is at least 20%.
- less than 20%, when in fact, it is less than 20%.
27. It is believed that Lake Tahoe Community College (LTCC) Intermediate Algebra students get less than seven hours of sleep per night, on average. A survey of 22 LTCC Intermediate Algebra students generated a mean of 7.24 hours with a standard deviation of 1.93 hours. At a level of significance of 5%, do LTCC Intermediate Algebra students get less than seven hours of sleep per night, on average?
28. The Type II error is not to reject that the mean number of hours of sleep LTCC students get per night is at least seven when, in fact, the mean number of hours
- is more than seven hours.
- is at most seven hours.
- is at least seven hours.
- is less than seven hours.
29. Previously, an organization reported that teenagers spent 4.5 hours per week, on average, on the phone. The organization thinks that, currently, the mean is higher. Fifteen randomly chosen teenagers were asked how many hours per week they spend on the phone. The sample mean was 4.75 hours with a sample standard deviation of 2.0. Conduct a hypothesis test, the Type I error is:
- to conclude that the current mean hours per week is higher than 4.5, when in fact, it is higher
- to conclude that the current mean hours per week is higher than 4.5, when in fact, it is the same
- to conclude that the mean hours per week currently is 4.5, when in fact, it is higher
- to conclude that the mean hours per week currently is no higher than 4.5, when in fact, it is not higher
Distribution Needed for Hypothesis Testing
31. Which distribution do you use when you are testing a population mean and the standard deviation is known? Assume sample size is large.
34. A population has a mean is 25 and a standard deviation of five. The sample mean is 24, and the sample size is 108. What distribution should you use to perform a hypothesis test?
35. It is thought that 42% of respondents in a taste test would prefer Brand A. In a particular test of 100 people, 39% preferred Brand A. What distribution should you use to perform a hypothesis test?
36. You are performing a hypothesis test of a single population mean using a Student’s t-distribution. What must you assume about the distribution of the data?
37. You are performing a hypothesis test of a single population mean using a Student’s t-distribution. The data are not from a simple random sample. Can you accurately perform the hypothesis test?
38. You are performing a hypothesis test of a single population proportion. What must be true about the quantities of np and nq?
40. You are performing a hypothesis test of a single population proportion. The data come from which distribution?
41. It is believed that Lake Tahoe Community College (LTCC) Intermediate Algebra students get less than seven hours of sleep per night, on average. A survey of 22 LTCC Intermediate Algebra students generated a mean of 7.24 hours with a standard deviation of 1.93 hours. At a level of significance of 5%, do LTCC Intermediate Algebra students get less than seven hours of sleep per night, on average? The distribution to be used for this test is[latex]overline{X}[/latex] ~ ________________
- N[latex]left(7.24,frac{{1.93}}{{sqrt{22}}}right)[/latex]
- N(7.24,1.93)
- t22
- t21
Rare Events, the Sample, Decision and Conclusion
42. When do you reject the null hypothesis?
43. The probability of winning the grand prize at a particular carnival game is 0.005. Is the outcome of winning very likely or very unlikely?
44. The probability of winning the grand prize at a particular carnival game is 0.005. Michele wins the grand prize. Is this considered a rare or common event? Why?
45. It is believed that the mean height of high school students who play basketball on the school team is 73 inches with a standard deviation of 1.8 inches. A random sample of 40 players is chosen. The sample mean was 71 inches, and the sample standard deviation was 1.5 years. Do the data support the claim that the mean height is less than 73 inches? The p-value is almost zero. State the null and alternative hypotheses and interpret the p-value.
46. The mean age of graduate students at a University is at most 31 y ears with a standard deviation of two years. A random sample of 15 graduate students is taken. The sample mean is 32 years and the sample standard deviation is three years. Are the data significant at the 1% level? The p-value is 0.0264. State the null and alternative hypotheses and interpret the p-value.
47. Does the shaded region represent a low or a high p-value compared to a level of significance of 1%?
48. What should you do when α > p-value?
49. What should you do if α = p-value?
50. If you do not reject the null hypothesis, then it must be true. Is this statement correct? State why or why not in complete sentences.
Use the following information to answer the next seven exercises: Suppose that a recent article stated that the mean time spent in jail by a first-time convicted burglar is 2.5 years. A study was then done to see if the mean time has increased in the new century. A random sample of 26 first-time convicted burglars in a recent year was picked. The mean length of time in jail from the survey was three years with a standard deviation of 1.8 years. Suppose that it is somehow known that the population standard deviation is 1.5. Conduct a hypothesis test to determine if the mean length of jail time has increased. Assume the distribution of the jail times is approximately normal.
51. Is this a test of means or proportions?
52. What symbol represents the random variable for this test?
53. In words, define the random variable for this test.
54. Is the population standard deviation known and, if so, what is it?
55. Calculate the following:
57. State the distribution to use for the hypothesis test.
58. A random survey of 75 death row inmates revealed that the mean length of time on death row is 17.4 years with a standard deviation of 6.3 years. Conduct a hypothesis test to determine if the population mean time on death row could likely be 15 years.
- Is this a test of one mean or proportion?
- State the null and alternative hypotheses.
H0: ____________________ Ha : ____________________
- Is this a right-tailed, left-tailed, or two-tailed test?
- What symbol represents the random variable for this test?
- In words, define the random variable for this test.
- Is the population standard deviation known and, if so, what is it?
- Calculate the following:
- [latex]overline{x}[/latex]= _____________
- s = ____________
- n = ____________
- Which test should be used?
- State the distribution to use for the hypothesis test.
- Find the p-value.
- At a pre-conceived α = 0.05, what is your:
- Decision:
- Reason for the decision:
- Conclusion (write out in a complete sentence):
59. The National Institute of Mental Health published an article stating that in any one-year period, approximately 9.5 percent of American adults suffer from depression or a depressive illness. Suppose that in a survey of 100 people in a certain town, seven of them suffered from depression or a depressive illness. Conduct a hypothesis test to determine if the true proportion of people in that town suffering from depression or a depressive illness is lower than the percent in the general adult American population.
- Is this a test of one mean or proportion?
- State the null and alternative hypotheses.
H0: ____________________ Ha: ____________________
- Is this a right-tailed, left-tailed, or two-tailed test?
- What symbol represents the random variable for this test?
- In words, define the random variable for this test.
- Calculate the following:
- x = ________________
- n = ________________
- p′ = _____________
- Calculate σx = __________. Show the formula set-up.
- State the distribution to use for the hypothesis test.
- Find the p-value.
- At a pre-conceived α = 0.05, what is your:
- Decision:
- Reason for the decision:
- Conclusion (write out in a complete sentence):
Additional Information and Full Hypothesis Test Examples
60. Assume H0: μ = 9 and Ha: μ < 9. Is this a left-tailed, right-tailed, or two-tailed test?
62. Assume H0: p = 0.25 and Ha: p ≠ 0.25. Is this a left-tailed, right-tailed, or two-tailed test?
64. Draw the graph of a two-tailed test.
68. You flip a coin and record whether it shows heads or tails. You know the probability of getting heads is 50%, but you think it is less for this particular coin. What type of test would you use?
70. Assume the null hypothesis states that the mean is at least 18. Is this a left-tailed, right-tailed, or two-tailed test?
72. Assume the null hypothesis states that the mean is equal to 88. The alternative hypothesis states that the mean is not equal to 88. Is this a left-tailed, right-tailed, or two-tailed test?
For each of the word problems, use a solution sheet to do the hypothesis test. The solution sheet is found in [link]. Please feel free to make copies of the solution sheets. For the online version of the book, it is suggested that you copy the .doc or the .pdf files.
If you are using a Student’s-t distribution for one of the following homework problems, you may assume that the underlying population is normally distributed. (In general, you must first prove that assumption, however.)
73. A particular brand of tires claims that its deluxe tire averages at least 50,000 miles before it needs to be replaced. From past studies of this tire, the standard deviation is known to be 8,000. A survey of owners of that tire design is conducted. From the 28 tires surveyed, the mean lifespan was 46,500 miles with a standard deviation of 9,800 miles. Using alpha = 0.05, is the data highly inconsistent with the claim?
75. The cost of a daily newspaper varies from city to city. However, the variation among prices remains steady with a standard deviation of 20¢. A study was done to test the claim that the mean cost of a daily newspaper is $1.00. Twelve costs yield a mean cost of 95¢ with a standard deviation of 18¢. Do the data support the claim at the 1% level?
76. An article in the San Jose Mercury News stated that students in the California state university system take 4.5 years, on average, to finish their undergraduate degrees. Suppose you believe that the mean time is longer. You conduct a survey of 49 students and obtain a sample mean of 5.1 with a sample standard deviation of 1.2. Do the data support your claim at the 1% level?
78. In 1955, Life Magazine reported that the 25 year-old mother of three worked, on average, an 80 hour week. Recently, many groups have been studying whether or not the women’s movement has, in fact, resulted in an increase in the average work week for women (combining employment and at-home work). Suppose a study was done to determine if the mean work week has increased. 81 women were surveyed with the following results. The sample mean was 83; the sample standard deviation was ten. Does it appear that the mean work week has increased for women at the 5% level?
79. Your statistics instructor claims that 60 percent of the students who take her Elementary Statistics class go through life feeling more enriched. For some reason that she can’t quite figure out, most people don’t believe her. You decide to check this out on your own. You randomly survey 64 of her past Elementary Statistics students and find that 34 feel more enriched as a result of her class. Now, what do you think?
83. The mean work week for engineers in a start-up company is believed to be about 60 hours. A newly hired engineer hopes that it’s shorter. She asks ten engineering friends in start-ups for the lengths of their mean work weeks. Based on the results that follow, should she count on the mean work week to be shorter than 60 hours?
Data (length of mean work week): 70; 45; 55; 60; 65; 55; 55; 60; 50; 55.
85. Sixty-eight percent of online courses taught at community colleges nationwide were taught by full-time faculty. To test if 68% also represents California’s percent for full-time faculty teaching the online classes, Long Beach City College (LBCC) in California, was randomly selected for comparison. In the same year, 34 of the 44 online courses LBCC offered were taught by full-time faculty. Conduct a hypothesis test to determine if 68% represents California. NOTE: For more accurate results, use more California community colleges and this past year’s data.
86. According to an article in Bloomberg Businessweek, New York City’s most recent adult smoking rate is 14%. Suppose that a survey is conducted to determine this year’s rate. Nine out of 70 randomly chosen N.Y. City residents reply that they smoke. Conduct a hypothesis test to determine if the rate is still 14% or if it has decreased.
90. Over the past few decades, public health officials have examined the link between weight concerns and teen girls’ smoking. Researchers surveyed a group of 273 randomly selected teen girls living in Massachusetts (between 12 and 15 years old). After four years the girls were surveyed again. Sixty-three said they smoked to stay thin. Is there good evidence that more than thirty percent of the teen girls smoke to stay thin?
After conducting the test, your decision and conclusion are
- Reject H0: There is sufficient evidence to conclude that more than 30% of teen girls smoke to stay thin.
- Do not reject H0: There is not sufficient evidence to conclude that less than 30% of teen girls smoke to stay thin.
- Do not reject H0: There is not sufficient evidence to conclude that more than 30% of teen girls smoke to stay thin.
- Reject H0: There is sufficient evidence to conclude that less than 30% of teen girls smoke to stay thin.
91. A statistics instructor believes that fewer than 20% of Evergreen Valley College (EVC) students attended the opening night midnight showing of the latest Harry Potter movie. She surveys 84 of her students and finds that 11 of them attended the midnight showing.
At a 1% level of significance, an appropriate conclusion is:
- There is insufficient evidence to conclude that the percent of EVC students who attended the midnight showing of Harry Potter is less than 20%.
- There is sufficient evidence to conclude that the percent of EVC students who attended the midnight showing of Harry Potter is more than 20%.
- There is sufficient evidence to conclude that the percent of EVC students who attended the midnight showing of Harry Potter is less than 20%.
- There is insufficient evidence to conclude that the percent of EVC students who attended the midnight showing of Harry Potter is at least 20%.
92. Previously, an organization reported that teenagers spent 4.5 hours per week, on average, on the phone. The organization thinks that, currently, the mean is higher. Fifteen randomly chosen teenagers were asked how many hours per week they spend on the phone. The sample mean was 4.75 hours with a sample standard deviation of 2.0. Conduct a hypothesis test.
At a significance level of a = 0.05, what is the correct conclusion?
- There is enough evidence to conclude that the mean number of hours is more than 4.75
- There is enough evidence to conclude that the mean number of hours is more than 4.5
- There is not enough evidence to conclude that the mean number of hours is more than 4.5
- There is not enough evidence to conclude that the mean number of hours is more than 4.75
Instructions, Hypothesis testing: For the following ten exercises, answer each question.
- State the null and alternate hypothesis.
- State the p-value.
- State alpha.
- What is your decision?
- Write a conclusion.
- Answer any other questions asked in the problem.
93. According to the Center for Disease Control website, in 2011 at least 18% of high school students have smoked a cigarette. An Introduction to Statistics class in Davies County, KY conducted a hypothesis test at the local high school (a medium sized–approximately 1,200 students–small city demographic) to determine if the local high school’s percentage was lower. One hundred fifty students were chosen at random and surveyed. Of the 150 students surveyed, 82 have smoked. Use a significance level of 0.05 and using appropriate statistical evidence, conduct a hypothesis test and state the conclusions.
96. The US Department of Energy reported that 51.7% of homes were heated by natural gas. A random sample of 221 homes in Kentucky found that 115 were heated by natural gas. Does the evidence support the claim for Kentucky at the α = 0.05 level in Kentucky? Are the results applicable across the country? Why?
100. A report by the Gallup Poll found that a woman visits her doctor, on average, at most 5.8 times each year. A random sample of 20 women results in these yearly visit totals
3 2 1 3 7 2 9 4 6 6 8 0 5 6 4 2 1 3 4 1
At the α = 0.05 level can it be concluded that the sample mean is higher than 5.8 visits per year?
5 4 5 4 4 3 6 4 3 3 5 5 6 3 3 2 7 4 5 2 2 2 3 2
At α = 0.05 level, is the class’ mean family size greater than the national average? Does the Almanac result remain valid? Why?
102. The student academic group on a college campus claims that freshman students study at least 2.5 hours per day, on average. One Introduction to Statistics class was skeptical. The class took a random sample of 30 freshman students and found a mean study time of 137 minutes with a standard deviation of 45 minutes. At α = 0.01 level, is the student academic group’s claim correct?
