10.1 Budgeting Basics
The Basics of Budgeting
All companies—large and small—have limits on the amount of money or resources they can receive and pay out. How these resources are used to reach their goals and objectives must be planned. The quantitative plan estimating when and how much cash or other resources will be received and when and how the cash or other resources will be used is the budget. As you’ve learned, some of the benefits of budgeting include improved communication, planning, coordination, and evaluation.
All budgets are quantitative plans for the future and will be constructed based on the needs of the organization for which the budget is being created. Depending on the complexity, some budgets can take months or even years to develop. The most common time period covered by a budget is one year, although the time period may vary from strategic, long-term budgets to very detailed, short-term budgets. Generally, the closer the company is to the start of the budget’s time period, the more detailed the budget becomes.
Management begins with a vision of the future. The long-term vision sets the direction of the company. The vision develops into goals and strategies that are built into the budget and are directly or indirectly reflected on the master budget.
The master budget has two major categories: the financial budget and the operating budget. The financial budget plans the use of assets and liabilities and results in a projected balance sheet. The operating budget helps plan future revenue and expenses and results in a projected income statement. The operating budget has several subsidiary budgets that all begin with projected sales. For example, management estimates sales for the upcoming few years. It then breaks down estimated sales into quarters, months, and weeks and prepares the sales budget. The sales budget is the foundation for other operating budgets. Management uses the number of units from the sales budget and the company’s inventory policy to determine how many units need to be produced. This information in units and in dollars becomes the production budget.
The production budget is then broken up into budgets for materials, labor, and overhead, which use the standard quantity and standard price for raw materials that need to be purchased, the standard direct labor rate and the standard direct labor hours that need to be scheduled, and the standard costs for all other direct and indirect operating expenses. Companies use the historic quantities of the amount of material per unit and the hours of direct labor per unit to compute a standard used to estimate the quantity of materials and labor hours needed for the expected level of production. Current costs are used to develop standard costs for the price of materials, the direct labor rate, as well as an estimate of overhead costs.
The budget development process results in various budgets for various purposes, such as revenue, expenses, or units produced, but they all begin with a plan. To save time and eliminate unnecessary repetition, management often starts with the current year’s budget and adjusts it to meet future needs.
There are various strategies companies use in adjusting the budget amounts and planning for the future. For example, budgets can be derived from a top-down approach or from a bottom-up approach. Figure 10.1 shows the general difference between the top-down approach and the bottom-up approach. The top-down approach typically begins with senior management. The goals, assumptions, and predicted revenue and expenses information are passed from the senior manager to middle managers, who further pass the information downward. Each department must then determine how it can allocate its expenses efficiently while still meeting the company goals. The benefit of this approach is that it ties in to the strategic plan and company goals. Another benefit of passing the amount of allowed expenses downward is that the final anticipated costs are reduced by the vetting (fact checking and information gathering) process.
In the top-down approach, management must devote attention to efficiently allocating resources to ensure that expenses are not padded to create budgetary slack. The drawback to this approach to budgeting is that the budget is prepared by individuals who are not familiar with specific operations and expenses to understand each department’s nuances.
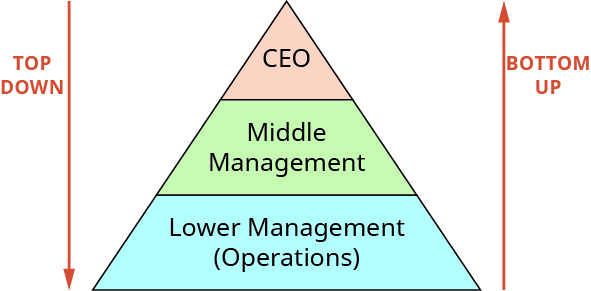
The bottom-up approach (sometimes also named a self-imposed or participative budget) begins at the lowest level of the company. After senior management has communicated the expected departmental goals, the departments then plans and predicts their sales and estimates the amount of resources needed to reach these goals. This information is communicated to the supervisor, who then passes it on to upper levels of management. The advantages of this approach are that managers feel their work is valued and that knowledgeable individuals develop the budget with realistic numbers. Therefore, the budget is more likely to be attainable. The drawback is that managers may not fully understand or may misunderstand the strategic plan.
Other approaches in addition to the top-down and bottom-up approaches are a combination approach and the zero-based budgeting approach. In the combination approach, guidelines and targets are set at the top while the managers work to develop a budget within the targeted parameters.
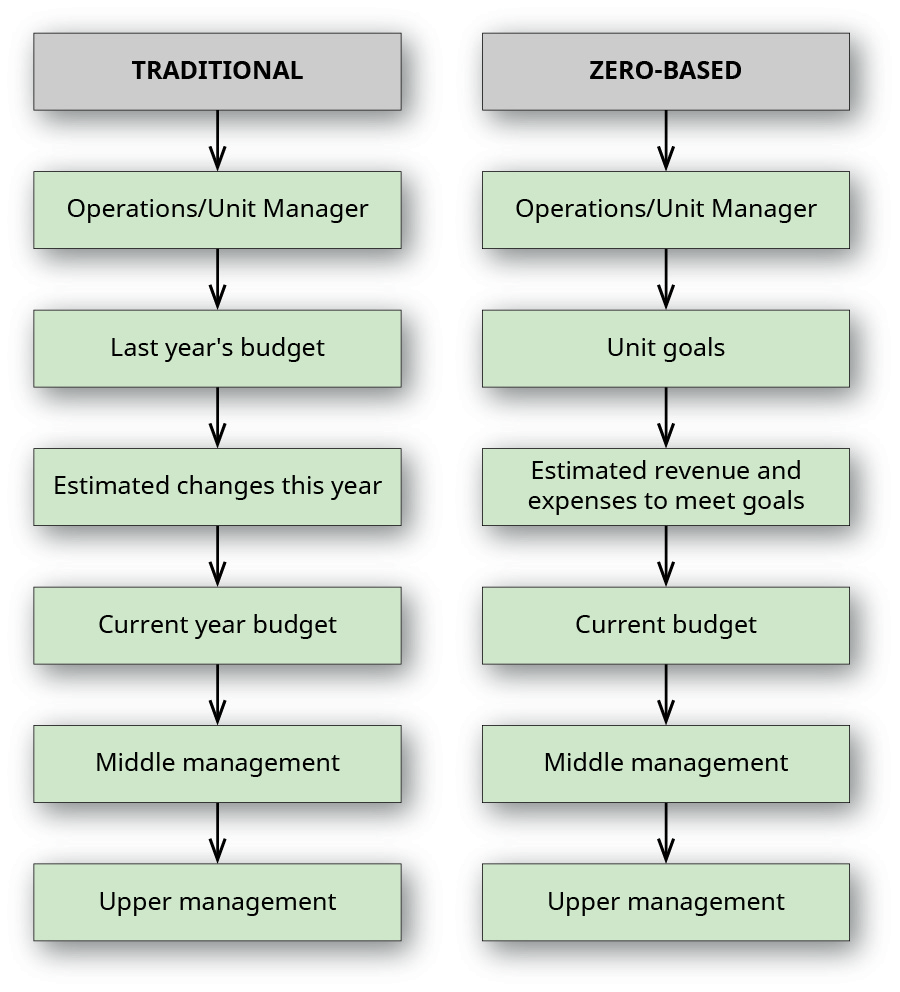
Zero-based budgeting begins with zero dollars and then adds to the budget only revenues and expenses that can be supported or justified. Figure 10.2 illustrates the difference between traditional budget preparation and zero-based budgeting in a bottom-up budgeting scenario. The advantage to zero-based budgeting is that unnecessary expenses are eliminated because managers cannot justify them. The drawback is that every expense needs to be justified, including obvious ones, so it takes a lot of time to complete. A compromise tactic is to use a zero-based budgeting approach for certain expenses, like travel, that can be easily justified and linked to the company goals.
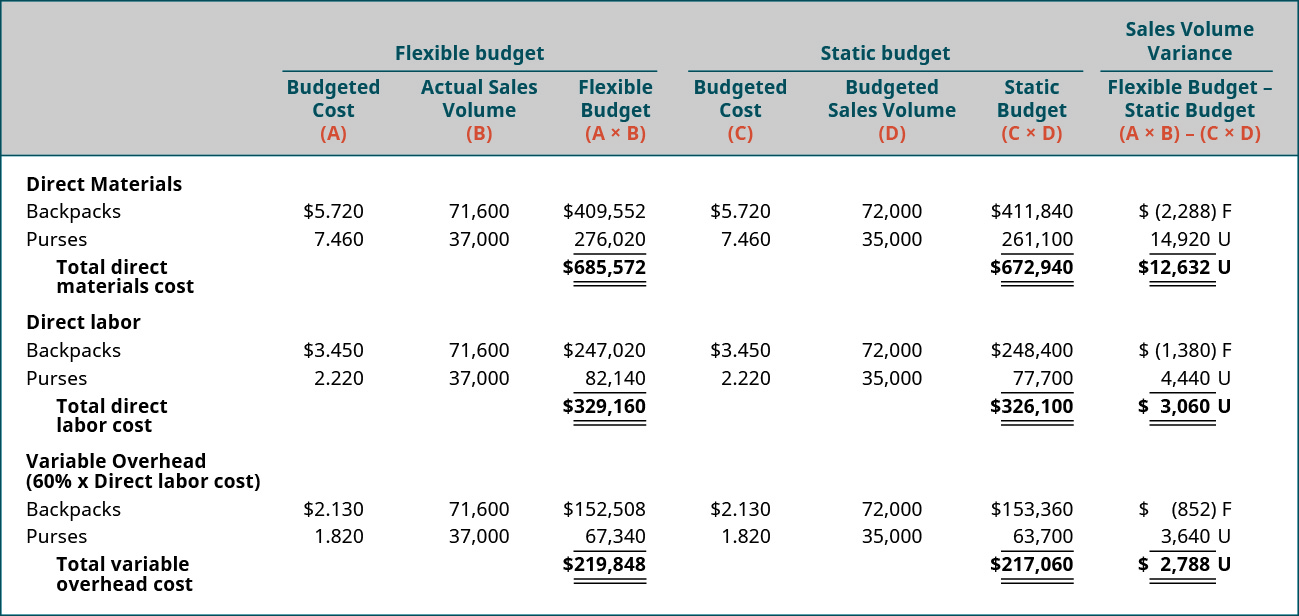
Often budgets are developed so they can adjust for changes in the volume or activity and help management make decisions. Changes and challenges can affect the budget and have an impact on a company’s plans. A flexible budget adjusts the cost of goods produced for varying levels of production and is more useful than a static budget, which remains at one amount regardless of the production level. A flexible budget is created at the end of the accounting period, whereas the static budget is created before the fiscal year begins.
Additionally Figure 10.3 shows a comparison of a static budget and a flexible budget for Bingo’s Bags, a company that produces purses and backpacks. In the flexible budget, the budgeted costs are calculated with actual sales, whereas in the static budget, budgeted costs are calculated with budgeted sales. The flexible budget allows management to see what they would expect the budget to look like based on the actual sales and budgeted costs. Flexible budgets are addressed in greater detail in Prepare Flexible Budgets.
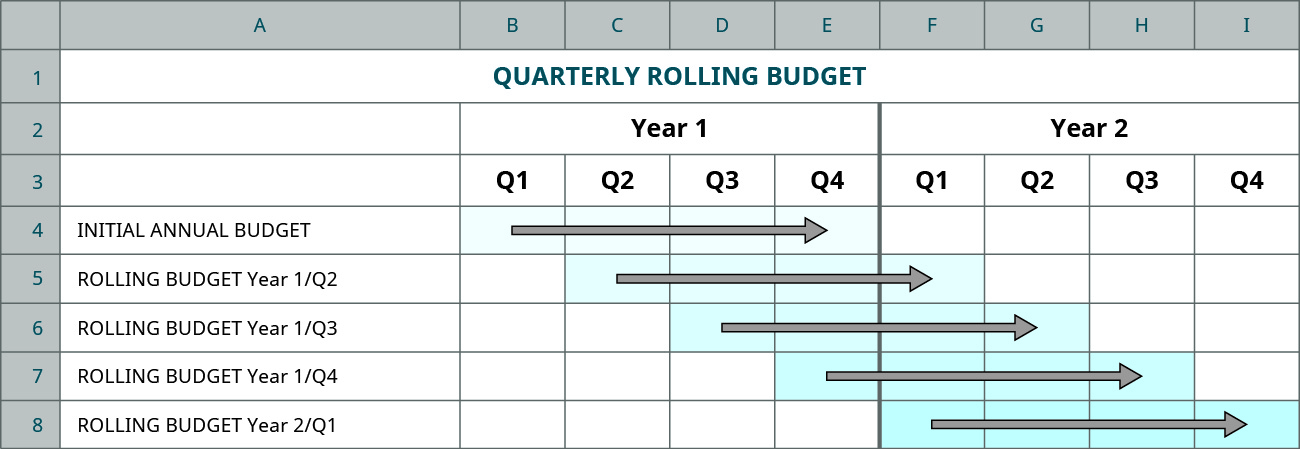
In order to handle changes that occur in the future, companies can also use a rolling budget, which is one that is continuously updated. While the company’s goals may be multi-year, the rolling budget is adjusted monthly, and a new month is added as each month passes. Rolling budgets allow management to respond to changes in estimates or actual occurrences, but it also takes management away from other duties as it requires continual updating. Figure 10.4 shows an example of how a rolling quarterly budget would work. Notice that as one month rolls off (is completed) another month is added to the budget so that four quarters of a year are always presented.
Because budgets are used to evaluate a manager’s performance as well as the company’s, managers are responsible for specific expenses within their own budget. Each manager’s performance is evaluated by how well he or she manages the revenues and expenses under his or her control. Each individual who exercises control over spending should have a budget specifying limits on that spending.
The Role of the Master Budget
Most organizations will create a master budget—whether that organization is large or small, public or private, or a merchandising, manufacturing, or service company. A master budget is one that includes two areas, operational and financial, each of which has its own sub-budgets. The operating budget spans several areas that help plan and manage day-to-day business. The financial budget depicts the expectations for cash inflows and outflows, including cash payments for planned operations, the purchase or sale of assets, the payment or financing of loans, and changes in equity. Each of the sub-budgets is made up of separate but interrelated budgets, and the number and type of separate budgets will differ depending on the type and size of the organization. For example, the sales budget predicts the sales expected for each quarter. The direct materials budget uses information from the sales budget to compute the number of units necessary for production. This information is used in other budgets, such as the direct materials budget, which plans when materials will be purchased, how much will be purchased, and how much that material should cost.
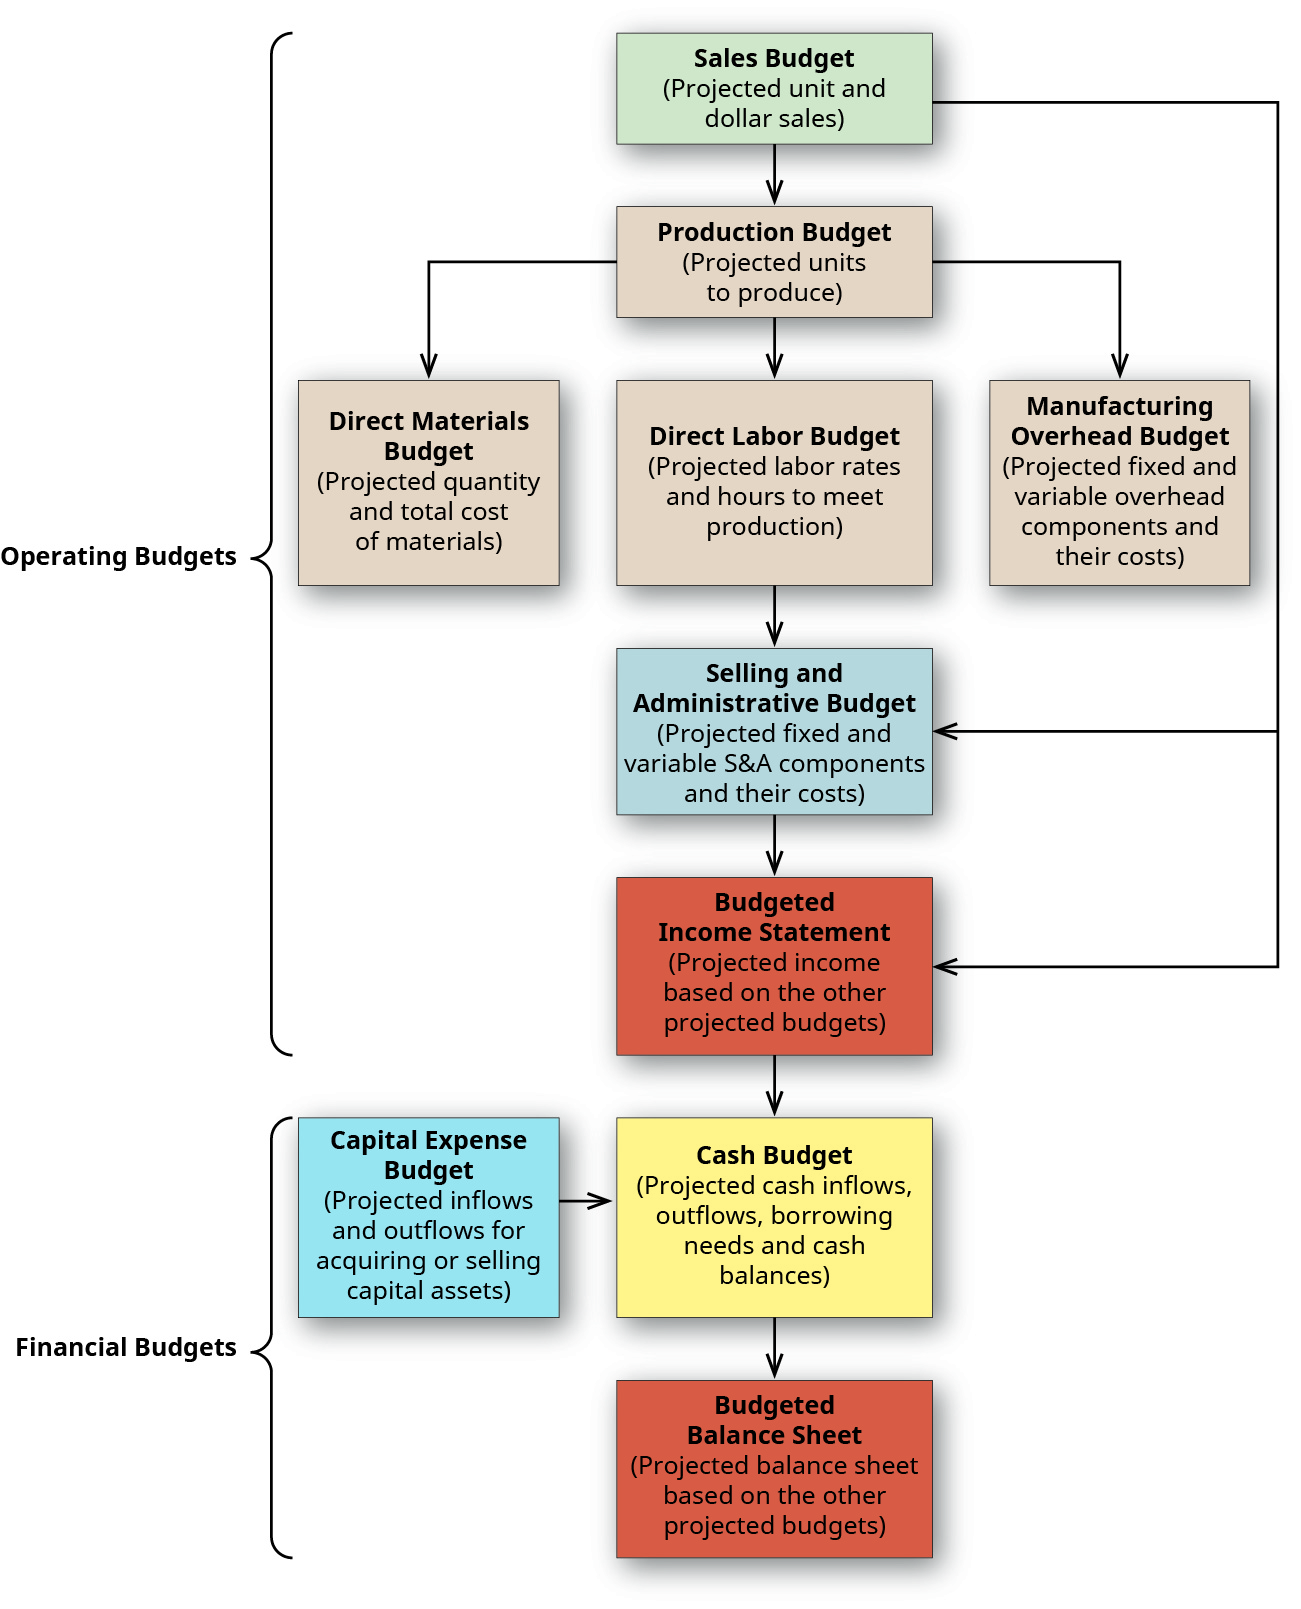
Figure 10.5 shows how operating budgets and financial budgets are related within a master budget.
The Role of Operating Budgets
An operating budget consists of the sales budget, production budget, direct material budget, direct labor budget, and overhead budget. These budgets serve to assist in planning and monitoring the day-to-day activities of the organization by informing management of how many units need to be produced, how much material needs to be ordered, how many labor hours need to be scheduled, and the amount of overhead expected to be incurred. The individual pieces of the operating budget collectively lead to the creation of the budgeted income statement. For example, Big Bad Bikes estimates it will sell 1,000 trainers for $70 each in the first quarter and prepares a sales budget to show the sales by quarter. Management understands that it needs to have on hand the 1,000 trainers that it estimates will be sold. It also understands that additional inventory needs to be on hand in the event there are additional sales and to prepare for sales in the second quarter. This information is used to develop a production budget. Each trainer requires 3.2 pounds of material that usually costs $1.25 per pound. Knowing how many units are to be produced and how much inventory needs to be on hand is used to develop a direct materials budget.
The direct materials budget lets managers know when and how much raw materials need to be ordered. The same is true for direct labor, as management knows how many units will be manufactured and how many hours of direct labor are needed. The necessary hours of direct labor and the estimated labor rate are used to develop the direct labor budget. While the materials and labor are determined from the production budget, only the variable overhead can be determined from the production budget. Existing information regarding fixed manufacturing costs are combined with variable manufacturing costs to determine the manufacturing overhead budget. The information from the sales budget is used to determine the sales and administrative budget. Finally, the sales, direct materials, direct labor, fixed manufacturing overhead budget, and sales and administrative budgets are used to develop a pro-forma income statement.
The Role of Financial Budgets
A financial budget consists of the cash budget, the budgeted balance sheet, and the budget for capital expenses. Similar to the individual budgets that make up the operating budgets, the financial budgets serve to assist with planning and monitoring the financing requirements of the organization. Management plans its capital asset needs and states them in the capital expense budget. Management addresses its collection and payment policies to determine when it will receive cash from sales and when it will pay the material, labor, and overhead expenses. The capital expense budget and the estimated payment and collection of cash allow management to build a cash budget and determine when it will need financing or have additional funds to pay back loans. These budgets taken together will be part of the budgeted balance sheet. Figure 10.5 shows how these budgets relate.
YOUR TURN
Maintaining a Cash Balance
DaQuan recently began work as a senior accountant at Mad Coffee Company. He learned he would be responsible for monitoring the cash balance because there is a bank loan requirement that a minimum balance of $10,000 be maintained with the bank at all times. DaQuan asked to see the cash budget so he could anticipate when the balance was most likely to go below $10,000. How can DaQuan determine potential cash balance issues by looking at the budget?
Solution
Budgeting helps plan for those times when cash is in short supply and bills need to be paid. Proper budgeting shows when and for how long a cash shortage may exist. DaQuan can see the months when the cash payments exceed the cash receipts and when the company is in danger of having a cash balance below the minimum requirement of $10,000. Knowing the inflow and outflow of cash will help him plan and manage the shortage through a line of credit, delay in purchasing, delay in hiring, or delay in payment of non-essential items.
Long Description
Columns (respectively) are Flexible Budget: Budgeted cost (A), Actual Sales Volume (B), Flexible Budget (A×B); Static Budget: Budgeted Cost (C), Budgeted Sales Volume (D), Static Budget (C×D); Sales Volume Variance: Flexible Budget-static budget (A×B) –(C×D); Direct Materials: Backpacks $5.720, 71,600, 409,552, 5.720, 72,000, 411,840, (2,288) F; Purses: 7.460, 37,000, 276,020, 7.460, 35,000, 261,100, 14,920 U; Total direct materials cost flexible budget is $685,572; Static Budget $672,940 for a sales volume variance of 12,632 U; Direct Labor: Backpacks $3.450, 71,600, 270,020, 3.450, 72,000, 248,400, (1,380) F; Purses: 2.220, 37,000, 82,140, 2.220, 35,000, 77,700, 4,440 U; Total direct labor cost flexible budget is $329,160; Static Budget $326,100 for a sales volume variance of 3,060 U; Variable Overhead (60% × Direct labor cost): Backpacks $2.130, 71,600, 152,508, 2.130, 72,000, 153,360, (852) F; Purses: 1,820, 37,000, 67,340, 1,820, 35,000, 63,700, 3,640 U; Total variable overhead cost flexible budget is $219,848; Static Budget $217,060 for a sales volume variance of 2,788 U. Return
A chart showing the Initial Annual Budget goes from quarter 1 year 1 to quarter 4 year 1; Rolling budget Year 1: Q2 goes from Q2, year 1 to Q1, year 2; Rolling budget Year 1: Q3 goes from Q3, year 1 to Q2, year 2; Rolling budget Year 1: Q4 goes from Q4 year 1 to Q3, year 2; Rolling budget Year 2: Q1 goes from Q1, year 2 to Q4, year 2. Return
A flow chart showing the relationship of budgets. The Operating Budgets: the Sales Budget (projected unit and dollar sales) has a line going down to the Production Budget (projected units to produce, which has a line going to three different budgets: Direct Materials Budget (projected quantity and total cost of materials), Direct Labor Budget (projected labor rates and hours to meet production, and the Manufacturing Overhead Budget (projected fixed and variable overhead components and their costs). The Direct Labor Budget and the Sales Budgets each have a line going down to the Selling and Administrative Budget (projected fixed and variable S&A components and their costs). This Selling and administrative Budget and the Sales Budgets each have a line going down to the Budgeted Income Statement (projected income based on the other projected budgets). The Financial Budgets: the Capital Expense Budget (projected inflows and outflows for acquiring or selling capital assets) and the Budgeted Income Statement each have a line going to the Cash Budget (projected cash inflows, outflows, borrowing needs and cash balances). The Cash Budget has a line going down to the Budgeted Balance Sheet (projected balance sheet based on the other projected budgets). Return

