
7.3 Margin of Safety
Our discussion of CVP analysis has focused on the sales necessary to break even or to reach a desired profit, but two other concepts are useful regarding our break-even sales. Those concepts are margin of safety and operating leverage.
A company’s margin of safety is the difference between its current sales and its break-even sales. The margin of safety tells the company how much they could lose in sales before the company begins to lose money, or, in other words, before the company falls below the break-even point. The higher the margin of safety is, the lower the risk is of not breaking even or incurring a loss. In order to calculate margin of safety, we use the following formula:

Let’s look at Manteo Machine, a company that machines parts that are then sold and used in the manufacture of farm equipment. For their core product, the break-even analysis is as follows:
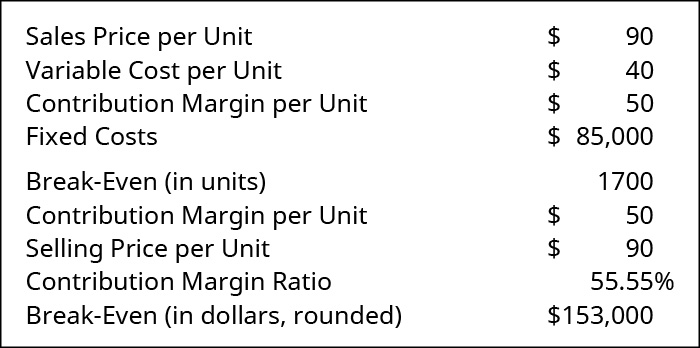
Interpreting this information tells Manteo Machine that, when sales equal $153,000, they will be at the break-even point. However, as soon as sales fall below this figure, they will have negative net operating income. They have decided that they want a margin of safety of $10,000. They can add this as if it were a fixed cost (very much the same way we added target profit earlier) and then find a new break-even point that includes a $10,000 margin of safety. If they approached it from this perspective, their new break-even would appear as follows:
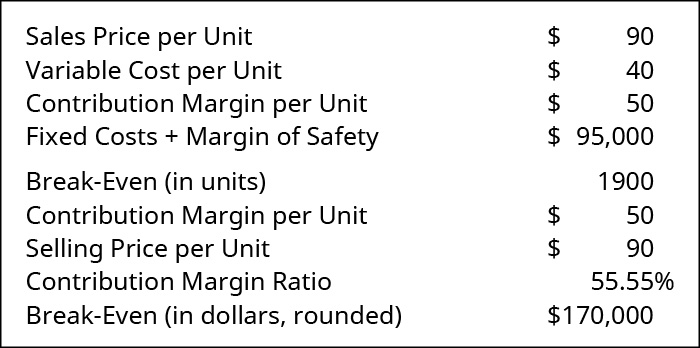
As shown in Figure 7.42, the margin of safety of 1,900 units is found from (FC + Margin of Safety) ÷ CM per unit = $95,000 ÷ $50. Thus, 1,900 units must be sold in order to meet fixed cost and have a $10,000 margin of safety. Another way to see this is to realize the $10,000 margin of safety will be met in $50 increments based on the current contribution margin. This means the company will need to sell an additional 200 units, which is an additional $18,000 in sales to have the desired margin of safety. The true break-even, where only fixed costs were met, was 1,700 units, or $153,000 in sales. The point at which the company would have a $10,000 margin of safety is 1,900 units, or $171,000 in sales. Note that the new level of units is the break-even units of 1,700 plus the 200 units for the margin of safety. The same can be seen for the sales dollar. The new level of desired sales dollars is the break-even sales of $153,000 plus the additional $18,000 in sales for the margin of safety.
The margin of safety can also be determined when a company knows its sales volume. For example, Manteo Machine sold 2,500 units in March and wants to know its margin of safety at that sales volume:
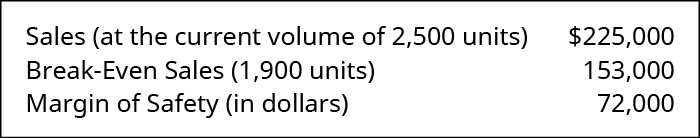
From this analysis, Manteo Machine knows that sales will have to decrease by $72,000 from their current level before they revert to break-even operations and are at risk to suffer a loss.
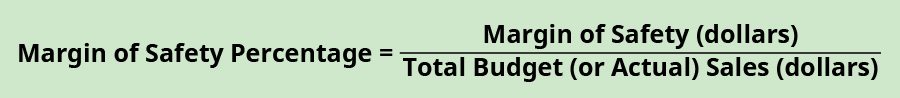
Many companies prefer to consider the margin of safety as a percentage of sales, rather than as a dollar amount. In order to express margin of safety as a percentage, we divide the margin of safety (in dollars) by the total budgeted or actual sales volume. The formula to express margin of safety as a percentage is:
Previously, we calculated Manteo Machine’s margin of safety as $72,000. As a percentage, it would be
This tells management that as long as sales do not decrease by more than 32%, they will not be operating at or near the break-even point, where they would run a higher risk of suffering a loss. Often, the margin of safety is determined when sales budgets and forecasts are made at the start of the fiscal year and also are regularly revisited during periods of operational and strategic planning.
Long Descriptions
Sales Price per Unit $90 less Variable Cost per Unit $40 equals Contribution Margin per Unit $50. Fixed Costs $85,000, Break-Even in units 1700. Contribution Margin per Unit $50 divided by Selling Price per Unit $90 equals Contribution Margin Ratio 55.55 percent, Break-Even in dollars, rounded $153,000. Return
Sales Price per Unit $90 less Variable Cost per Unit $40 equals Contribution Margin per Unit $50. Fixed Costs plus Margin of Safety $95,000, Break-Even in units 1900. Contribution Margin per Unit $50 divided by Selling Price per Unit $90 equals Contribution Margin Ratio 55.55 percent, Break-Even in dollars, rounded $170,000. Return
