
5.11 Earnings per Share (EPS)
Earnings per share (EPS) measures the portion of a corporation’s profit allocated to each outstanding share of common stock. Many financial analysts believe that EPS is the single most important tool in assessing a stock’s market price. A high or increasing earnings per share can drive up a stock price. Conversely, falling earnings per share can lower a stock’s market price. EPS is also a component in calculating the price-to-earnings ratio (the market price of the stock divided by its earnings per share), which many investors find to be a key indicator of the value of a company’s stock.
CONCEPTS IN PRACTICE
Microsoft Earnings Announcements Exceeds Wall Street Targets
While a company’s board of directors makes the final approval of the reports, a key goal of each company is to look favorable to investors while providing financial statements that accurately reflect the financial condition of the company. Each quarter, public companies report EPS through a public announcement as one of the key measures of their profitability. These announcements are highly anticipated by investors and analysts. The suspense is heightened because analysts provide earnings estimates to the public prior to each announcement release. According to Matt Weinberger of Business Insider, the announcement by Microsoft of its first quarter 2018 EPS reported at $0.95 per share, higher than analysts’ estimates of $0.85 per share, caused the value of its stock to rise by more than 3% within hours of the announcement.19 While revenue was the other key metric in Microsoft’s earnings announcement, EPS carried more weight in the surge of the company’s market price.
Calculating Earnings per Share
Earnings per share is the profit a company earns for each of its outstanding common shares. Both the balance sheet and income statement are needed to calculate EPS. The balance sheet provides details on the preferred dividend rate, the total par value of the preferred stock, and the number of common shares outstanding. The income statement indicates the net income for the period. The formula to calculate basic earnings per share is:

By removing the preferred dividends from net income, the numerator represents the profit available to common shareholders. Because preferred dividends represent the amount of net income to be distributed to preferred shareholders, this portion of the income is obviously not available for common shareholders. While there are a number of variations of measuring a company’s profit used in the financial world, such as NOPAT (net operating profit after taxes) and EBITDA (earnings before interest, taxes, depreciation, and amortization), GAAP requires companies to calculate EPS based on a corporation’s net income, as this amount appears directly on a company’s income statement, which for public companies must be audited.
In the denominator, only common shares are used to determine earnings per share because EPS is a measure of earnings for each common share of stock. The denominator can fluctuate throughout the year as a company issues and buys back shares of its own stock. The weighted average number of shares is used on the denominator because of this fluctuation. To illustrate, assume that a corporation began the year with 600 shares of common stock outstanding and then on April 1 issued 1,000 more shares. During the period January 1 to March 31, the company had the original 600 shares outstanding. Once the new shares were issued, the company had the original 600 plus the new 1,000 shares, for a total of 1,600 shares for each of the next nine months—from April 1 to December 31. To determine the weighted average shares, apply these fractional weights to both of the stock amounts, as shown in Figure 5.86.
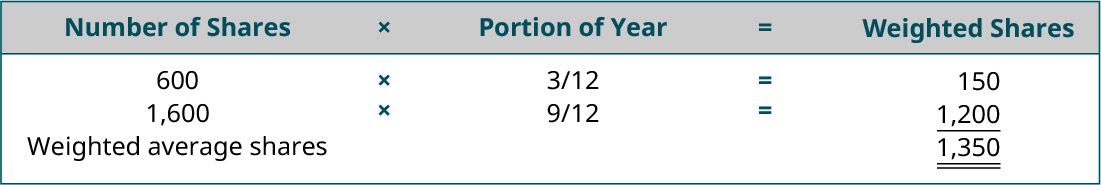
If the shares were not weighted, the calculation would not consider the time period during which the shares were outstanding.
To illustrate how EPS is calculated, assume Sanaron Company earns $50,000 in net income during 2020. During the year, the company also declared a $10,000 dividend on preferred stock and a $14,000 dividend on common stock. The company had 5,000 common shares outstanding the entire year along with 2,000 preferred shares. Sanaron has generated $8 of earnings ($50,000 less the $10,000 of preferred dividends) for each of the 5,000 common shares of stock it has outstanding.
Measuring Performance with EPS
EPS is a key profitability measure that both current and potential common stockholders monitor. Its importance is accentuated by the fact that GAAP requires public companies to report EPS on the face of a company’s income statement. This is only ratio that requires such prominent reporting. If fact, public companies are required to report two different earnings per share amounts on their income statements—basic and diluted. We’ve illustrated the calculation of basic EPS. Diluted EPS, which is not demonstrated here, involves the consideration of all securities such as stocks and bonds that could potentially dilute, or reduce, the basic EPS.
Earnings per share is interpreted differently by different analysts. Some financial experts favor companies with higher EPS values. The reasoning is that a higher EPS is a reflection of strong earnings and therefore a good investment prospect. A more meaningful analysis occurs when EPS is tracked over a number of years, such as when presented in the comparative income statements for Cracker Barrel Old Country Store, Inc.’s respective year ends in 2017, 2016, and 2015 shown in Figure 5.87.20 Cracker Barrel’s basic EPS is labeled as “net income per share: basic.”
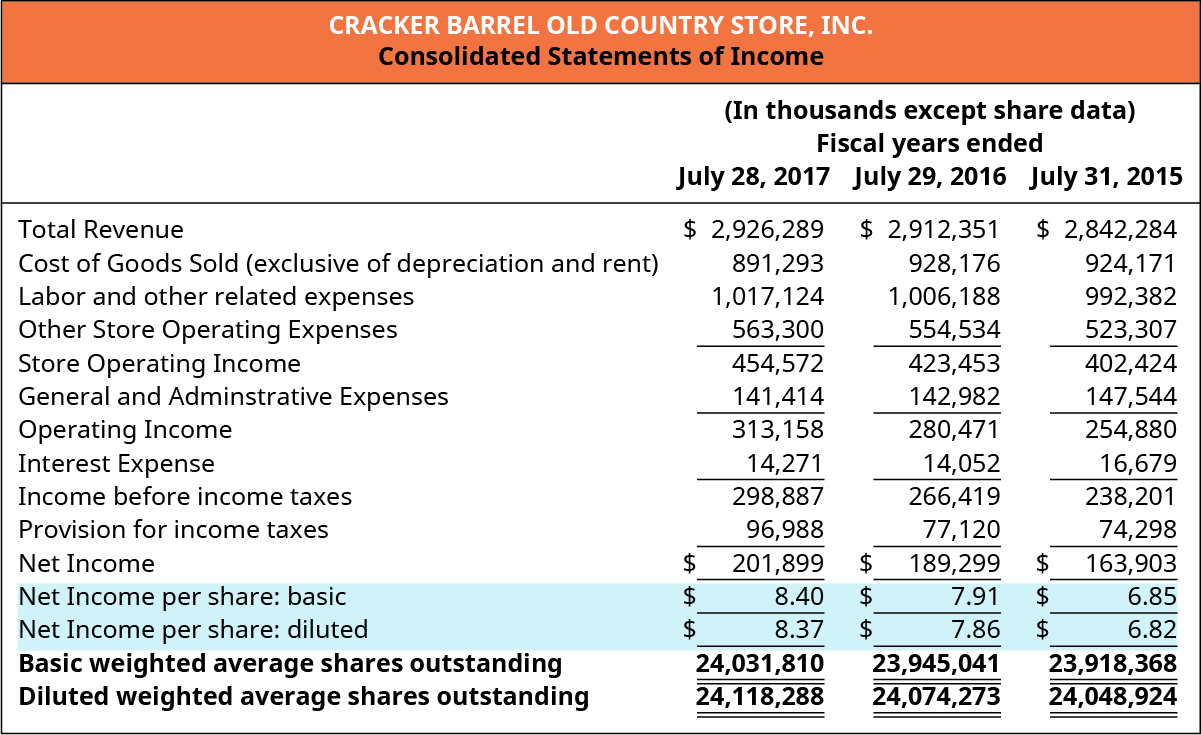
Most analysts believe that a consistent improvement in EPS year after year is the indication of continuous improvement in the earning power of a company. This is what is seen in Cracker Barrel’s EPS amounts over each of the three years reported, moving from $6.85 to $7.91 to $8.40. However, it is important to remember that EPS is calculated on historical data, which is not always predictive of the future. In addition, when EPS is used to compare different companies, significant differences may exist. If companies are in the same industry, that comparison may be more valuable than if they are in different industries. Basically, EPS should be a tool used in decision-making, utilized alongside other analytic tools.
YOUR TURN
Would You Have Invested?
What if, in 1997, you invested $5,000 in Amazon? Today, your investment would be worth nearly $1 million. Potential investors viewing Amazon’s income statement in 1997 would have seen an EPS of a negative $0.11. In other words, Amazon lost $0.11 for each share of common stock outstanding. Would you have invested?
Solution
Answers will vary. A strong response would include the idea that a negative or small EPS reflects upon the past historical operations of a company. EPS does not predict the future. Investors in 1997 looked beyond Amazon’s profitability and saw its business model having strong future potential.
Long Descriptions
Cracker Barrel Old Country Store, Inc. Consolidated Statements of Income (In thousands except share data) Fiscal years ended July 28, 2017, July 29, 2016, and July 31, 2015 (respectively): Total Revenue $2,926,289, 2,912,351, 2,842,284. Less Cost of goods sold (exclusive of depreciation and rent) 891,293, 928,176, 924,171. Less Labor and other related expenses 1,017,124, 1,066,188, 992,382. Less Other store operating expenses 563,300, 554,534, 523,307. Equals Store operating income 454,572, 423,453, 402,424. Less General and administrative expenses 141,414, 142,982, 147,544. Equals Operating income 313,158, 280,471, 254,880. Less Interest expense 14,271, 14,052, 16,679. Equals Income before income taxes, 298,887, 266,419, 238. Less Provision for income taxes 96,988, 77,120, 74,298. Equals Net income 201,899, 189,299, 163,903. Net income per share: basic $8.40, 7.91, 6.85. Net income per share: diluted $8.37, 7.86, 6.82. Basic weighted average shares outstanding 24,031,810, 23,945,041, 23,918,368. Diluted weighted average shares outstanding 24,118,288, 24,074,273, 24,048,924. Return
Footnotes
- 19 Matt Weinberger. “Microsoft’s Cloud Business Is Driving a Revenue Surge That’s Well above Wall Street Targets.” Business Insider. April 26, 2018. https://www.businessinsider.com/microsoft-q3-fy18-earnings-revenue-eps-analysis-2018-4
- 20 Cracker Barrel. Cracker Barrel Old Country Store 2017 Annual Report. September 22, 2017. http://investor.crackerbarrel.com/static-files/c05f90b8-1214-4f50-8508-d9a70301f51f
