
10.8 Overhead Variances
Recall that the standard cost of a product includes not only materials and labor but also variable and fixed overhead. It is likely that the amounts determined for standard overhead costs will differ from what actually occurs. This will lead to overhead variances.
Determination and Evaluation of Overhead Variance
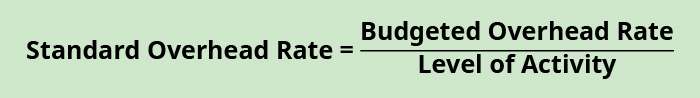
In a standard cost system, overhead is applied to the goods based on a standard overhead rate. This is similar to the predetermined overhead rate used previously. The standard overhead rate is calculated by dividing budgeted overhead at a given level of production (known as normal capacity) by the level of activity required for that particular level of production.
Usually, the level of activity is either direct labor hours or direct labor cost, but it could be machine hours or units of production.
Creation of Flexible Overhead Budget
To determine the overhead standard cost, companies prepare a flexible budget that gives estimated revenues and costs at varying levels of production. The standard overhead cost is usually expressed as the sum of its component parts, fixed and variable costs per unit. Note that at different levels of production, total fixed costs are the same, so the standard fixed cost per unit will change for each production level. However, the variable standard cost per unit is the same per unit for each level of production, but the total variable costs will change.
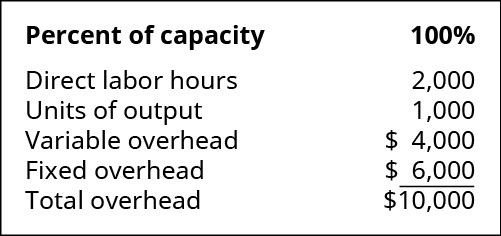
We continue to use Connie’s Candy Company to illustrate. Suppose Connie’s Candy budgets capacity of production at 100% and determines expected overhead at this capacity. Connie’s Candy also wants to understand what overhead cost outcomes will be at 90% capacity and 110% capacity. The following information is the flexible budget Connie’s Candy prepared to show expected overhead at each capacity level.
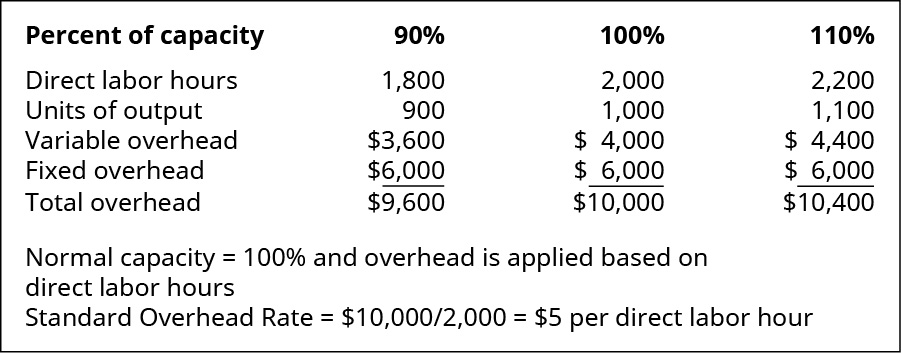
Units of output at 100% is 1,000 candy boxes (units). The standard overhead rate is the total budgeted overhead of $10,000 divided by the level of activity (direct labor hours) of 2,000 hours. Notice that fixed overhead remains constant at each of the production levels, but variable overhead changes based on unit output. If Connie’s Candy only produced at 90% capacity, for example, they should expect total overhead to be $9,600 and a standard overhead rate of $5.33 (rounded). If Connie’s Candy produced 2,200 units, they should expect total overhead to be $10,400 and a standard overhead rate of $4.73 (rounded). In addition to the total standard overhead rate, Connie’s Candy will want to know the variable overhead rates at each activity level.
Using the flexible budget, we can determine the standard variable cost per unit at each level of production by taking the total expected variable overhead divided by the level of activity, which can still be direct labor hours or machine hours.

Looking at Connie’s Candies, the following table shows the variable overhead rate at each of the production capacity levels.
| Production Capacity | Variable/Unit |
|---|---|
| 90% | $3,600 ÷ 1,800 = $2 |
| 100% | $4,000 ÷ 2,000 = $2 |
| 110% | $4,400 ÷ 2,200 = $2 |
Sometimes these flexible budget figures and overhead rates differ from the actual results, which produces a variance.
Determination of Variable Overhead Variances
There are two components to variable overhead rates: the overhead application rate and the activity level against which that rate was applied. If we compare the actual variable overhead to the standard variable overhead, by analyzing the difference between actual overhead costs and the standard overhead for current production, it is difficult to determine if the variance is due to application rate differences or activity level differences. Thus, there are two variable overhead variances that will better provide these answers: the variable overhead rate variance and the variable overhead efficiency variance.
Determination of Variable Overhead Rate Variance
The variable overhead rate variance, also known as the spending variance, is the difference between the actual variable manufacturing overhead and the variable overhead that was expected given the number of hours worked. The variable overhead rate variance is calculated using this formula:
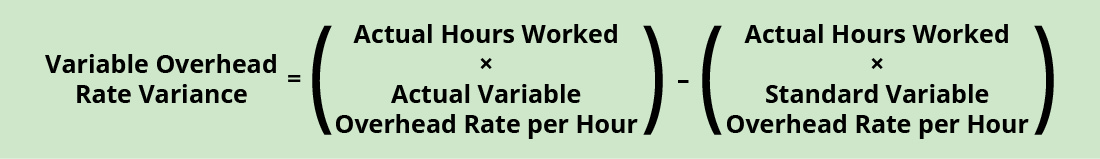
Factoring out actual hours worked, we can rewrite the formula as

If the outcome is favorable (a negative outcome occurs in the calculation), this means the company spent less than what it had anticipated for variable overhead. If the outcome is unfavorable (a positive outcome occurs in the calculation), this means the company spent more than what it had anticipated for variable overhead.
Connie’s Candy Company wants to determine if its variable overhead spending was more or less than anticipated. Connie’s Candy had this data available in the flexible budget:

Connie’s Candy also had this actual output information:
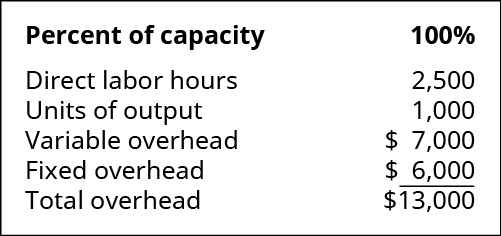
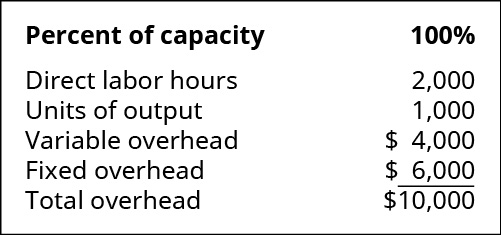
To determine the variable overhead rate variance, the standard variable overhead rate per hour and the actual variable overhead rate per hour must be determined. The standard variable overhead rate per hour is $2.00 ($4,000 ÷ 2,000 hours), taken from the flexible budget at 100% capacity. The actual variable overhead rate is $2.80 ($7,000 ÷ 2,500), taken from the actual results at 100% capacity. Therefore,
This produces an unfavorable outcome. This could be for many reasons, and the production supervisor would need to determine where the variable cost difference is occurring to make production changes.
Let us look at another example producing a favorable outcome. Connie’s Candy had this data available in the flexible budget:
Connie’s Candy also had this actual output information:
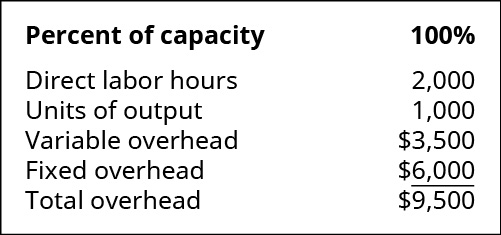
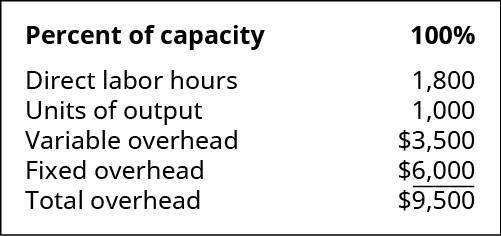
To determine the variable overhead rate variance, the standard variable overhead rate per hour and the actual variable overhead rate per hour must be determined. The standard variable overhead rate per hour is $2.00 ($4,000 ÷ 2,000 hours), taken from the flexible budget at 100% capacity. The actual variable overhead rate is $1.75 ($3,500 ÷ 2,000), taken from the actual results at 100% capacity. Therefore,
This produces a favorable outcome. This could be for many reasons, and the production supervisor would need to determine where the variable cost difference is occurring to better understand the variable overhead reduction.
Interpretation of the variable overhead rate variance is often difficult because the cost of one overhead item, such as indirect labor, could go up, but another overhead cost, such as indirect materials, could go down. Often, explanation of this variance will need clarification from the production supervisor. Another variable overhead variance to consider is the variable overhead efficiency variance.
Determination of Variable Overhead Efficiency Variance
The variable overhead efficiency variance, also known as the controllable variance, is driven by the difference between the actual hours worked and the standard hours expected for the units produced. This variance measures whether the allocation base was efficiently used. The variable overhead efficiency variance is calculated using this formula:
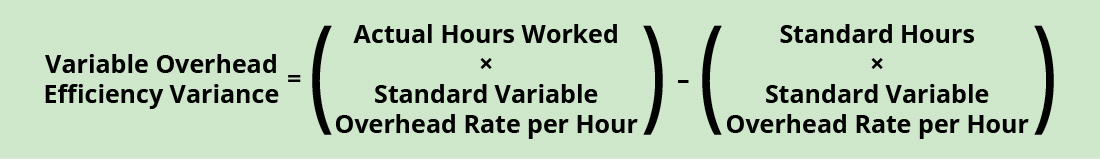
Factoring out standard overhead rate, the formula can be written as

If the outcome is favorable (a negative outcome occurs in the calculation), this means the company was more efficient than what it had anticipated for variable overhead. If the outcome is unfavorable (a positive outcome occurs in the calculation), this means the company was less efficient than what it had anticipated for variable overhead.
Connie’s Candy Company wants to determine if its variable overhead efficiency was more or less than anticipated. Connie’s Candy had the following data available in the flexible budget:

Connie’s Candy also had the following actual output information:
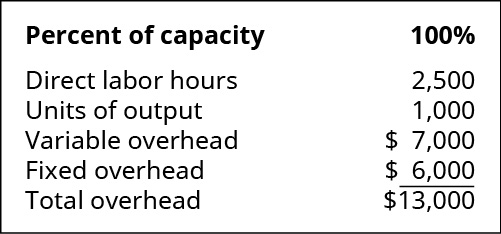
To determine the variable overhead efficiency variance, the actual hours worked and the standard hours worked at the production capacity of 100% must be determined. Actual hours worked are 2,500, and standard hours are 2,000. The standard variable overhead rate per hour is $2.00 ($4,000 ÷ 2,000 hours), taken from the flexible budget at 100% capacity. Therefore,
This produces an unfavorable outcome. This could be for many reasons, and the production supervisor would need to determine where the variable cost difference is occurring to make production changes.
Let us look at another example producing a favorable outcome. Connie’s Candy had the following data available in the flexible budget:

Connie’s Candy also had the following actual output information:
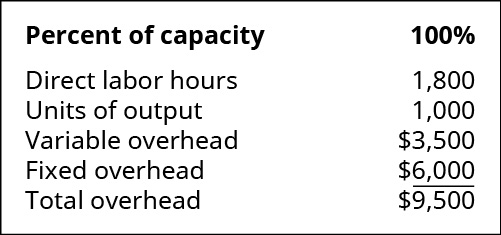
To determine the variable overhead efficiency variance, the actual hours worked and the standard hours worked at the production capacity of 100% must be determined. Actual hours worked are 1,800, and standard hours are 2,000. The standard variable overhead rate per hour is $2.00 ($4,000 ÷ 2,000 hours), taken from the flexible budget at 100% capacity. Therefore,
This produces a favorable outcome. This could be for many reasons, and the production supervisor would need to determine where the variable cost difference is occurring to better understand the variable overhead efficiency reduction.
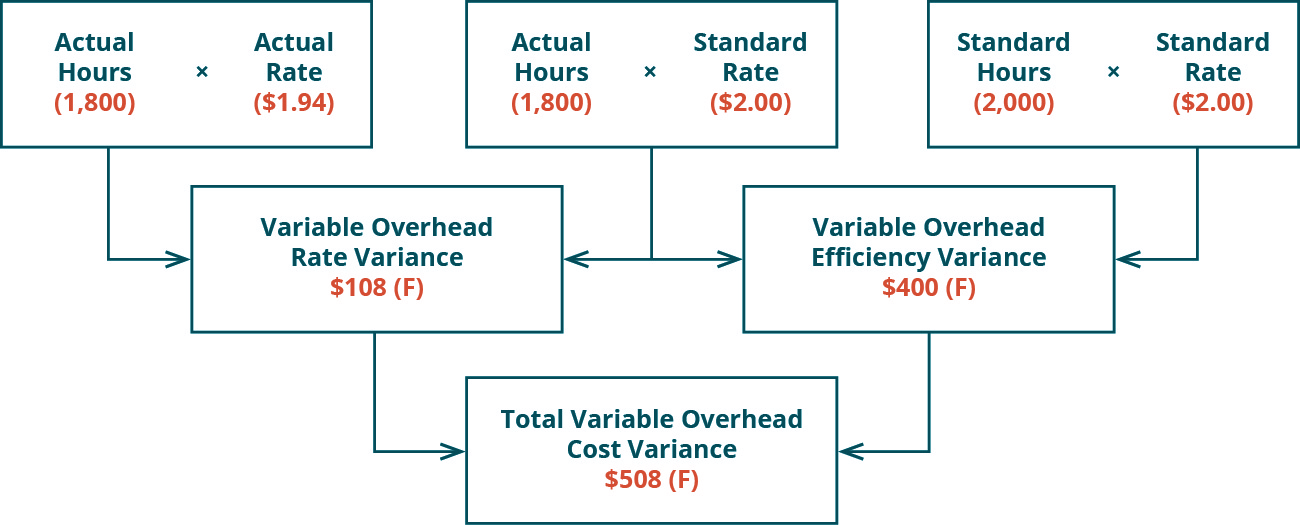
The total variable overhead cost variance is also found by combining the variable overhead rate variance and the variable overhead efficiency variance. By showing the total variable overhead cost variance as the sum of the two components, management can better analyze the two variances and enhance decision-making.
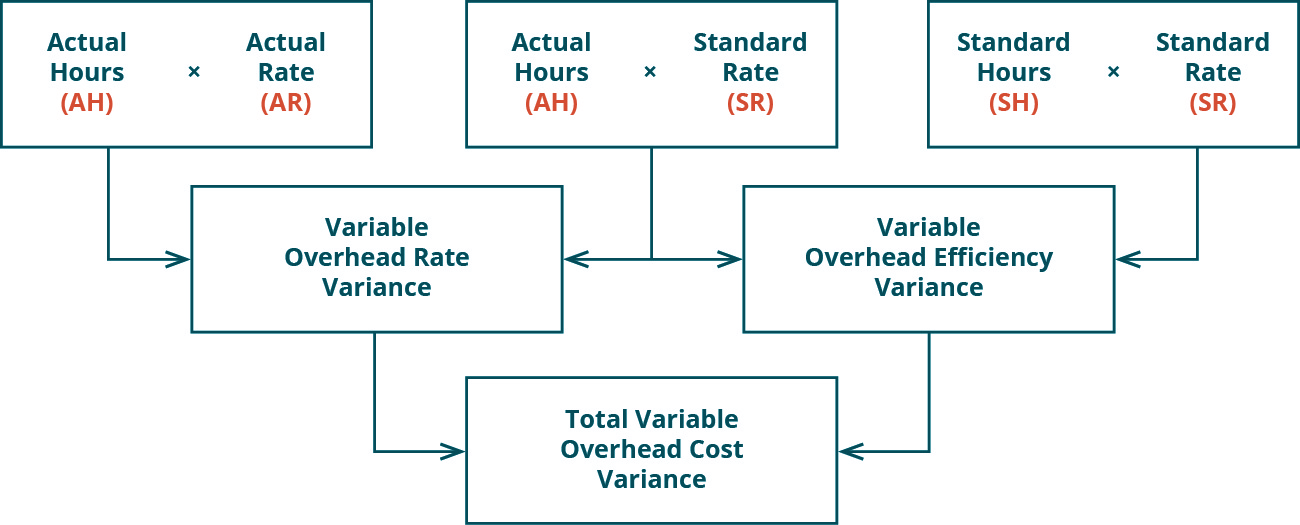
Figure 10.61 shows the connection between the variable overhead rate variance and variable overhead efficiency variance to total variable overhead cost variance.
For example, Connie’s Candy Company had the following data available in the flexible budget:
Connie’s Candy also had the following actual output information:
The variable overhead rate variance is calculated as (1,800 × $1.94) – (1,800 × $2.00) = –$108, or $108 (favorable). The variable overhead efficiency variance is calculated as (1,800 × $2.00) – (2,000 × $2.00) = –$400, or $400 (favorable).
The total variable overhead cost variance is computed as:
In this case, two elements are contributing to the favorable outcome. Connie’s Candy used fewer direct labor hours and less variable overhead to produce 1,000 candy boxes (units).
The same calculation is shown as follows in diagram format.
As with the interpretations for the variable overhead rate and efficiency variances, the company would review the individual components contributing to the overall favorable outcome for the total variable overhead cost variance, before making any decisions about production in the future. Other variances companies consider are fixed factory overhead variances.
Fundamentals of Fixed Factory Overhead Variances
The fixed factory overhead variance represents the difference between the actual fixed overhead and the applied fixed overhead. There are two fixed overhead variances. One variance determines if too much or too little was spent on fixed overhead. The other variance computes whether or not actual production was above or below the expected production level.
YOUR TURN
Sweet and Fresh Shampoo Overhead
Biglow Company makes a hair shampoo called Sweet and Fresh. They have the following flexible budget data:
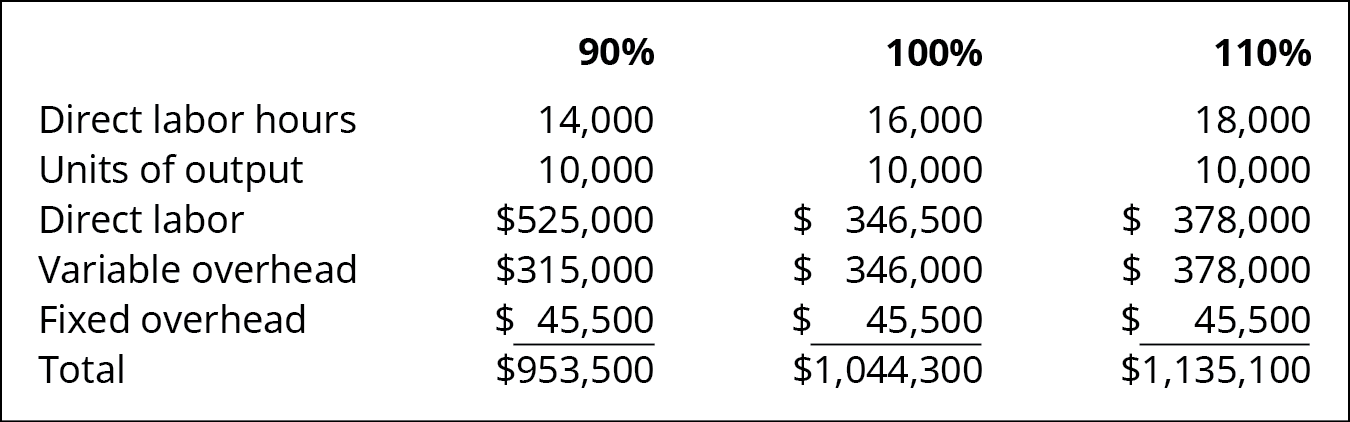
What is the standard variable overhead rate at 90%, 100%, and 110% capacity levels?
Solution
90% = $315,000 ÷ 14,000 = $22.50, 100% = $346,000 ÷ 16,000 = $21.63 (rounded), 110% = $378,000 ÷ 18,000 = $21.00.
Long Description
Percent of capacity: 90 percent, 100 percent, 110 percent respectively. Direct labor hours 1,800, 2,000, 2,200. Units of output 900, 1,000, 1,100. Variable overhead $3,600, 4,000, 4,400. Fixed overhead $6,000, 6,000, 6,000. Total overhead $9,600, 10,000, 10,400. Normal capacity equals 100 percent and overhead is applied based on direct labor hours. Standard Overhead Rate equals $10,000 divided by 2,000 equals $5 per direct labor hour. Return
There are three top row boxes. Two, Actual Hours (AH) times Actual Rate (AR) and Actual Hours (AH) times Standard Rate (SR) combine to point to a Second row box: Variable Overhead Rate Variance. Two top row boxes: Actual Hours (AH) times Standard Rate (SR) and Standard Hours (SH) times Standard Rate (SR) combine to point to Second row box: Variable Overhead Efficiency Variance. Notice the middle top row box is used for both of the variances. Second row boxes: Variable Overhead Rate Variance and Variable Overhead Efficiency Variance combine to point to bottom row box: Total Variable Overhead Cost Variance. Return
There are three top row boxes. Two, Actual Hours (1,800) times Actual Rate ($1.94) and Actual Hours (1,800) times Standard Rate ($2.00) combine to point to a Second row box: Variable Overhead Rate Variance $108 Favorable. Two top row boxes: Actual Hours (1800) times Standard Rate ($2.00) and Standard Hours (2,000) times Standard Rate ($2.00) combine to point to Second row box: Variable Overhead Efficiency Variance $400 Favorable. Notice the middle top row box is used for both of the variances. Second row boxes: Variable Overhead Rate Variance $108 F and Variable Overhead Efficiency Variance $400 F combine to point to bottom row box: Total Variable Overhead Cost Variance $508 F. Return
For 90 percent, 100 percent, and 110 percent, respectively: Direct labor hours 14,000, 16,000, 18,000; Units of output 10,000, 10,000, 10,000; Direct labor $525,000, $346,500, $378,000; Variable overhead $315,000, $346,000, $378,000; Fixed overhead $45,500, $45,500, $45,500; Total $953,500, $1,044,300, $1,135,100. Return
