
10.10 How Budgets are used to Evaluate Goals
As you’ve learned, an advantage of budgeting is evaluating performance. Having a strong understanding of their budgets helps managers keep track of expenses and work toward the company’s goals. Companies need to understand their revenue and expense details to develop budgets as a tool for planning operations and cash flow. Part of understanding revenue and expenses is evaluating the prior year. Did the company earn the expected profit? Could it have earned a higher profit? What expenses or revenues were not on the budget? Critically evaluating the actual results versus the estimated budgetary results can help management plan for the future. Variance analysis helps the manager analyze its results. It does not necessarily find a problem, but it does indicate where a problem may exist. The same is true for favorable variances as well as unfavorable variances. A favorable variance occurs when revenue is higher than budgeted or expenses are lower than budgeted. An unfavorable variance is when revenue is lower than budgeted or expenses are higher than budgeted.
| Favorable | Unfavorable |
|---|---|
| Actual Sales > Budgeted Sales | Actual Sales < Budgeted Sales |
| Actual Expenses < Budgeted Expenses | Actual Expenses > Budgeted expenses |
It is easy to understand that an unfavorable variance may be a problem. But that is not always true, as a higher labor rate may mean the company has a higher quality employee who is able to waste less material. Likewise, having a favorable variance indicates that more revenue was earned or less expenses were incurred but further analysis can indicate if costs were cut too far and better materials should have been purchased.
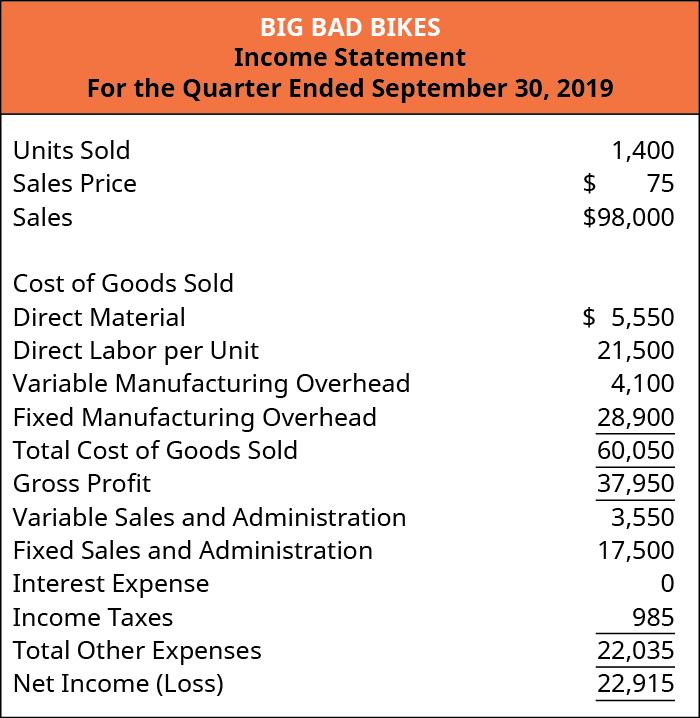
If a company has only a static budget, meaningful comparisons are difficult. Analyzing the sales for Bid Bad Bikes will illustrate whether there was a profit and how net income impacts the company. In the third quarter, Big Bad Bikes sold 1,400 trainers and had third quarter net income of $15,915 as shown in Figure 10.73.
The company earned a profit during the third quarter, but what does that mean to the company? Simply having net income instead of a net loss does not help plan for the future. The third quarter static budget was for the sale of 1,500 units. Comparing that budget to the actual results shows whether there is a favorable variance or an unfavorable variance. A comparison of the actual costs with the budget for the third quarter, as shown in Figure 10.74, has a favorable variance for all of the expenses and an unfavorable variance for everything associated with revenues.
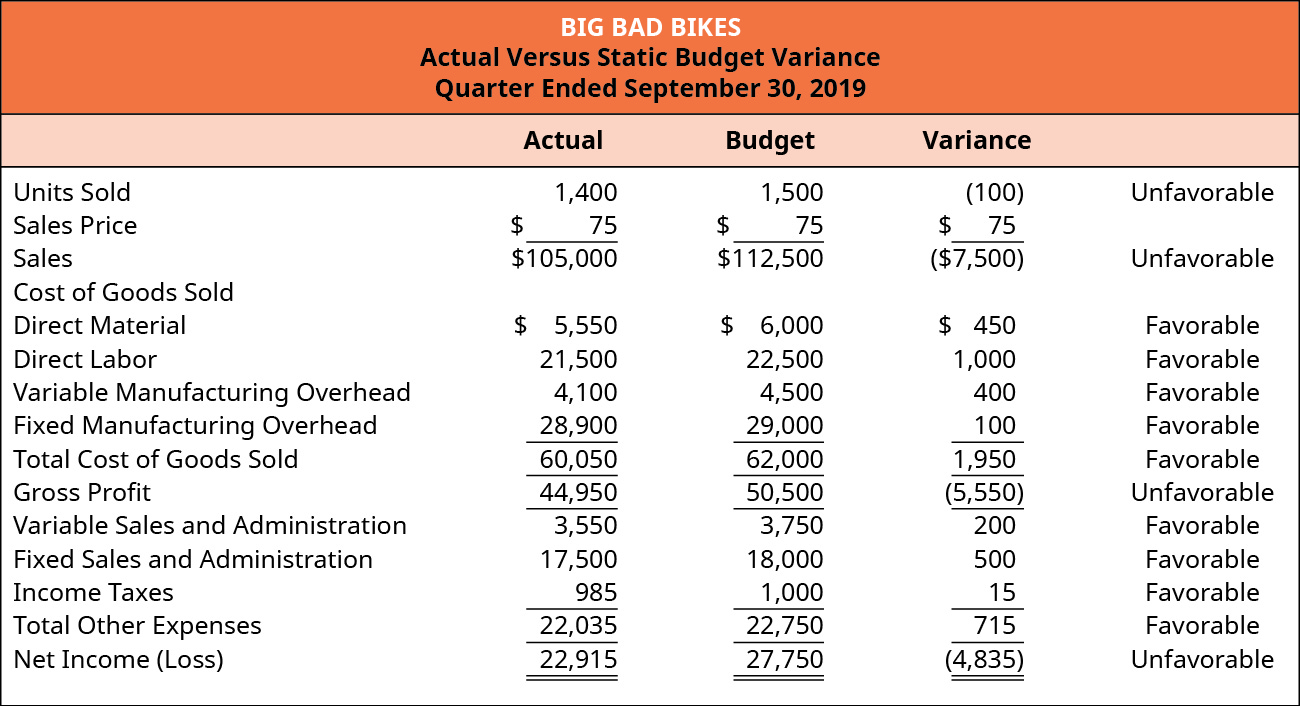
How do those results advise management when evaluating the company’s performance? It is difficult to look at one variance and make a conclusion about the company or its management. However, the variances can help narrow down the areas that need addressing because they differ from the budgeted amount. For example, looking at the variance when using a static budget does not indicate the amount of the variance results because they sold 100 fewer units than budgeted. The variance for the cost of goods sold is favorable, but it should be if production was less than the budget. A static budget does not evaluate whether costs for 1,400 were appropriate for production of those 1,400 units.
Using a static budget to evaluate performance affects the bottom line as well as the individual expenses. The net income for the sale of 1,400 units is less than the budgeted net income for 1,500 units, but it does not indicate whether expenses were appropriate for 1,400 units. If there had been 1,600 units sold, the expenses would be more than the budgeted amount, but sales would be higher. Would it be fair to evaluate a manager’s control over their expenses using a static budget?
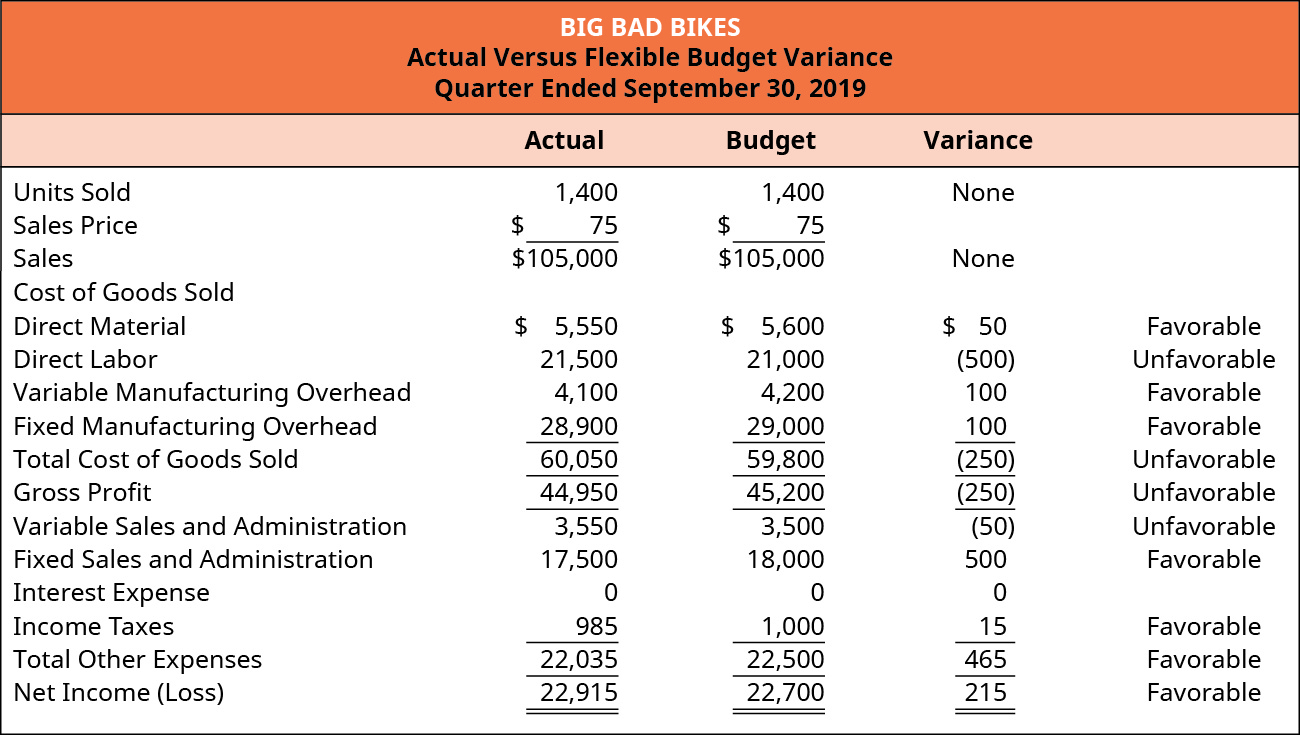
Evaluating the expenses on a flexible budget computed for the number of units sold would provide an indication of management’s ability to control expenses. As shown in Figure 10.75, some expenses have a favorable variance, while others have an unfavorable variance. This type of variance analysis provides more information to evaluate management and help prepare the next year’s budget. For example, the direct labor in the flexible budget comparison shows an unfavorable variance, meaning the direct labor expense was more than budgeted for the production of 1,400 units. When comparing direct labor expense, the direct labor in the static budget mentioned earlier was even larger because it computed direct labor required to manufacture 1,500 units. It is not surprising that the static budget variance is favorable because 100 fewer units were actually produced. However, that information is not as useful as the unfavorable variance when comparing 1,400 units produced versus the budgeted direct labor for 1,400 units used.
Long Description
Big Bad Bikes, Income Statement, For the Quarter Ending September 30, 2019: Units Sold 1,400, Sales price $70, Sales 98,000; Cost of goods sold: Direct material $5,550, Direct labor per unit 21,500, Variable manufacturing overhead 4,100, Fixed manufacturing overhead 28,900 equals total cost of goods sold 60,050 and Gross profit of 37,950. Variable sales and admin 3,550, Fixed sales and admin 17,500, Income taxes 985 equal Total other expenses 22,035, leaving Net income of 15,915. Return
Big Bad Bikes, Actual Versus Static Budget Variance, For the Quarter Ending September 30, 2019: Actual, Budget, Variance (respectively): Units Sold 1,400, 1,500, (100) unfavorable Sales price $75, $75, $75; Sales 105,000, 112,500, (7,500) unfavorable; Cost of goods sold: Direct material $5,550, 6,000, 450 favorable; Direct labor per unit 21,500, 22,500, 1,000 favorable; Variable manufacturing overhead 4,100, 4,500, 400 favorable; Fixed manufacturing overhead 28,900, 29,000, 100 favorable Equals Total cost of goods sold 60,050, 62,000, 1,950 favorable and Gross profit of 44,950, 50,500, (5,550) unfavorable. Variable sales and admin 3,550, 3,750, 200 favorable; Fixed sales and admin 17,500, 18,000, 500 favorable; Income taxes 985, 1,000, 15 favorable Equals Total other expenses 22,035, 22,750, 715 favorable Equals Net income of 22,915, 27,750, (4,835) unfavorable. Return
Big Bad Bikes, Actual Versus Flexible Budget Variance, For the Quarter Ending September 30, 2019. Actual, Budget, Variance (respectively): Units Sold 1,400, 1,400, none; Sales price $75, $75; Sales 105,000, 105,000 none; Cost of goods sold: Direct material $5,550, 5,600, 50 favorable; Direct labor per unit 21,500, 21,000, (500) unfavorable; Variable manufacturing overhead 4,100, 4,200, 100 favorable; Fixed manufacturing overhead 28,900, 29,000, 100 favorable; Equals Total cost of goods sold 60,050, 59,800, (250) unfavorable and Gross profit of 44,950, 45,200, (250) unfavorable. Variable sales and admin 3,550, 3,500, (50) unfavorable; Fixed sales and admin 17,500, 18,000, 500 favorable; Income taxes 985, 1,000, 15 favorable; Equals Total other expenses 22,035, 22,500, 465 favorable; Equals Net income of 22,915, 22,700, 215 favorable. Return
