
10.3 Financial Budgets
Now that you have developed an understanding of operating budgets, let’s turn to the other primary component of the master budget: financial budgets. Preparing financial budgets involves examining the expectations for financing the operations of the business and planning for the cash needs of the organization. The budget helps estimate the source, amount, and timing of cash collection and cash payments as well as determine if and when additional financing is needed or debt can be paid.
Individual Financial Budgets
Preparing a financial budget first requires preparing the capital asset budget, the cash budgets, and the budgeted balance sheet. The capital asset budget represents a significant investment in cash, and the amount is carried to the cash budget. Therefore, it needs to be prepared before the cash budget. If the cash will not be available, the capital asset budget can be adjusted and, again, carried to the cash budget.
When the budgets are complete, the beginning and ending balance from the cash budget, changes in financing, and changes in equity are shown on the budgeted balance sheet.
Capital Asset Budget
The capital asset budget, also called the capital expenditure budget, shows the company’s plans to invest in long-term assets. Some assets, such as computers, must be replaced every few years, while other assets, such as manufacturing equipment, are purchased very infrequently. Some assets can be purchased with cash, whereas others may require a loan. Budgeting for these types of expenditures requires long-range planning because the purchases affect cash flows in current and future periods and affect the income statement due to depreciation and interest expenses.
Cash Budget
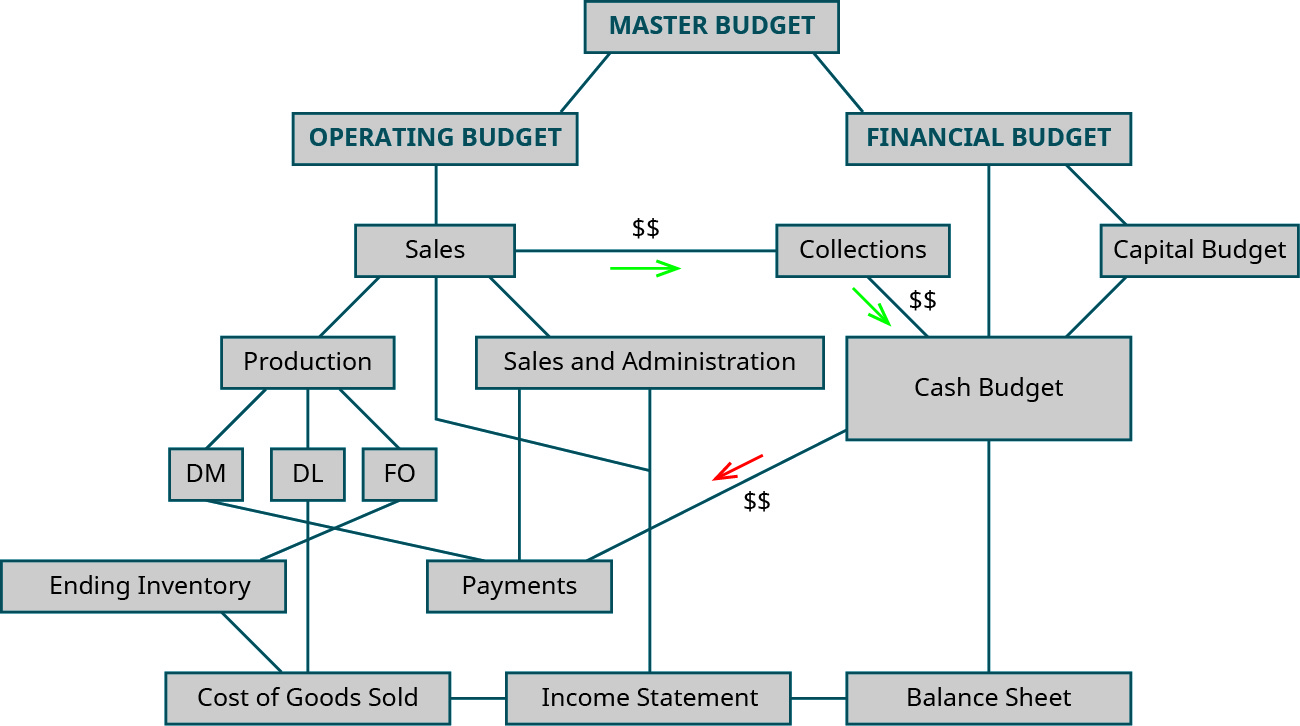
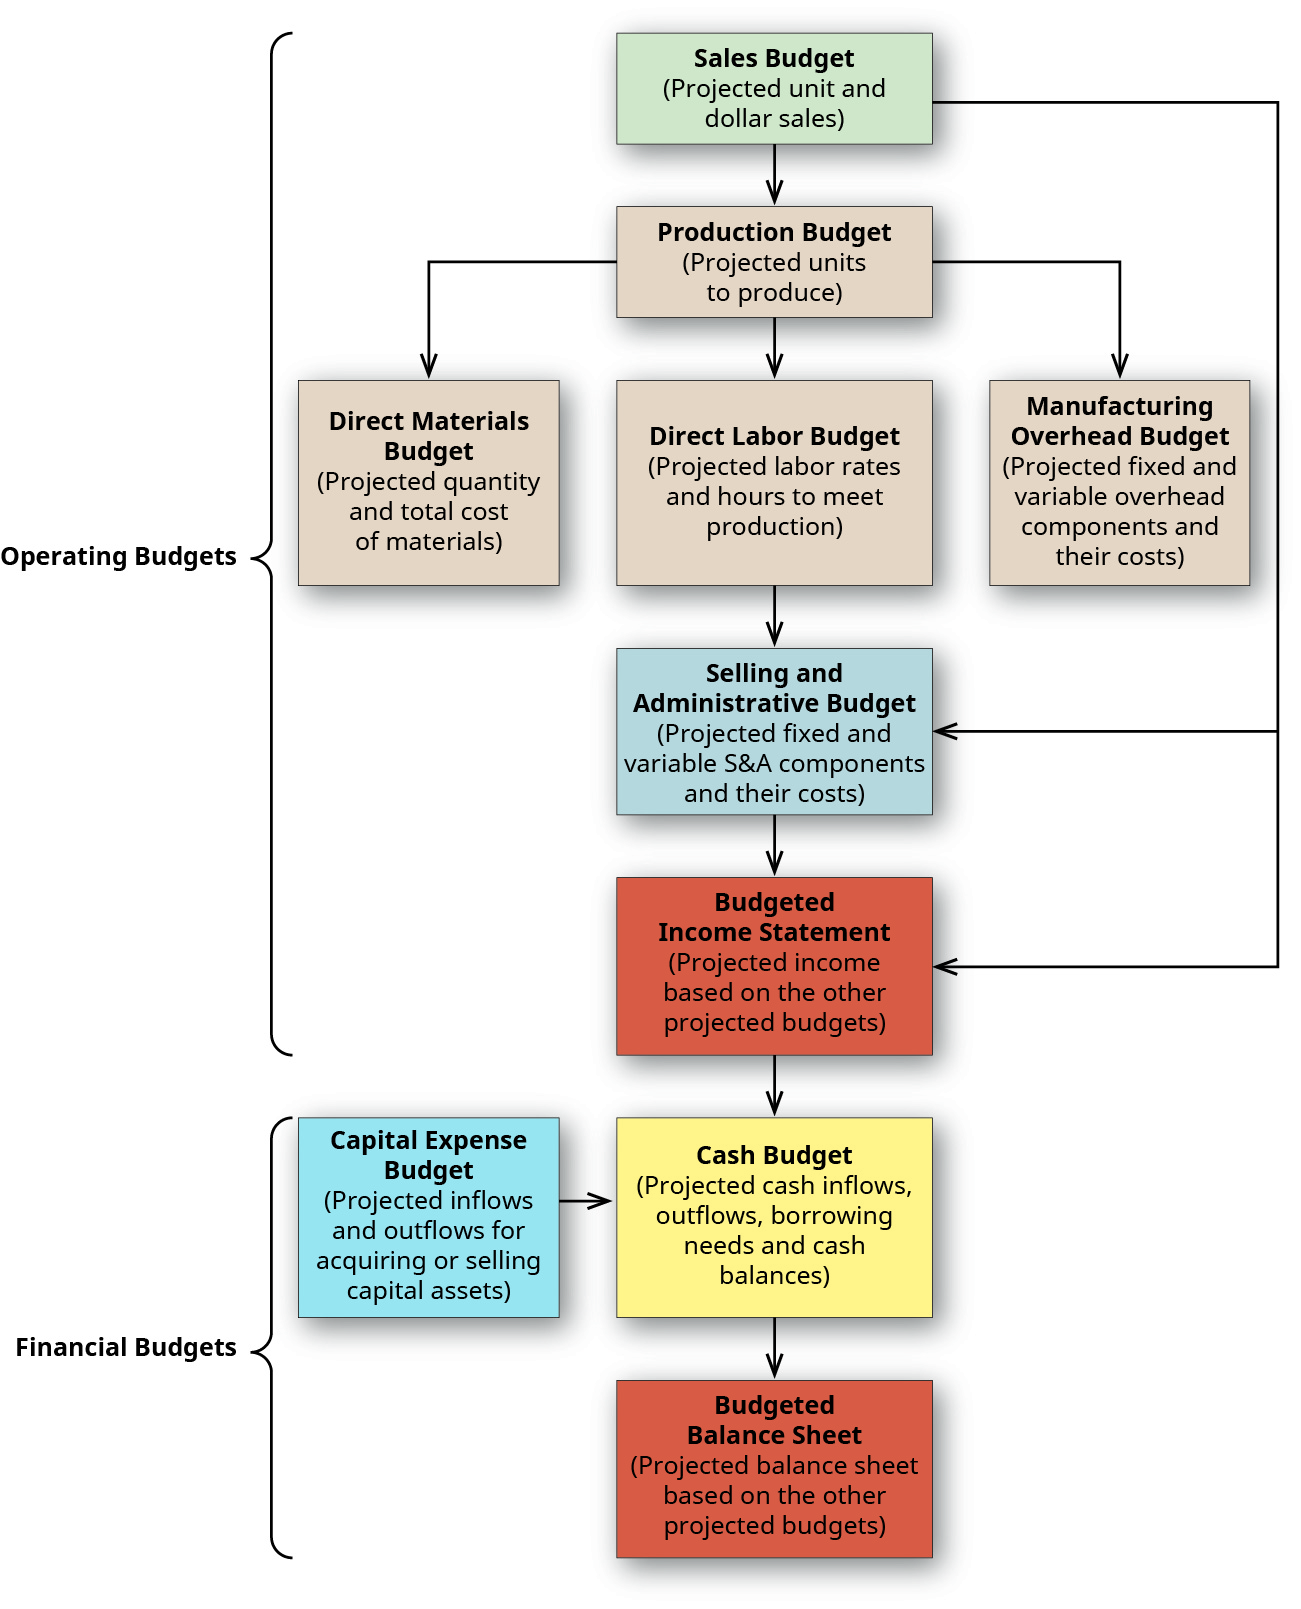
The cash budget is the combined budget of all inflows and outflows of cash. It should be divided into the shortest time period possible, so management can be quickly made aware of potential problems resulting from fluctuations in cash flow. One goal of this budget is to anticipate the timing of cash inflows and outflows, which allows a company to try to avoid a decrease in the cash balance due to paying out more cash than it receives. In order to provide timely feedback and alert management to short-term cash needs, the cash flow budget is commonly geared toward monthly or quarterly figures. Figure 10.15 shows how the other budgets tie into the cash budget.
Cash is so important to the operations of a company that, often, companies will arrange to have an emergency cash source, such as a line of credit, to avoid defaulting on current payables due and also to protect against other unanticipated expenses, such as major repair costs on equipment. This line of credit would be similar in function to the overdraft protection offered on many checking accounts.
Because the cash budget accounts for every inflow and outflow of cash, it is broken down into smaller components. The cash collections schedule includes all of the cash inflow expected to be received from customer sales, whether those customers pay at the same rate or even if they pay at all. The cash collections schedule includes all the cash expected to be received and does not include the amount of the receivables estimated as uncollectible. The cash payments schedule plans the outflow or payments of all accounts payable, showing when cash will be used to pay for direct material purchases. Both the cash collections schedule and the cash payments schedule are included along with other cash transactions in a cash budget. The cash budget, then, combines the cash collection schedule, the cash payment schedule, and all other budgets that plan for the inflow or outflow of cash. When everything is combined into one budget, that budget shows if financing arrangements are needed to maintain balances or if excess cash is available to pay for additional liabilities or assets.
The operating budgets all begin with the sales budget. The cash collections schedule does as well. Since purchases are made at varying times during the period and cash is received from customers at varying rates, data are needed to estimate how much will be collected in the month of sale, the month after the sale, two months after the sale, and so forth. Bad debts also need to be estimated, since that is cash that will not be collected.
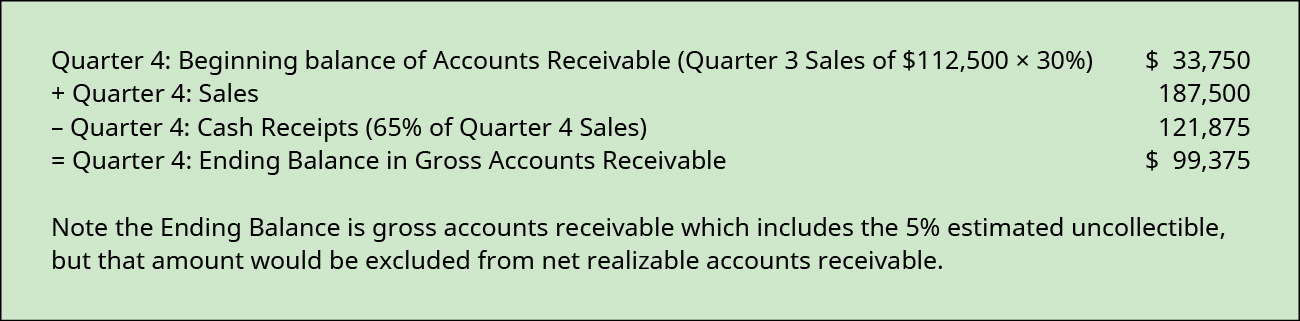
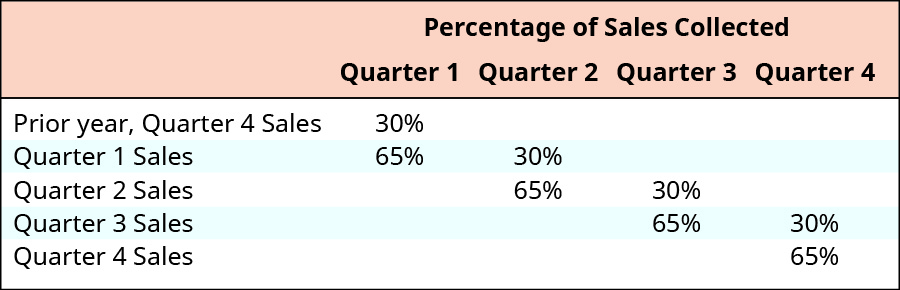
To illustrate, let’s return to Big Bad Bikes. They believe cash collections for the trainer sales will be similar to the collections from their bicycle sales, so they will use that pattern to budget cash collections for the trainers. In the quarter of sales, 65% of that quarter’s sales will be collected. In the quarter after the sale, 30% will be collected. This leaves 5% of the sales considered uncollectible. Figure 10.16 illustrates when each quarter’s sales will be collected. An estimate of the net realizable balance of Accounts Receivable can be reconciled by using information from the cash collections schedule:
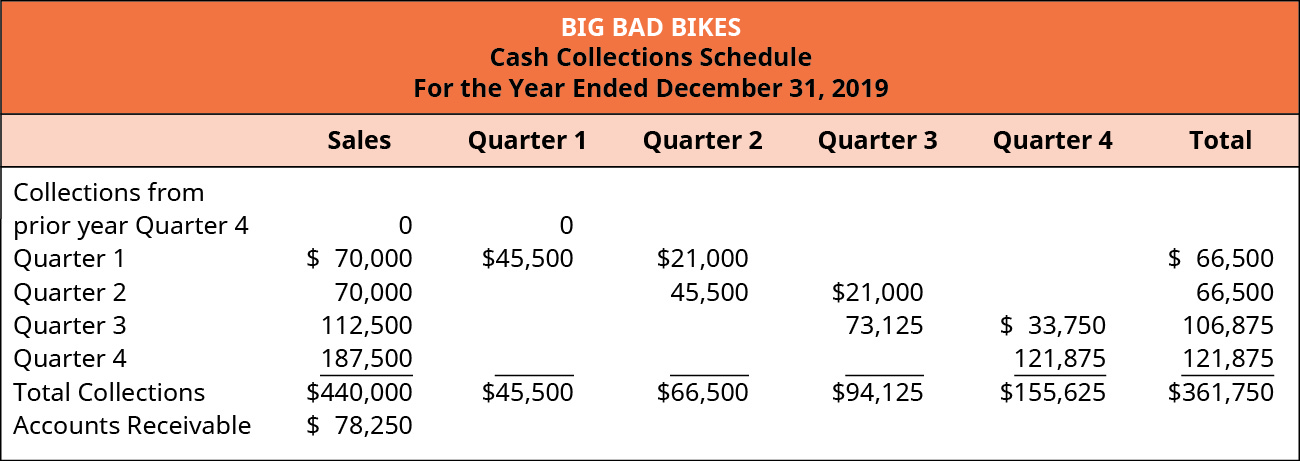
For example, in quarter 1 of year 2, 65% of the quarter 1 sales will be collected in cash, as well as 30% of the sales from quarter 4 of the prior year. There were no sales in quarter 4 of the prior year so 30% of zero sales shows the collections are $0. Using information from Big Bad Bikes sales budget, the cash collections from the sales are shown in Figure 10.18.
When the cash collections schedule is made for sales, management must account for other potential cash collections such as cash received from the sale of equipment or the issuance of stock. These are listed individually in the cash inflows portion of the cash budget.
The cash payments schedule, on the other hand, shows when cash will be used to pay for Accounts Payable. One such example are direct material purchases, which originates from the direct materials budget. When the production budget is determined from the sales, management prepares the direct materials budget to determine when and how much material needs to be ordered. Orders for materials take place throughout the quarter, and payments for the purchases are made at different intervals from the orders. A schedule of cash payments is similar to the cash collections schedule, except that it accounts for the company’s purchases instead of the company’s sales. The information from the cash payments schedule feeds into the cash budget.
Big Bad Bikes typically pays half of its purchases in the quarter of purchase. The remaining half is paid in the following quarter, so payments in the first quarter include payments for purchases made during the first quarter as well as half of the purchases for the preceding quarter. Figure 10.19 shows when each quarter’s purchases will be paid. Additionally, the balance of purchases in Accounts Payable can be reconciled by using information from the cash payment schedule as follows:

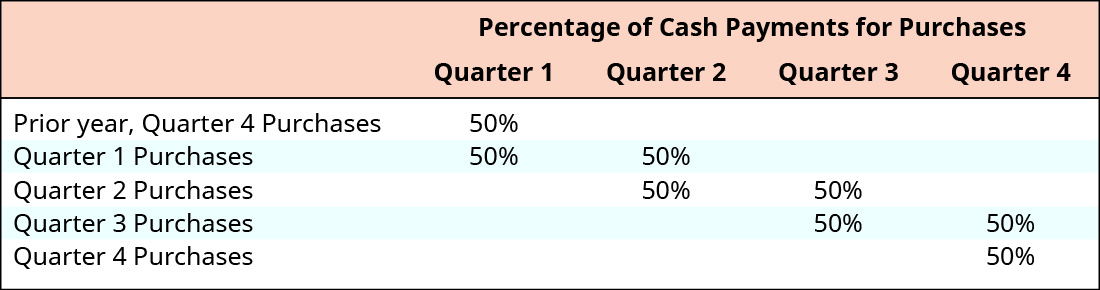
The first quarter of the year plans cash payments from the prior quarter as well as the current quarter. Again, since the trainers are a new product, in this example, there are no purchases in the preceding quarter, and the payments are $0. Figure 10.21.

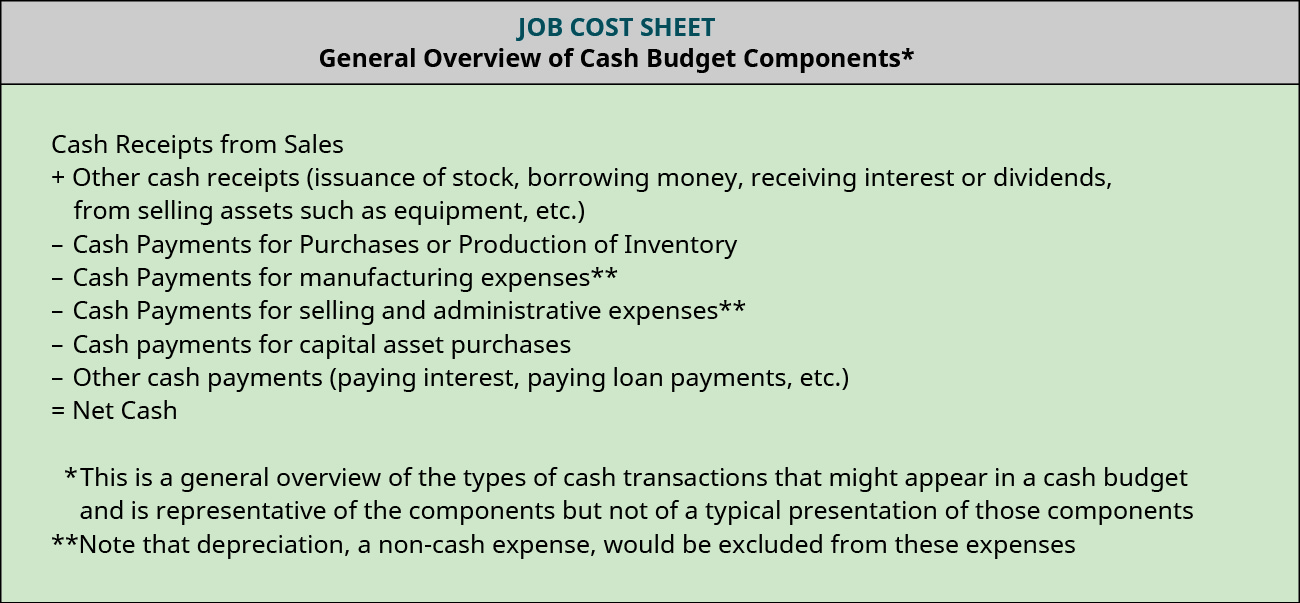
While the cash payments schedule is made for purchases of material on account, there are other outflows of cash for the company, and management must estimate all other cash payments for the year. Typically, this includes the manufacturing overhead budget, the sales and administrative budget, the capital asset budget, and any other potential payments of cash. Since depreciation is an expense not requiring cash, the cash budget includes the amount from the budgets less depreciation. Cash payments are listed on the cash budget following cash receipts. Figure 10.22 shows the major components of the cash budget.
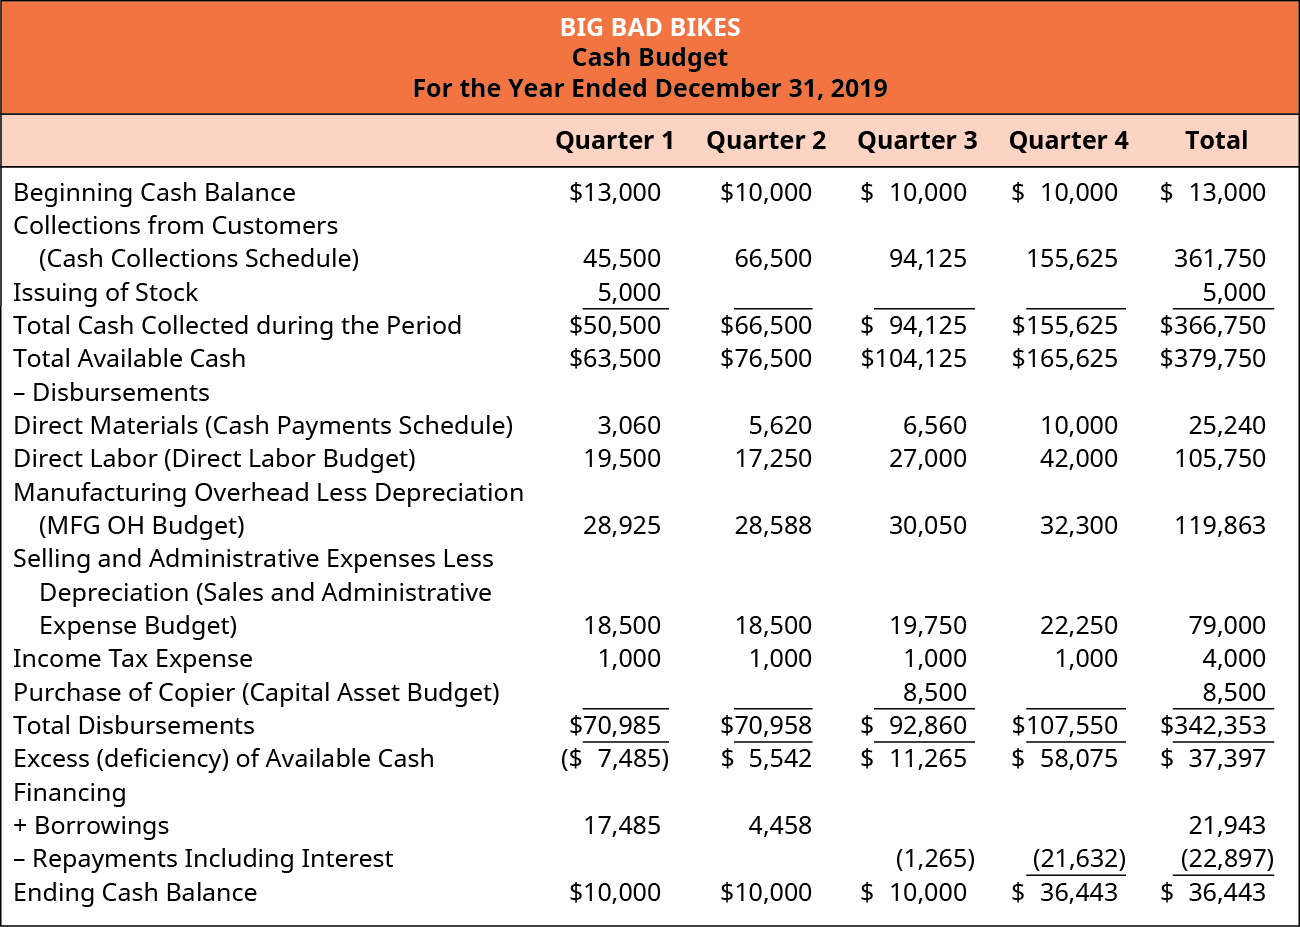
The cash budget totals the cash receipts and adds it to the beginning cash balance to determine the available cash. From the available cash, the cash payments are subtracted to compute the net cash excess or deficiency of cash for the quarter. This amount is the potential ending cash balance. Organizations typically require a minimum cash balance. If the potential ending cash balance does not meet the minimum amount, management must plan to acquire financing to reach that amount. If the potential ending cash balance exceeds the minimum cash balance, the excess amount may be used to pay any financing loans and interest.
Big Bad Bikes has a minimum cash balance requirement of $10,000 and has a line of credit available for an interest rate of 19%. They also plan to issue additional capital stock for $5,000 in the first quarter, to pay taxes of $1,000 during each quarter, and to purchase a copier for $8,500 cash in the third quarter. The beginning cash balance for Big Bad Bikes is $13,000, which can be used to create the cash budget shown in Figure 10.23.
Budgeted Balance Sheet
The cash budget shows how cash changes from the beginning of the year to the end of the year, and the ending cash balance is the amount shown on the budgeted balance sheet. The budgeted balance sheet is the estimated assets, liabilities, and equities that the company would have at the end of the year if their performance were to meet its expectations. Table 10.1 shows a list of the most common changes to the balance sheet and where the information is derived.
| Information Source | Balance Sheet Change |
|---|---|
| Cash balance | ending cash balance from the cash budget |
| Accounts Receivable balance | uncollected receivables from the cash collections schedule |
| Inventory | ending balance in inventory as shown from calculations to create the income statement |
| Machinery & Equipment | ending balance in the capital asset budget |
| Accounts Payable | unpaid purchases from the cash payments schedule |
Other balance sheet changes throughout the year are reflected in the income statement and statement of cash flows. For example, the beginning cash balance of Accounts Receivable plus the sales, less the cash collected results in the ending balance of Accounts Receivable. A similar formula is used to compute the ending balance in Accounts Payable. Other budgets and information such as the capital asset budget, depreciation, and financing loans are used as well.
To explain how to use a budgeted balance sheet, let’s return to Big Bad Bikes. For simplicity, assume that they did not have accounts receivable or payable at the beginning of the year. They also incurred and paid back their financing during the year, so there is no ending debt. However, the cash budget shows cash inflows and outflows not related to sales or the purchase of materials. The company’s capital assets increased by $8,500 from the copier purchase, and their common stock increased by $5,000 from the additional issue as shown in Figure 10.24.

Though there seem to be many budgets, they all fit together like a puzzle to create an overall picture of how a company expects the upcoming business year to look. Figure 10.15 detailed the components of the master budget, and can be used to summarize the budget process. All budgets begin with the sales budget. This budget estimates the number of units that need to be manufactured and precedes the production budget. The production budget (refer to Figure 10.5) provides the necessary information for the budgets needed to plan how many units will be produced. Knowing how many units need to be produced from the production budget, the direct materials budget, direct labor budget, and the manufacturing overhead budget are all prepared. The sales and administrative budget is a nonmanufacturing budget that relies on the sales estimates to pay commissions and other variable expenses. The sales and expenses estimated in all of these budgets are used to develop a budgeted income statement.
The estimated sales information is used to prepare the cash collections schedule, and the direct materials budget is used to prepare the cash payment schedule. The cash receipts and cash payments budget are combined with the direct labor budget, the manufacturing overhead budget, the sales and administrative budget, and the capital assets budget to develop the cash budget. Finally, all the information is used to flow to the budgeted balance sheet.
YOUR TURN
Creating a Master Budget… order the steps.
Long Descriptions
Flow chart of the calculations for budgets. The Master Budget is at the top in purple. From it flow to lines to the Operating budget (all operating budgets are in yellow) and the Financial budget (all financial budgets are in blue). From the Operating Budget is a line going to the Sales budget (yellow). A green line goes from this Sales Budget to the Collections Budget (blue) to represent cash inflow. The Sales budget also has lines going to the D M, D L, and F O budgets (all yellow) which flow down to the Ending Inventory (yellow) and Payments (blue) Budgets. From the D M, D L, F O, and Ending Inventory Budgets flow lines to the C O G S Budget, which flows to the Income Statement Budget (all yellow). Also from the Sales Budget is a line going to the Selling & A D M Budget (both yellow), which flows to the Payments Budget (blue). From the Sales and Selling and A D M Budgets there are lines going to the Income Statement (all yellow). From the Financial Budget a line goes to the Cash Budget. This has inflow from the Collections Budget (with the green line representing cash inflow) and outflow to the Payments Budget with a red line representing cash outflow). There are also lines from the Cash Budget going to the Capital Budget and the Balance Sheet Budget. All of these mentioned budgets are blue. The Balance sheet also has lines going to it from the Income Statement (yellow) and the Capital Budget (blue). Return
Quarter 4: Beginning balance of Accounts Receivable (Q 3 sales of $112,500 times 35% plus Q 2 sales of 70,000 times 5% plus Q 1 sales of 70,000 times 5%) $46,375 plus Quarter 4 sales 187,500 less Quarter 3 cash receipts (65% of quarter 4 sales equals 121,875 and 30% of quarter 3 sales equals 33,750) 155,625 equals Quarter 4 ending balance in gross accounts receivable 78,250. Return
Percentage of Sales Collected: In quarter 1: 30 percent of prior year quarter 4 sales plus 65 percent of quarter 1 sales. In quarter 2: 30 percent of quarter 1 sales plus 65 percent of quarter 2 sales. In quarter 3: 30 percent of quarter 2 sales plus 65 percent of quarter 3 sales. In quarter 4: 30 percent of quarter 3 sales plus 65 percent of quarter 4 sales. Return
Big Bad Bikes, Cash Collections Schedule For the Year Ending December 31, 2019 Collections from: prior year Quarter 4 $0 sales, 0 quarter 1, 0 total; Quarter 1 $70,000 sales, $45,500 Q 1, 21,000 Q 2, 66,500 total; Quarter 2 70,000 sales, 45,500 Q 2, 21,000 Q 3, 66,500 total; Quarter 3 112,500 sales, 73,123 Q3, 33,750 Q4, 106,875 total; Quarter 4 187,500 sales, 121,875 Q 4, 121,875 total; Total collections on $440,000 sales, 45,500 Q 1, 66,500 Q 2, 94,125 Q 3, 155,625 Q 4, $361,750 total; Accounts receivable: 440,000 sales minus 361,750 collections equals $78,250. Return
Quarter 4: Beginning balance of Accounts Payable $4,000* plus Quarter 4: Purchase of direct material 12,000 minus Quarter 4: Cash Payments 10,000 equals Quarter 4: Ending balance in Accounts Payable $6,000*; *Big Bad Bikes has a policy of paying 50 percent of purchases in the quarter of purchases, and the remaining 50 percent the month after the purchase. The beginning balance of accounts payable should be 50 percent of the prior quarter’s purchases. Return
Big Bad Bikes, Cash Payments Schedule For the Year Ending December 31, 2019. Payments from: prior year Quarter 4 $0 purchases, 0 quarter 1, 0 total; Quarter 1 $6,120 purchases, $3,060 Q 1, 3,060 Q 2, 6,120 total; Quarter 2 5,120 purchases, 2,560 Q 2, 2,560 Q 3, 5,120 total; Quarter 3 8,000 purchases,4,000 Q 3, 4,000 Q 4, 8,000 total; Quarter 4 12,000 purchases, 6,000 Q 4, 6,000 total; Total payments on $31,240 purchases, 3,060 Q 1, 5,620 Q 2, 6,560 Q 3, 10,000 Q 4, $25,240 Total. Return
General Overview of Cash Budget Components* Cash Receipts from Sales plus Other cash receipts (issuance of stock, borrowing money, receiving interest or dividends, from selling assets such as equipment, etc.) minus Cash Payments for Purchases or Production of Inventory minus Cash Payments for manufacturing expenses** minus Cash Payments for selling and administrative expenses ** minus Cash payments for capital asset purchases minus Other cash payments (paying interest, paying loan payments, etc.) equals Net Cash; *This is a general overview of the types of cash transactions that might appear in a cash budget and its representative of the components but not of a typical presentation of those components; **Note that depreciation, a non-cash expense, would be excluded from these expenses. Return
Big Bad Bikes, Cash Budget, For the Year Ending December 31, 2019, Quarter 1, Quarter 2, Quarter 3, Quarter 4, Total (respectively): Beginning cash balance, $13,000, 10,000, 10,000, 10,000, 13,000; Collections from customers (Cash Collection Schedule) 45,500, 66,500, 94,125, 155,625, 361,750; Issuing of stock 5,000 –, –, –, 5,000; Total cash collected during the period 50,500, 66,500, 94,125, 155,625, 366,750; Total available cash 63,500, 76,500, 104,125, 165,625, 379,750; Less disbursements: Direct materials (cash payment schedule) 3,060, 5,620, 6,560, 10,000, 25,240; Direct labor (direct labor budget) 19,500, 17,250, 27,000, 42,000, 105,750; Manufacturing overhead less depreciation (MFG OH Budget) 28,925, 28,588, 30,050, 32,300, 119,863; Selling and Administrative expenses less depreciation (Sales and Admin. Expenses Budget) 18,500, 18,500, 19,750, 22,250, 79,000; Income tax expense 1,000, 1,000, 1,000, 1,000, 4,000; Purchase of copier (Capital Assets Budget) –, –, 8,500, –, 8,500; Total disbursements 70,985, 70,958, 90,860, 107,550, 342,353; Excess (deficiency) of available cash (7,485), 5,542, 11,265, 58,075, 37,397; Financing: Add borrowing 17,485, 4,458, –, –, 21,943; Less repayments including interest –, –, (1,265), (21,632), (22,897).Ending cash balance, 10,000, 10,000, 10,000, 36,443, 36,443. Return
Big Bad Bikes, Budgeted Balance Sheet, December 31, 2019 Jan 1 and Dec. 31, respectively: Cash 13,000, 36,443; Accounts Receivable 0, 78250; Less allowance for doubtful accounts 0, (22,000); Inventory 0, 42,629; Machinery and equipment 15,000, 23,500; Accumulated Depreciation (2,000), (22,000); Total assets $26,000, $136,822; Accounts Payable 0, 6,000; Line of credit 0, 0; Common Stock 15,000, 20,000; Retained Earnings 11,000, 110, 822; Total Liabilities and Owner’s Equity $26,000, $136,822. Return
