
2.6 Accounting for Inventory
Accounting for inventory is a critical function of management. Inventory accounting is significantly complicated by the fact that it is an ongoing process of constant change, in part because (1) most companies offer a large variety of products for sale, (2) product purchases occur at irregular times, (3) products are acquired for differing prices, and (4) inventory acquisitions are based on sales projections, which are always uncertain and often sporadic. Merchandising companies must meticulously account for every individual product that they sell, equipping them with essential information, for decisions such as these:
- What is the quantity of each product that is available to customers?
- When should inventory of each product item be replenished and at what quantity?
- How much should the company charge customers for each product to cover all costs plus profit margin?
- How much of the inventory cost should be allocated toward the units sold (cost of goods sold) during the period?
- How much of the inventory cost should be allocated toward the remaining units (ending inventory) at the end of the period?
- Is each product moving robustly or have some individual inventory items’ activity decreased?
- Are some inventory items obsolete?
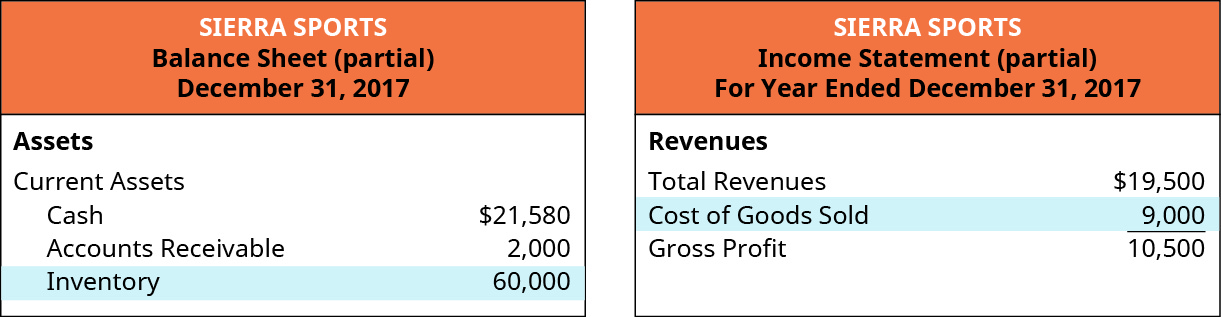
The company’s financial statements report the combined cost of all items sold as an offset to the proceeds from those sales, producing the net number referred to as gross margin (or gross profit). This is presented in the first part of the results of operations for the period on the multi-step income statement. The unsold inventory at period end is an asset to the company and is therefore included in the company’s financial statements, on the balance sheet, as shown in Figure 2.73. The total cost of all the inventory that remains at period end, reported as merchandise inventory on the balance sheet, plus the total cost of the inventory that was sold or otherwise removed (through shrinkage, theft, or other loss), reported as cost of goods sold on the income statement (see Figure 2.73), represent the entirety of the inventory that the company had to work with during the period, or goods available for sale.
Fundamentals of Inventory
Although our discussion will consider inventory issues from the perspective of a retail company, using a resale or merchandising operation, inventory accounting also encompasses recording and reporting of manufacturing operations. In the manufacturing environment, there would be separate inventory calculations for the various process levels of inventory, such as raw materials, work in process, and finished goods. The manufacturer’s finished goods inventory is equivalent to the merchandiser’s inventory account in that it includes finished goods that are available for sale.
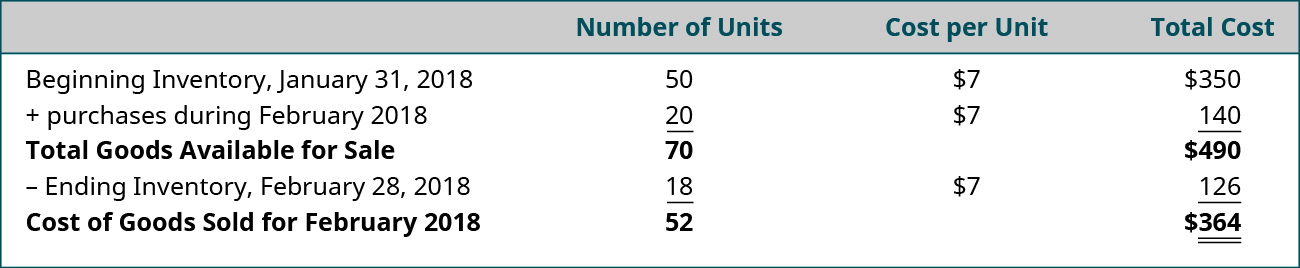
In merchandising companies, inventory is a company asset that includes beginning inventory plus purchases, which include all additions to inventory during the period. Every time the company sells products to customers, they dispose of a portion of the company’s inventory asset. Goods available for sale refers to the total cost of all inventory that the company had on hand at any time during the period, including beginning inventory and all inventory purchases. These goods were normally either sold to customers during the period (occasionally lost due to spoilage, theft, damage, or other types of shrinkages) and thus reported as cost of goods sold, an expense account on the income statement, or these goods are still in inventory at the end of the period and reported as ending merchandise inventory, an asset account on the balance sheet. As an example, assume that Harry’s Auto Parts Store sells oil filters. Suppose that at the end of January 31, 2018, they had 50 oil filters on hand at a cost of $7 per unit. This means that at the beginning of February, they had 50 units in inventory at a total cost of $350 (50 × $7). During the month, they purchased 20 filters at a cost of $7, for a total cost of $140 (20 × $7). At the end of the month, there were 18 units left in inventory. Therefore, during the month of February, they sold 52 units. Figure 2.74 illustrates how to calculate the goods available for sale and the cost of goods sold.
Inventory costing is accomplished by one of four specific costing methods: (1) specific identification, (2) first-in, first-out, (3) last-in, first-out, and (4) weighted-average cost methods. All four methods are techniques that allow management to distribute the costs of inventory in a logical and consistent manner, to facilitate matching of costs to offset the related revenue item that is recognized during the period, in accordance with GAAP expense recognition and matching concepts. Note that a company’s cost allocation process represents management’s chosen method for expensing product costs, based strictly on estimates of the flow of inventory costs, which is unrelated to the actual flow of the physical inventory. Use of a cost allocation strategy eliminates the need for often cost-prohibitive individual tracking of costs of each specific inventory item, for which purchase prices may vary greatly. In this chapter, you will be provided with some background concepts and explanations of terms associated with inventory as well as a basic demonstration of each of the four allocation methods, and then further delineation of the application and nuances of the costing methods.
Data for Demonstration of the Four Basic Inventory Valuation Methods
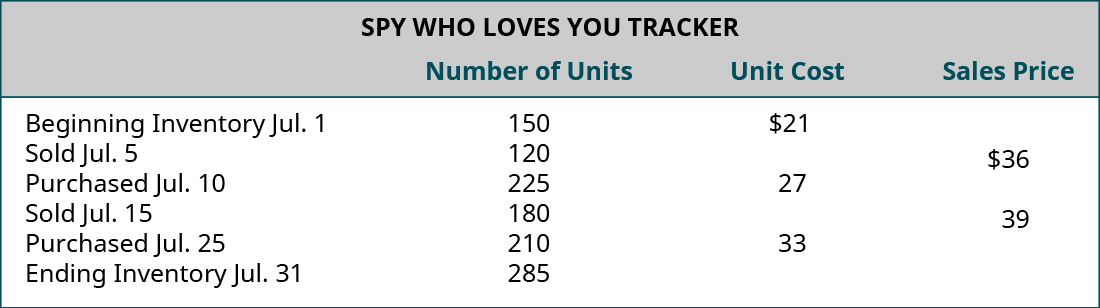
The following dataset will be used to demonstrate the application and analysis of the four methods of inventory accounting.
Company: Spy Who Loves You Corporation
Product: Global Positioning System (GPS) Tracking Device
Description: This product is an economical real-time GPS tracking device, designed for individuals who wish to monitor others’ whereabouts. It is marketed to parents of middle school and high school students as a safety measure. Parents benefit by being apprised of the child’s location, and the student benefits by not having to constantly check in with parents. Demand for the product has spiked during the current fiscal period, while supply is limited, causing the selling price to escalate rapidly.
Specific Identification Method
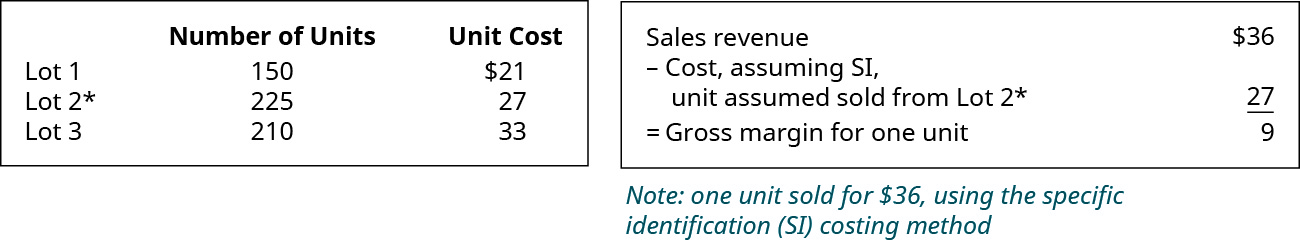
The specific identification method refers to tracking the actual cost of the item being sold and is generally used only on expensive items that are highly customized (such as tracking detailed costs for each individual car in automobiles sales) or inherently distinctive (such as tracking origin and cost for each unique stone in diamond sales). This method is too cumbersome for goods of large quantity, especially if there are not significant feature differences in the various inventory items of each product type. However, for purposes of this demonstration, assume that the company sold one specific identifiable unit, which was purchased in the second lot of products, at a cost of $27.
Three separate lots of goods are purchased:
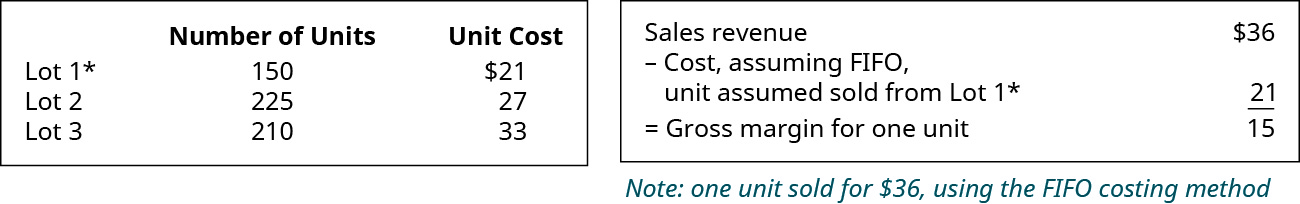
First-in, First-out (FIFO) Method
The first-in, first-out method (FIFO) records costs relating to a sale as if the earliest purchased item would be sold first. However, the physical flow of the units sold under both the periodic and perpetual methods would be the same. Due to the mechanics of the determination of costs of goods sold under the perpetual method, based on the timing of additional purchases of inventory during the accounting period, it is possible that the costs of goods sold might be slightly different for an accounting period. Since FIFO assumes that the first items purchased are sold first, the latest acquisitions would be the items that remain in inventory at the end of the period and would constitute ending inventory.
Three separate lots of goods are purchased:
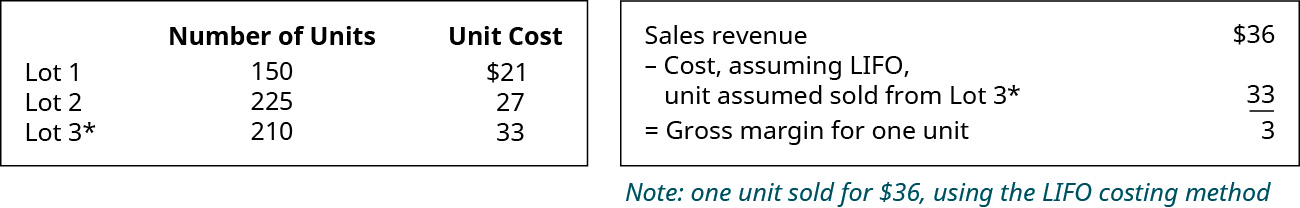
Last-in, First-out (LIFO) Method
The last-in, first out method (LIFO) records costs relating to a sale as if the latest purchased item would be sold first. As a result, the earliest acquisitions would be the items that remain in inventory at the end of the period.
Three separate lots of goods are purchased:
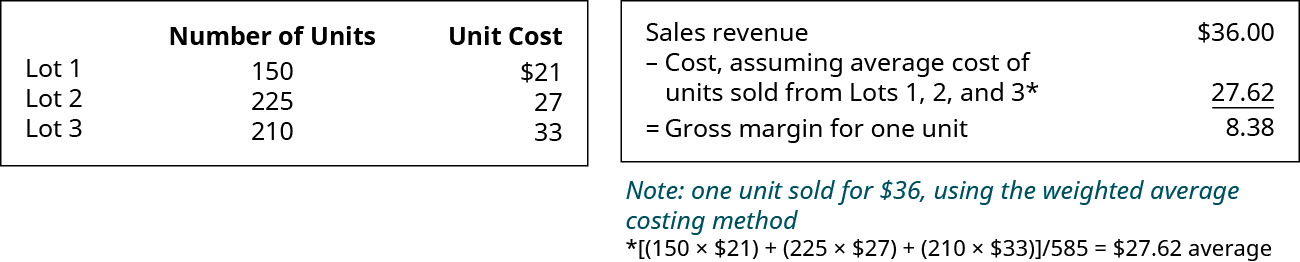
Weighted-Average Cost Method
The weighted-average cost method (sometimes referred to as the average cost method) requires a calculation of the average cost of all units of each particular inventory items. The average is obtained by multiplying the number of units by the cost paid per unit for each lot of goods, then adding the calculated total value of all lots together, and finally dividing the total cost by the total number of units for that product. As a caveat relating to the average cost method, note that a new average cost must be calculated after every change in inventory to reassess the per-unit weighted-average value of the goods. This laborious requirement might make use of the average method cost-prohibitive.
Three separate lots of goods are purchased:
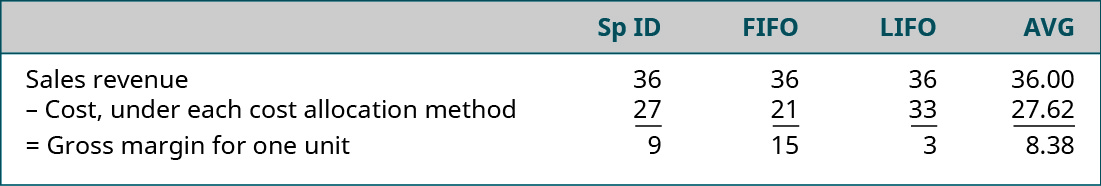
Comparing the various costing methods for the sale of one unit in this simple example reveals a significant difference that the choice of cost allocation method can make. Note that the sales price is not affected by the cost assumptions; only the cost amount varies, depending on which method is chosen. Figure 2.80 depicts the different outcomes that the four methods produced.
Once the methods of costing are determined for the company, that methodology would typically be applied repeatedly over the remainder of the company’s history to accomplish the generally accepted accounting principle of consistency from one period to another. It is possible to change methods if the company finds that a different method more accurately reflects results of operations, but the change requires disclosure in the company’s notes to the financial statements, which alerts financial statement users of the impact of the change in methodology. Also, it is important to realize that although the Internal Revenue Service generally allows differing methods of accounting treatment for tax purposes than for financial statement purposes, an exception exists that prohibits the use of LIFO inventory costing on the company tax return unless LIFO is also used for the financial statement costing calculations.
Additional Inventory Issues
Various other issues that affect inventory accounting include consignment sales, transportation and ownership issues, inventory estimation tools, and the effects of inflationary versus deflationary cycles on various methods.
Consignment
Consigned goods refer to merchandise inventory that belongs to a third party but which is displayed for sale by the company. These goods are not owned by the company and thus must not be included on the company’s balance sheet nor be used in the company’s inventory calculations. The company’s profit relating to consigned goods is normally limited to a percentage of the sales proceeds at the time of sale.
For example, assume that you sell your office and your current furniture doesn’t match your new building. One way to dispose of the furniture would be to have a consignment shop sell it. The shop would keep a percentage of the sales revenue and pay you the remaining balance. Assume in this example that the shop will keep one-third of the sales proceeds and pay you the remaining two-thirds balance. If the furniture sells for $15,000, you would receive $10,000 and the shop would keep the remaining $5,000 as its sales commission. A key point to remember is that until the inventory, in this case your office furniture, is sold, you still own it, and it is reported as an asset on your balance sheet and not an asset for the consignment shop. After the sale, the buyer is the owner, so the consignment shop is never the property’s owner.
Lower-of-Cost-or-Market (LCM)
Reporting inventory values on the balance sheet using the accounting concept of conservatism (which discourages overstatement of net assets and net income) requires inventory to be calculated and adjusted to a value that is the lower of the cost calculated using the company’s chosen valuation method or the market value based on the market or replacement value of the inventory items. Thus, if traditional cost calculations produce inventory values that are overstated, the lower-of-cost-or-market (LCM) concept requires that the balance in the inventory account should be decreased to the more conservative replacement value rather than be overstated on the balance sheet.
Estimating Inventory Costs: Gross Profit Method and Retail Inventory Method
Sometimes companies have a need to estimate inventory values. These estimates could be needed for interim reports, when physical counts are not taken. The need could be result from a natural disaster that destroys part or all of the inventory or from an error that causes inventory counts to be compromised or omitted. Some specific industries (such as select retail businesses) also regularly use these estimation tools to determine cost of goods sold. Although the method is predictable and simple, it is also less accurate since it is based on estimates rather than actual cost figures.
The gross profit method is used to estimate inventory values by applying a standard gross profit percentage to the company’s sales totals when a physical count is not possible. The resulting gross profit can then be subtracted from sales, leaving an estimated cost of goods sold. Then the ending inventory can be calculated by subtracting cost of goods sold from the total goods available for sale. Likewise, the retail inventory method estimates the cost of goods sold, much like the gross profit method does, but uses the retail value of the portions of inventory rather than the cost figures used in the gross profit method.
Inflationary Versus Deflationary Cycles
As prices rise (inflationary times), FIFO ending inventory account balances grow larger even when inventory unit counts are constant, while the income statement reflects lower cost of goods sold than the current prices for those goods, which produces higher profits than if the goods were costed with current inventory prices. Conversely, when prices fall (deflationary times), FIFO ending inventory account balances decrease and the income statement reflects higher cost of goods sold and lower profits than if goods were costed at current inventory prices. The effect of inflationary and deflationary cycles on LIFO inventory valuation are the exact opposite of their effects on FIFO inventory valuation.
