6.4 Cost Behavior
Now that we have identified the three key types of businesses, let’s identify cost behaviors and apply them to the business environment. In managerial accounting, different companies use the term cost in different ways depending on how they will use the cost information. Different decisions require different costs classified in different ways. For instance, a manager may need cost information to plan for the coming year or to make decisions about expanding or discontinuing a product or service. In practice, the classification of costs changes as the use of the cost data changes. In fact, a single cost, such as rent, may be classified by one company as a fixed cost, by another company as a committed cost, and by even another company as a period cost. Understanding different cost classifications and how certain costs can be used in different ways is critical to managerial accounting.
Any discussion of costs begins with the understanding that most costs will be classified in one of three ways: fixed costs, variable costs, or mixed costs. The costs that don’t fall into one of these three categories are hybrid costs, which are examined only briefly because they are addressed in more advanced accounting courses. Because fixed and variable costs are the foundation of all other cost classifications, understanding whether a cost is a fixed cost or a variable cost is very important.
Fixed versus Variable Costs
A fixed cost is an unavoidable operating expense that does not change in total over the short term, even if a business experiences variation in its level of activity. Table 6.6 illustrates the types of fixed costs for merchandising, service, and manufacturing organizations.
| Type of Business | Fixed Cost |
|---|---|
| Merchandising | Rent, insurance, managers’ salaries |
| Manufacturing | Property taxes, insurance, equipment leases |
| Service | Rent, straight-line depreciation, administrative salaries, and insurance |
We have established that fixed costs do not change in total as the level of activity changes, but what about fixed costs on a per-unit basis? Let’s examine Tony’s screen-printing company to illustrate how costs can remain fixed in total but change on a per-unit basis.
Tony operates a screen-printing company, specializing in custom T-shirts. One of his fixed costs is his monthly rent of $1,000. Regardless of whether he produces and sells any T-shirts, he is obligated under his lease to pay $1,000 per month. However, he can consider this fixed cost on a per-unit basis, as shown in Figure 6.25.
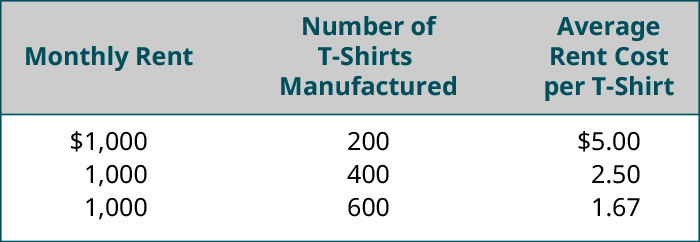
Tony’s information illustrates that, despite the unchanging fixed cost of rent, as the level of activity increases, the per-unit fixed cost falls. In other words, fixed costs remain fixed in total but can increase or decrease on a per-unit basis.
Two specialized types of fixed costs are committed fixed costs and discretionary fixed costs. These classifications are generally used for long-range planning purposes and are covered in upper-level managerial accounting courses, so they are only briefly described here.
Committed fixed costs are fixed costs that typically cannot be eliminated if the company is going to continue to function. An example would be the lease of factory equipment for a production company.
Discretionary fixed costs generally are fixed costs that can be incurred during some periods and postponed during other periods but which cannot normally be eliminated permanently. Examples could include advertising campaigns and employee training. Both of these costs could potentially be postponed temporarily, but the company would probably incur negative effects if the costs were permanently eliminated. These classifications are generally used for long-range planning purposes.
In addition to understanding fixed costs, it is critical to understand variable costs, the second fundamental cost classification. A variable cost is one that varies in direct proportion to the level of activity within the business. Typical costs that are classified as variable costs are the cost of raw materials used to produce a product, labor applied directly to the production of the product, and overhead expenses that change based upon activity. For each variable cost, there is some activity that drives the variable cost up or down. A cost driver is defined as any activity that causes the organization to incur a variable cost. Examples of cost drivers are direct labor hours, machine hours, units produced, and units sold. Table 6.7 provides examples of variable costs and their associated cost drivers.
| - | Variable Cost | Cost Driver |
|---|---|---|
| Merchandising | Total monthly hourly wages for sales staff | Hours business is open during month |
| Manufacturing | Direct materials used to produce one unit of product | Number of units produced |
| Service | Cost of laundering linens and towels | Number of hotel rooms occupied |
Unlike fixed costs that remain fixed in total but change on a per-unit basis, variable costs remain the same per unit, but change in total relative to the level of activity in the business. Revisiting Tony’s T-Shirts, Figure 6.26 shows how the variable cost of ink behaves as the level of activity changes.
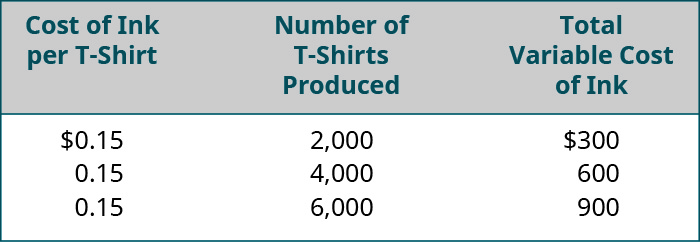
As Figure 6.26 shows, the variable cost per unit (per T-shirt) does not change as the number of T-shirts produced increases or decreases. However, the variable costs change in total as the number of units produced increases or decreases. In short, total variable costs rise and fall as the level of activity (the cost driver) rises and falls.
Distinguishing between fixed and variable costs is critical because the total cost is the sum of all fixed costs (the total fixed costs) and all variable costs (the total variable costs). For every unit produced, every customer served, or every hotel room rented, for example, managers can determine their total costs both per unit of activity and in total by combining their fixed and variable costs together. The graphic in Figure 6.27 illustrates the concept of total costs.
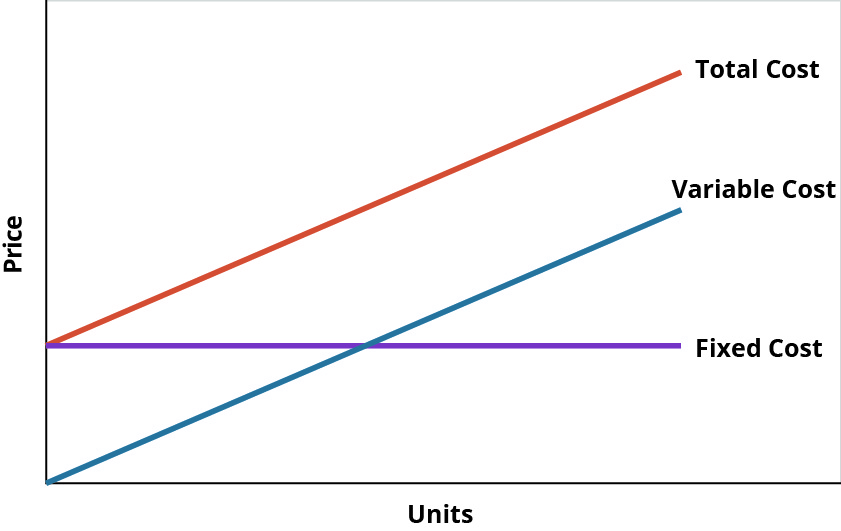
Remember that the reason that organizations take the time and effort to classify costs as either fixed or variable is to be able to control costs. When they classify costs properly, managers can use cost data to make decisions and plan for the future of the business.
CONCEPTS IN PRACTICE
Boeing9
If you’ve ever flown on an airplane, there’s a good chance you know Boeing. The Boeing Company generates around $90 billion each year from selling thousands of airplanes to commercial and military customers around the world. It employs around 200,000 people, and it’s indirectly responsible for more than a million jobs through its suppliers, contractors, regulators, and others. Its main assembly line in Everett, WA, is housed in the largest building in the world, a colossal facility that covers nearly a half-trillion cubic feet. Boeing is, simply put, a massive enterprise.
And yet, Boeing’s managers know the exact cost of everything the company uses to produce its airplanes: every propeller, flap, seat belt, welder, computer programmer, and so forth. Moreover, they know how those costs would change if they produced more airplanes or fewer. They also know the price at which they sold each plane and the profit the company made on each sale. Boeing’s executives expect their managers to know this information, in real time, if the company is to remain profitable.
| Decision | Cost Information |
|---|---|
| Discontinue a product line | Variable costs, overhead directly tied to product, potential reduction in fixed costs |
| Add second production shift | Labor costs, cost of fringe benefits, potential overhead increases (utilities, security personnel) |
| Open additional retail outlets | Fixed costs, variable operating costs, potential increases in administrative expenses at corporate headquarters |
Average Fixed Costs versus Average Variable Costs
Another way management may want to consider their costs is as average costs. Under this approach, managers can calculate both average fixed and average variable costs. Average fixed cost (AFC) is the total fixed costs divided by the total number of units produced, which results in a per-unit cost. The formula is:

To show how a company would use AFC to make business decisions, consider Carolina Yachts, a company that manufactures sportfishing boats that are sold to consumers through a network of marinas and boat dealerships. Carolina Yachts produces 625 boats per year, and their total annual fixed costs are $1,560,000. If they want to determine an average fixed cost per unit, they will find it using the formula for AFC:
When they produce 625 boats, Carolina Yachts has an AFC of $2,496 per boat. What happens to the AFC if they increase or decrease the number of boats produced? Figure 6.29 shows the AFC for different numbers of boats.

We see that total fixed costs remain unchanged, but the average fixed cost per unit goes up and down with the number of boats produced. As more units are produced, the fixed costs are spread out over more units, making the fixed cost per unit fall. Likewise, as fewer boats are manufactured, the average fixed costs per unit rises. We can use a similar approach with variable costs.
Average variable cost (AVC) is the total variable costs divided by the total number of units produced, which results in a per-unit cost. Like ATC, we can use this formula:

To demonstrate AVC, let’s return to Carolina Yachts, which incurs total variable costs of $6,875,000 when they produce 625 boats per year. They can express this as an average variable cost per unit:
Because average variable costs are the average of all costs that change with production levels on a per-unit basis and include both direct materials and direct labor, managers often use AVC to determine if production should continue or not in the short run. As long as the price Carolina Yachts receives for their boats is greater than the per-unit AVC, they know that they are not only covering the variable cost of production, but each boat is making a contribution toward covering fixed costs. If, at any point, the average variable cost per boat rises to the point that the price no longer covers the AVC, Carolina Yachts may consider halting production until the variable costs fall again.
These changes in variable costs per unit could be caused by circumstances beyond their control, such as a shortage of raw materials or an increase in shipping costs due to high gas prices. In any case, average variable cost can be useful for managers to get a big picture look at their variable costs per unit.
Here's a brief video recap based on Econ 102 (Principles of Microeconomics)
Mixed Costs and Stepped Costs
Not all costs can be classified as purely fixed or purely variable. Mixed costs are those that have both a fixed and variable component. It is important, however, to be able to separate mixed costs into their fixed and variable components because, typically, in the short run, we can only change variable costs but not most fixed costs. To examine how these mixed costs actually work, consider the Ocean Breeze hotel.
The Ocean Breeze is located in a resort area where the county assesses an occupancy tax that has both a fixed and a variable component. Ocean Breeze pays $2,000 per month, regardless of the number of rooms rented. Even if it does not rent a single room during the month, Ocean Breeze still must remit this tax to the county. The hotel treats this $2,000 as a fixed cost. However, for every night that a room is rented, Ocean Breeze must remit an additional tax amount of $5.00 per room per night. As a result, the occupancy tax is a mixed cost. Figure 6.31 further illustrates how this mixed cost behaves.

Notice that Ocean Breeze cannot control the fixed portion of this cost and that it remains fixed in total, regardless of the activity level. On the other hand, the variable component is fixed per unit, but changes in total based upon the level of activity. The fixed portion of this cost plus the variable portion of this cost combine to make the total cost. As a result, the formula for total cost looks like this:

where Y is the total mixed cost, a is the fixed cost, b is the variable cost per unit, and x is the level of activity.
Graphically, mixed costs can be explained as shown in Figure 6.33.
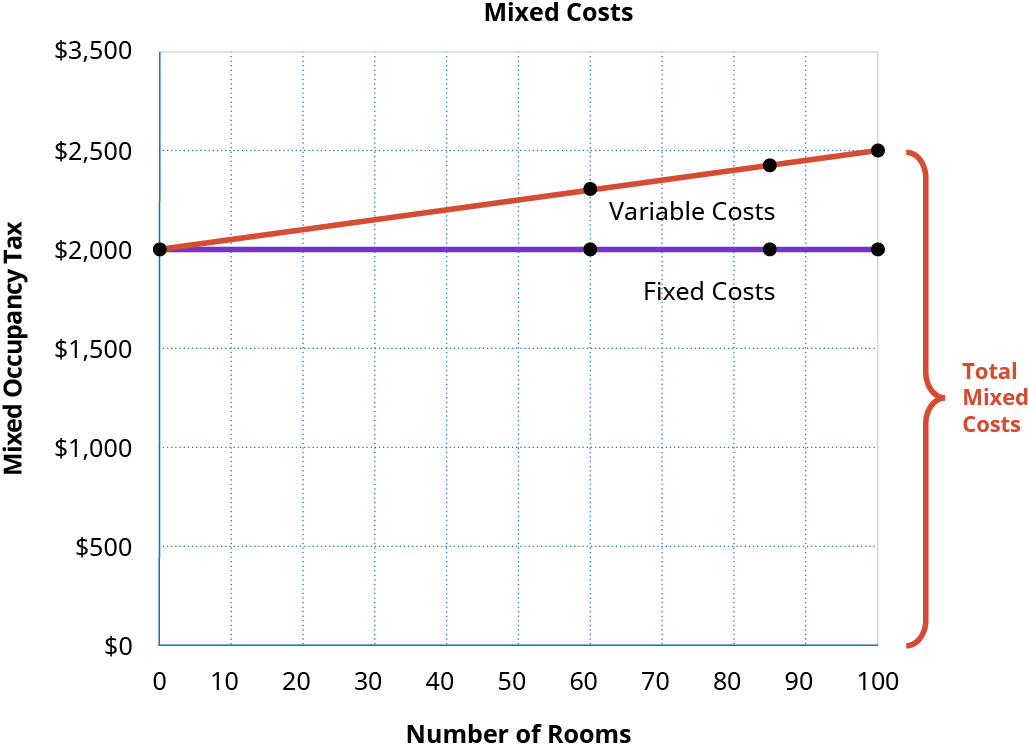
The graph shows that mixed costs are typically both fixed and linear in nature. In other words, they will often have an initial cost, in Ocean Breeze’s case, the $2,000 fixed component of the occupancy tax, and a variable component, the $5 per night occupancy tax. Note that the Ocean Breeze mixed cost graph starts at an initial $2,000 for the fixed component and then increases by $5 for each night their rooms are occupied.
Some costs behave less linearly. A cost that changes with the level of activity but is not linear is classified as a stepped cost. Step costs remain constant at a fixed amount over a range of activity. The range over which these costs remain unchanged (fixed) is referred to as the relevant range, which is defined as a specific activity level that is bounded by a minimum and maximum amount. Within this relevant range, managers can predict revenue or cost levels. Then, at certain points, the step costs increase to a higher amount. Both fixed and variable costs can take on this stair-step behavior. For instance, wages often act as a stepped variable cost when employees are paid a flat salary and a commission or when the company pays overtime. Further, when additional machinery or equipment is placed into service, businesses will see their fixed costs stepped up. The “trigger” for a cost to step up is the relevant range. Graphically, step costs appear like stair steps (Figure 6.34).
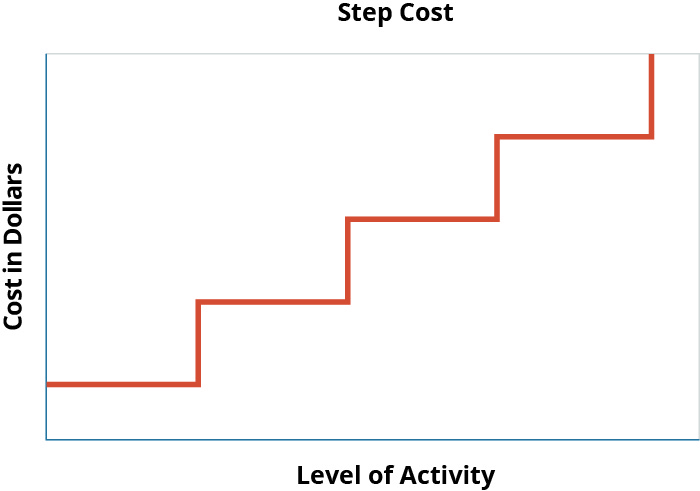
For example, suppose a quality inspector can inspect a maximum of 80 units in a regular 8-hour shift and his salary is a fixed cost. Then the relevant range for QA inspection is from 0–80 units per shift. If demand for these units increases and more than 80 inspections are needed per shift, the relevant range has been exceeded and the business will have one of two choices:
(1) Pay the quality inspector overtime in order to have the additional units inspected. This overtime will “step up” the variable cost per unit. The advantage to handling the increased cost in this way is that when demand falls, the cost can quickly be “stepped down” again. Because these types of step costs can be adjusted quickly and often, they are often still treated as variable costs for planning purposes.
(2) “Step up” fixed costs. If the company hires a second quality inspector, they would be stepping up their fixed costs. In effect, they will double the relevant range to allow for a maximum of 160 inspections per shift, assuming the second QA inspector can inspect an additional 80 units per shift. The down side to this approach is that once the new QA inspector is hired, if demand falls again, the company will be incurring fixed costs that are unnecessary. For this reason, adding salaried personnel to address a short-term increase in demand is not a decision most businesses make.
Step costs are best explained in the context of a business experiencing increases in activity beyond the relevant range. As an example, let’s return to Tony’s T-Shirts.
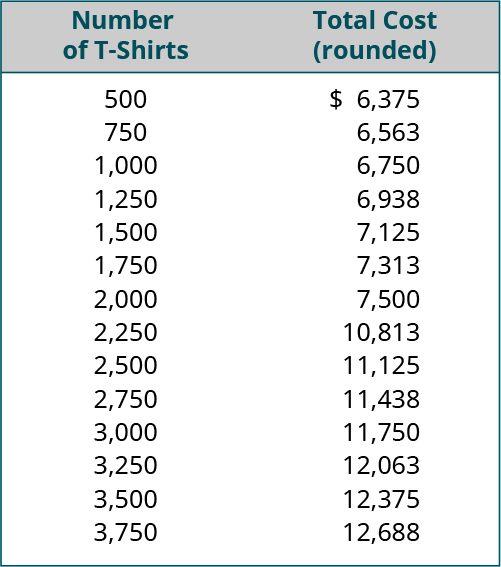
Tony’s cost of operations and the associated relevant ranges are shown in Table 6.9.
| - | Cost | Type of Cost | Relevant Range |
|---|---|---|---|
| Lease on Screen-Printing Machine | $2,000 per month | Fixed | 0–2,000 T-shirts per month |
| Employee | $10 per hour | Variable | 20 shirts per hour |
| Tony’s Salary | $2,500 per month | Fixed | N/A |
| Screen-Printing Ink | $0.25 per shirt | Variable | N/A |
| Building Rent | $1,500 per month | Fixed | 2 screen-printing machines and 2 employees |
As you can see, Tony has both fixed and variable costs associated with his business. His one screen-printing machine can only produce 2,000 T-shirts per month and his current employee can produce 20 shirts per hour (160 per 8-hour work day). The space that Tony leases is large enough that he could add an additional screen-printing machine and 1 additional employee. If he expands beyond that, he will need to lease a larger space, and presumably his rent would increase at that point. It is easy for Tony to predict his costs as long as he operates within the relevant ranges by applying the total cost equation Y = a + bx. So, for Tony, as long as he produces 2,000 or fewer T-shirts, his total cost will be found by Y = $6,000 + $0.75x, where the variable cost of $0.75 is the $0.25 cost of the ink per shirt and $0.50 per shirt for labor ($10 per hour wage/20 shirts per hour). As soon as his production passes the 2,000 T-shirts that his one employee and one machine can handle, he will have to add a second employee and lease a second screen-printing machine. In other words, his fixed costs will rise from $6,000 to $8,000, and his variable cost per T-shirt will rise from $0.75 to $1.25 (ink plus 2 workers). Thus, his new cost equation is Y = $8,000 + $1.25x until he “steps up” again and adds a third machine and moves to a new location with a presumably higher rent. Let’s take a look at this in chart form to better illustrate the “step” in cost Tony will experience as he steps past 2,000 T-shirts.
Tony’s cost information is shown in the chart for volume between 500 and 4,000 shirts.
When presented graphically, notice what happens when Tony steps outside of his original relevant range and has to add a second employee and a second screen-printing machine:
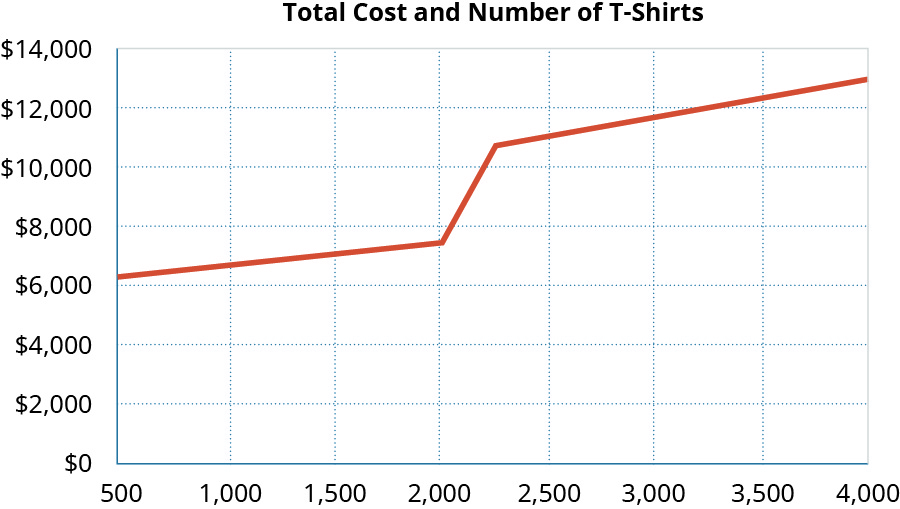
It is important to remember that even though Tony’s costs stepped up when he exceeded his original capacity (relevant range), the behavior of the costs did not change. His fixed costs still remained fixed in total and his total variable cost rose as the number of T-shirts he produced rose. Table 6.10 summarizes how costs behave within their relevant ranges.
| Cost | In Total | Per Unit |
|---|---|---|
| Variable Cost | Changes in response to the level of activity | Remains fixed per unit regardless of the level of activity |
| Fixed Cost | Does not change with the level of activity, within the relevant range, but does change when the relevant range changes | Changes based upon activity within the relevant range: increased activity decreases per-unit cost; decreased activity increases per-unit cost |
Product versus Period Costs
Many businesses can make decisions by dividing their costs into fixed and variable costs, but there are some business decisions that require grouping costs differently. Sometimes companies need to consider how those costs are reported in the financial statements. At other times, companies group costs based on functions within the business. For example, a business would group administrative and selling expenses by the period (monthly or quarterly) so that they can be reported on an Income Statement. However, a manufacturing firm may carry product costs such as materials from one period to the other in order to have the costs “travel” with the units being produced. It is possible that both the selling and administrative costs and materials costs have both fixed and variable components. As a result, it may be necessary to analyze some fixed costs together with some variable costs. Ultimately, businesses strategically group costs in order to make them more useful for decision-making and planning. Two of the broadest and most common grouping of costs are product costs and period costs.
Product costs are all those associated with the acquisition or production of goods and products. When products are purchased for resale, the cost of goods is recorded as an asset on the company’s balance sheet. It is not until the products are sold that they become an expense on the income statement. By moving product costs to the expense account for the cost of goods sold, they are easily matched to the sales revenue income account. For example, Bert’s Bikes is a bicycle retailer who purchases bikes from several wholesale distributors and manufacturers. When Bert purchases bicycles for resale, he places the cost of the bikes into his inventory account, because that is what those bikes are—his inventory available for sale. It is not until someone purchases a bike that it creates sales revenue, and in order to fulfill the requirements of double-entry accounting, he must match that income with an expense: the cost of goods sold (Figure 6.37).

Some product costs have both a fixed and variable component. For example, Bert purchases 10 bikes for $100 each. The distributor charges $10 per bike for shipping for 1 to 10 bikes but $8 per bike for 11 to 20 bikes. This shipping cost is fixed per unit but varies in total. If Bert wants to save money and control his cost of goods sold, he can order an 11th bike and drop his shipping cost by $2 per bike. It is important for Bert to know what is fixed and what is variable so that he can control his costs as much as possible.
What about the costs Bert incurs that are not product costs? Period costs are simply all of the expenses that are not product costs, such as all selling and administrative expenses. It is important to remember that period costs are treated as expenses in the period in which they occur. In other words, they follow the rules of accrual accounting practice by recognizing the cost (expense) in the period in which they occur regardless of when the cash changes hands. For example, Bert pays his business insurance in January of each year. Bert’s annual insurance premium is $10,800, which is $900 per month. Each month, Bert will recognize 1 ÷ 12 of this insurance cost as an expense in the period in which it is incurred (Figure 6.38).

Why is it so important for Bert to know which costs are product costs and which are period costs? Bert may have little control over his product costs, but he maintains a great deal of control over many of his period costs. For this reason, it is important that Bert be able to identify his period costs and then determine which of them are fixed and which are variable. Remember that fixed costs are fixed over the relevant range, but variable costs change with the level of activity. If Bert wants to control his costs to make his bike business more profitable, he must be able to differentiate between the costs he can and cannot control.
Just like a merchandising business such as Bert’s Bikes, manufacturers also classify their costs as either product costs or period costs. For a manufacturing business, product costs are the costs associated with making the product, and period costs are all other costs. For the purposes of external reporting, separating costs into period and product costs is not all that is necessary. However, for management decision-making activities, refinement of the types of product costs is helpful.
In a manufacturing firm, the need for management to be aware of the types of costs that make up the cost of a product is of paramount importance. Let’s look at Carolina Yachts again and examine how they can classify the product costs associated with building their sportfishing boats. Just like automobiles, every year, Carolina Yachts makes changes to their boats, introducing new models to their product line. When the engineers begin to redesign boats for the next year, they must be careful not to make changes that would drive the selling price of their boats too high, making them less attractive to the customer. The engineers need to know exactly what the addition of another feature will do to the cost of production. It is not enough for them to get total product cost data; instead, they need specific information about the three classes of product costs: materials, labor, and overhead.
As you’ve learned, direct materials are the raw materials and component parts that are directly economically traceable to a unit of production.
Table 6.11 provides some examples of direct materials.
| Manufacturing Business | Product | Direct Materials |
|---|---|---|
| Bakery | Birthday cakes | Flour, sugar, eggs, milk |
| Automobile manufacturer | Cars | Glass, steel, tires, carpet |
| Furniture manufacturer | Recliners | Wood, fabric, cotton batting |
In each of the examples, managers are able to trace the cost of the materials directly to a specific unit (cake, car, or chair) produced. Since the amount of direct materials required will change based on the number of units produced, direct materials are almost always classified as a variable cost. They remain fixed per unit of production but change in total based on the level of activity within the business.
It takes more than materials for Carolina Yachts to build a boat. It requires the application of labor to the raw materials and component parts. You’ve also learned that direct labor is the work of the employees who are directly involved in the production of goods or services. In fact, for many industries, the largest cost incurred in the production process is labor. For Carolina Yachts, their direct labor would include the wages paid to the carpenters, painters, electricians, and welders who build the boats. Like direct materials, direct labor is typically treated as a variable cost because it varies with the level of activity. However, there are some companies that pay a flat weekly or monthly salary for production workers, and for these employees, their compensation could be classified as a fixed cost. For example, many auto mechanics are now paid a flat weekly or monthly salary.
While in the example Carolina Yachts is dependent upon direct labor, the production process for companies in many industries is moving from human labor to a more automated production process. For these companies, direct labor in these industries is becoming less significant. For an example, you can research the current production process for the automobile industry.
The third major classification of product costs for a manufacturing business is overhead. Manufacturing overhead (sometimes referred to as factory overhead) includes all of the costs that a manufacturing business incurs, other than the variable costs of direct materials and direct labor required to build products. These overhead costs are not directly attributable to a specific unit of production, but they are incurred to support the production of goods. Some of the items included in manufacturing overhead include supervisor salaries, depreciation on the factory, maintenance, insurance, and utilities. It is important to note that manufacturing overhead does not include any of the selling or administrative functions of a business. For Carolina Yachts, costs like the sales, marketing, CEO, and clerical staff salaries will not be included in the calculation of manufacturing overhead costs but will instead be allocated to selling and administrative expenses.
As you have learned, much of the power of managerial accounting is its ability to break costs down into the smallest possible trackable unit. This also applies to manufacturing overhead. In many cases, businesses have a need to further refine their overhead costs and will track indirect labor and indirect materials.
When labor costs are incurred but are not directly involved in the active conversion of materials into finished products, they are classified as indirect labor costs. For example, Carolina Yachts has production supervisors who oversee the manufacturing process but do not actively participate in the construction of the boats. Their wages generally support the production process but cannot be traced back to a single unit. For this reason, the production supervisors’ salary would be classified as indirect labor. Similar to direct labor, on a product or department basis, indirect labor, such as the supervisor’s salary, is often treated as a fixed cost, assuming that it does not vary with the level of activity or number of units produced. However, if you are considering the supervisor’s salary cost on a per unit of production basis, then it could be considered a variable cost.
Similarly, not all materials used in the production process can be traced back to a specific unit of production. When this is the case, they are classified as indirect material costs. Although needed to produce the product, these indirect material costs are not traceable to a specific unit of production. For Carolina Yachts, their indirect materials include supplies like tools, glue, wax, and cleaning supplies. These materials are required to build a boat, but management cannot easily track how much of a bottle of glue they use or how often they use a particular drill to build a specific boat. These indirect materials and their associated cost represent a small fraction of the total materials needed to complete a unit of production. Like direct materials, indirect materials are classified as a variable cost since they vary with the level of production. Table 6.12 provides some examples of manufacturing costs and their classifications.
| Cost | Classification | Fixed or Variable |
|---|---|---|
| Production supervisor salary | Indirect labor | Fixed |
| Raw materials used in production | Direct materials | Variable |
| Wages of production employees | Direct labor | Variable |
| Straight-line depreciation on factory equipment | General manufacturing overhead | Fixed |
| Glue and adhesives | Indirect materials | Variable |
Prime Costs versus Conversion Costs
In certain production environments, once a business has separated the costs of the product into direct materials, direct labor, and overhead, the costs can then be gathered into two broader categories: prime costs and conversion costs. Prime costs are the direct material expenses and direct labor costs, while conversion costs are direct labor and general factory overhead combined. Please note that these two categories of costs are examples of cost categories where a particular cost can be included in both. In this case, direct labor is included in both prime costs and conversion costs.
These cost classifications are common in businesses that produce large quantities of an item that is then packaged into smaller, sellable quantities such as soft drinks or cereal. In these types of production environments, it easier to lump the costs of direct labor and overhead into one category, since these costs are what are needed to convert raw materials into a finished product.
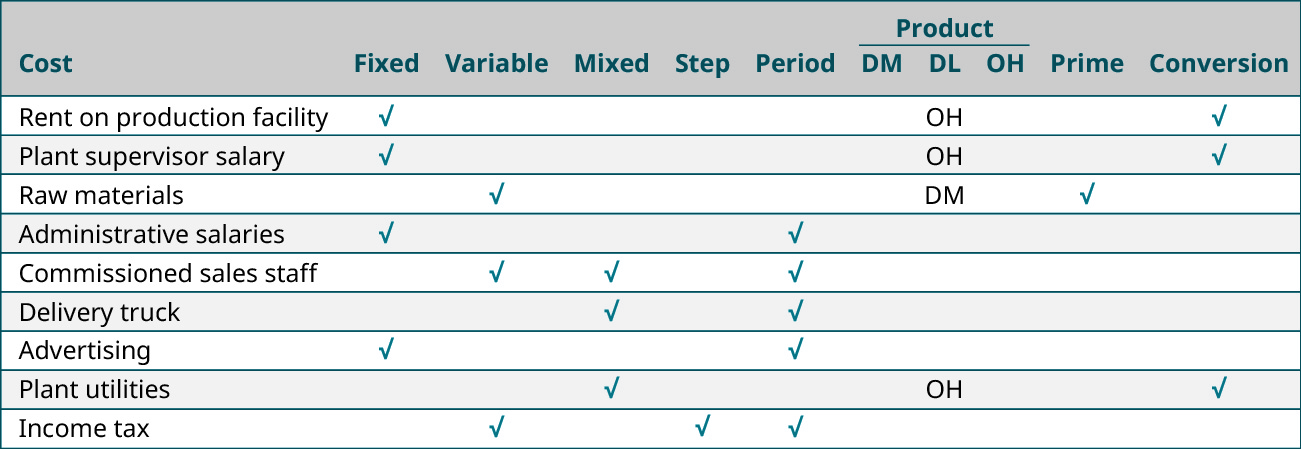
Although it seems as if there are many classifications or labels associated with costs, remember that the purpose of cost classification is to assist managers in the decision-making process. Since this type of data is not used for external reporting purposes, it is important to understand that (1) a single cost can have many different labels; (2) the terms are used independently, not simultaneously; and (3) each classification is important to understand in order to make business decisions. Figure 6.39 uses some example costs to demonstrate these principles.
Effects of Changes in Activity Level on Unit Costs and Total Costs
We have spent considerable time identifying and describing the various ways that businesses categorize costs. However, categorization itself is not enough. It is important not only to understand the categorization of costs but to understand the relationships between changes in activity levels and the changes in costs in total. It is worth repeating that when a cost is considered to be fixed, that cost is only fixed for the relevant range. Once the boundary of the relevant range has been reached or moved beyond, fixed costs will change and then remain fixed for the new relevant range. Remember that, within a relevant range of activity, where the relevant range refers to a specific activity level that is bounded by a minimum and maximum amount, total fixed costs are constant, but costs change on a per-unit basis. Let’s examine an example that demonstrates how changes in activity can affect costs.
YOUR TURN
Spring Break Trip Planning
Margo is planning an 8-day spring break trip from Atlanta, Georgia, to Tampa, Florida, leaving on Sunday and returning the following Sunday. She has located a condominium on the beach and has put a deposit down on the unit. The rental company has a maximum occupancy for the condominium of seven adults. There is an amusement park that she plans to visit. She is going to use her parents’ car, an SUV that can carry up to six people and their luggage. The SUV can travel an average of 20 miles per gallon, the total distance is approximately 1,250 miles (550 miles each way plus driving around Tampa every day), and the average price of gas is $3 per gallon. A season pass for an amusement park she wants to visit is $168 per person. Margo estimates spending $40 per day per person for food. She estimates the costs for the trip as follows:

Now that she has cost estimates, she is trying to decide how many of her friends she wants to invite. Since the car can only seat six people, Marg made a list of five other girls to invite. Use her data to answer the following questions and fill out the cost table:
- What are the total variable costs for the trip?
- What are the average variable costs for the trip?
- What are the total fixed costs for the trip?
- What are the average fixed costs for the trip?
- What are the average costs per person for the trip?
- What would the trip cost Margo if she were to go alone?

Figure 6.41 By: Rice University Source: Openstax CC BY-NC-SA 4.0 - What additional costs would be incurred if a seventh girl was invited on the trip? Would this be a wise decision (from a cost perspective)? Why or why not?
- Which cost will not be affected if a seventh girl was invited on the trip?
Solution

Answers will vary. All responses should recognize that there is no room in the car for the seventh girl and her luggage, although the condominium will accommodate the extra person. This means they will have to either find a larger vehicle and incur higher gas expenses or take a second car, which will at least double the fixed gas cost.
Long Descriptions
A graph shows the mixed costs for Ocean Breeze. The x-axis lists the number of rooms, ranging from 0 to 100. The y-axis lists this mixed occupancy tax, ranging from $0 to $3,500. Fixed costs points are marked at the points of 0 rooms and $2,000, 60 rooms and $2,000, 85 rooms and $2,000, and 100 rooms and $2,000. Variable costs are marked at the points of 0 rooms and $2,000, 60 rooms and $2,300, 85 rooms and $2,425, and 100 rooms and $2,500. The section of the graph that includes both fixed and variable costs is labeled as total mixed costs. Return
Graph with Total cost as the y axis (0 to $14,000) and number of T-Shirts as the x axis (500 to 4,000.) The line hits the y axis at just above $6,375 for 500 shirts, heads in a straight line to slightly up and to the right until it gets to 2,000 shirts at $7,500. Then the line takes a sharp turn up to 2,250 shirts at $10,813, then levels off in a straight line slightly up and to the right to 3,750 shirts at $12,688. Return
Chart showing classification of different costs: Rent on production facility is fixed, product, overhead, conversion; Plant supervisor salary is fixed, product, overhead conversion; Raw materials are variable, product, direct materials, prime; Administrative salaries are fixed, period. Commissioned sales staff are variable, period; Delivery truck is mixed, period; Advertising is fixed, period; Plant utilities are mixed, product, overhead, conversion; Income tax is variable, step, period. Return
Chart showing classification of different costs: Rent on production facility is fixed, product, overhead, conversion; Plant supervisor salary is fixed, product, overhead conversion; Raw materials are variable, product, direct materials, prime; Administrative salaries are fixed, period. Commissioned sales staff are variable, period; Delivery truck is mixed, period; Advertising is fixed, period; Plant utilities are mixed, product, overhead, conversion; Income tax is variable, step, period. Return
Footnotes
9 "Attribution: Modification of work by Sharon Kioko and Justin Marlowe. “Cost Analysis.” Financial Strategy for Public Managers. CC BY 4.0. https://press.rebus.community/financialstrategy/chapter/cost-analysis/

