8.4 Tracing the Flow of Costs in Job Order
Job order costing can be used for many different industries, and each industry maintains records for one or more inventory accounts. The manufacturing industry keeps track of the costs of each inventory account as the product is moved from raw materials inventory into work in process, through work in process, and into the finished goods inventory.
Conversely, typical companies in the merchandising industry sell products they do not manufacture and purchase their inventory in an already completed state. It is relatively easy to keep track of the inventory cost for a merchandising company through its application of first-in/first-out (FIFO), last-in/last-out (LIFO), weighted average, or specific identification inventory techniques on the unsold items. The primary difference in the four methods is the valuation of the cost of goods sold and the remaining ending inventory valuation, assuming that the company did not sell 100% of the inventory that they had available for sale during a given period. Companies are allowed to choose the method that they feel best represents their cost flows through their cost of goods sold and their ending inventory balances.
Not all service companies have inventory, and those companies do not have direct materials nor do they consider their work in process their inventory, since their final product is often an intangible asset, such as a legal document or tax return. Regardless of whether the service has inventory accounts, service companies all keep track of the direct labor and overhead costs incurred while completing each job in progress.
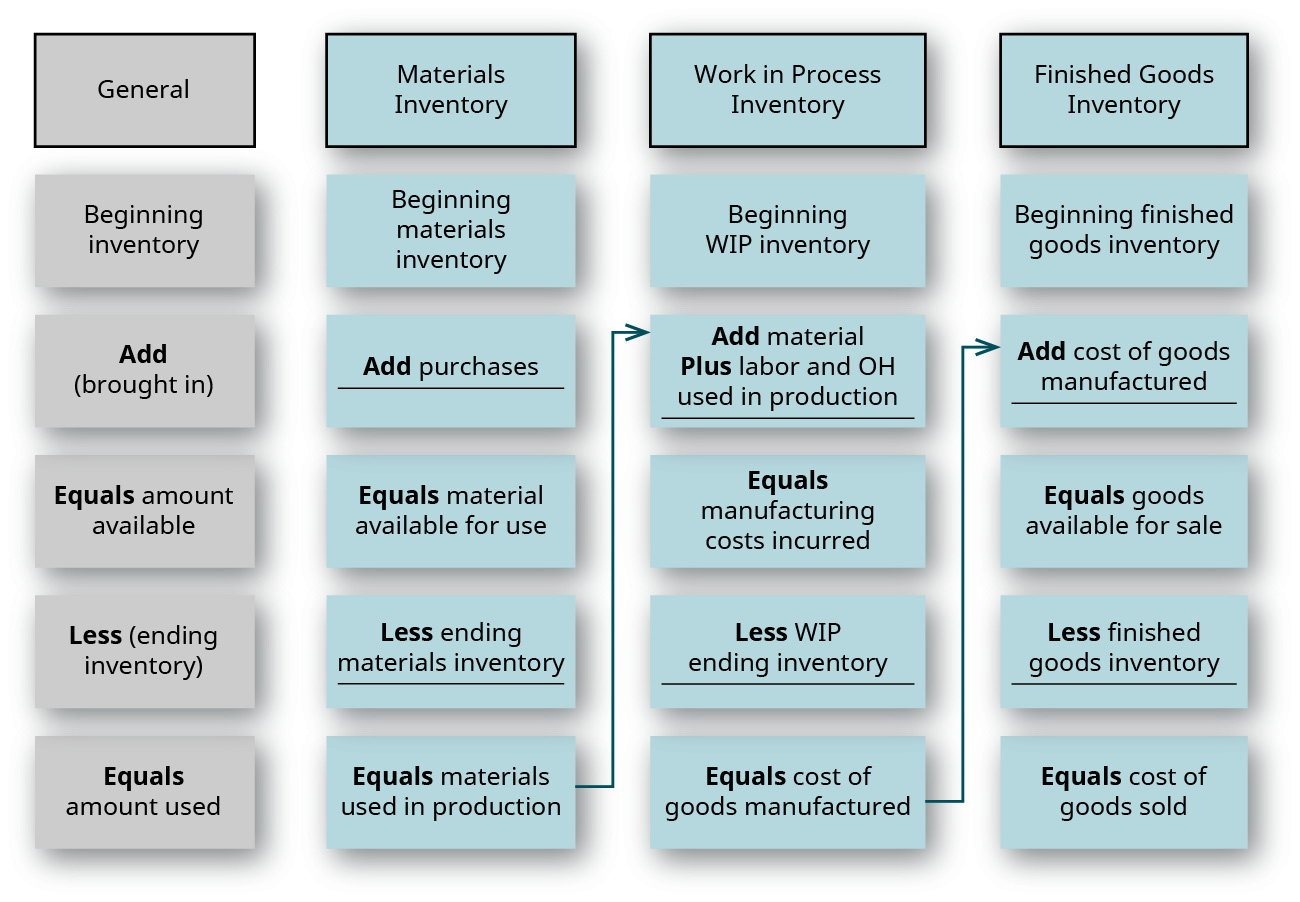
Inventory is an asset reported on the balance sheet, and each company needs to maintain accurate records for the cost of each type of inventory: raw materials inventory, work in process inventory, and finished goods inventory. All three costs are computed in a similar manner. You can see in Figure 8.28 that the general format is the same for maintaining all accounts, whether the company uses a job order, process, or hybrid cost system.

Each inventory account starts with a beginning balance at the start of an accounting period. During the period, if additional inventory is purchased, the new inventory amount is added to the beginning balance to calculate the total inventory available for use or sale. The ending inventory balance at the end of the accounting period can then be subtracted from the inventory available for use, and the total represents the cost of the inventory used during the period.
For example, if the beginning inventory balance were $400, and the company bought an additional $1,000, it would have $1,400 of inventory available for use. If the ending inventory balance were $500, the amount of inventory used during the period would be $900 ($400 + $1,000 = $1,400 – $500 = $900).
Raw Materials Inventory
Raw materials inventory is the total cost of materials that will be used in the production process. Usually, several accounts make up the raw materials inventory, and these can be actual accounts or accounts subsidiary to the general raw materials inventory account. In our example, Dinosaur Vinyl has several raw materials accounts: vinyl, red ink, black ink, gold ink, grommets, and wood.
Within the raw materials inventory account, purchases increase the inventory, whereas raw materials sent into production reduce it. It is easy to reconcile the amount of ending inventory and the cost of direct materials used in production, since the materials requisition form (Figure 8.29) keeps track of the inventory requested and sent into each specific job. Since the costs are transferred with production, the calculation shows the amount of materials used in production:

Work in Process Inventory
In a job order cost system, the balance in the work in process inventory account is continually updated as job costs are recorded and is the total of all unfinished jobs, as shown on the individual job cost sheets.
The production cycle is a continuous cycle that begins with raw materials being transferred to work in process, moving through production, and ending as finished goods inventory. Typically, as goods are being produced, additional jobs are being started and finished, and the work in process inventory includes unit costs of jobs still in production at the end of the accounting period. At the end of the accounting cycle, there will be jobs that remain unfinished in the production cycle, and these represent the work in process inventory. The costs on the job order cost sheet help reconcile the cost of the items transferred to the finished goods inventory and the cost of the work in process inventory.
For example, Dinosaur Vinyl has completed Job MAC001. The total cost of $931 is transferred to the finished goods inventory:

At this point, we need to examine an important component of the costing process. The cost of goods manufactured (COGM) is the costs of all of the units that a company completed and transferred to the finished goods inventory during an accounting period. Obviously, the cost of goods manufactured is not just a single number that can be pulled from one location. We have to look at all costs included in the manufacturing process to determine the cost of goods manufactured. The calculation begins with the beginning balance in the work in process inventory, incorporates the new production costs incurred during the current period (typically a year), and then subtracts the ending balance in the work in process inventory since these costs will be included in the subsequent accounting period’s cost of goods manufactured, as shown:

Finished Goods Inventory
After each job has been completed and overhead has been applied, the product is transferred to the finished goods inventory where it stays until it is sold. As each job is transferred, the costs are summarized and transferred as well, and the job cost sheet is completed to show the actual production cost of the product and the sales price of the items produced.
A job order cost system continually updates each job cost sheet as materials, labor, and overhead are added. As a result, all inventory accounts are constantly maintained. The materials inventory balance is continually updated, as materials are purchased and requisitioned for individual jobs. The work in process inventory and finished goods inventory are master accounts, and their balances are determined by adding the total of the job cost sheets. The total of the incomplete jobs becomes the total work in process inventory, and the total of the completed and unsold jobs becomes the total of the finished goods inventory.
Similar to the raw materials and work in process inventories, the cost of goods sold can be calculated as shown:

Cost of Goods Sold
The cost of goods sold is the manufacturing cost of the items sold during the period. It is calculated by adding the beginning finished goods inventory and the cost of goods manufactured to arrive at the cost of goods available for sale. The cost of goods available for sale less the ending inventory results in the cost of goods sold.
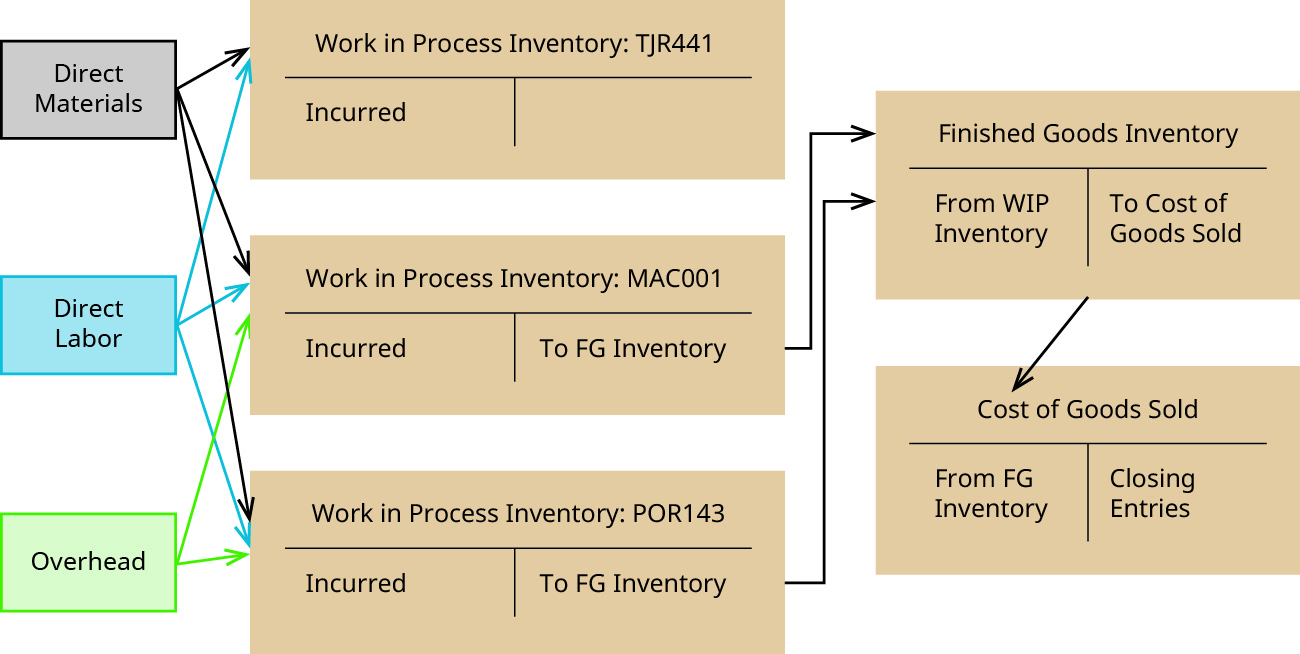
In our example, when the sale has occurred, the goods are transferred to the buyer, and the product is transferred from the finished goods inventory to the cost of goods sold. A corresponding entry is also made to record the sale. Dinosaur Vinyl’s sales price for Job MAC001 was $2,000, and its cost of goods sold was $931:

Figure 8.34 shows the flow to cost of goods sold.

YOUR TURN
Tracking the Flow with Selected T-Accounts
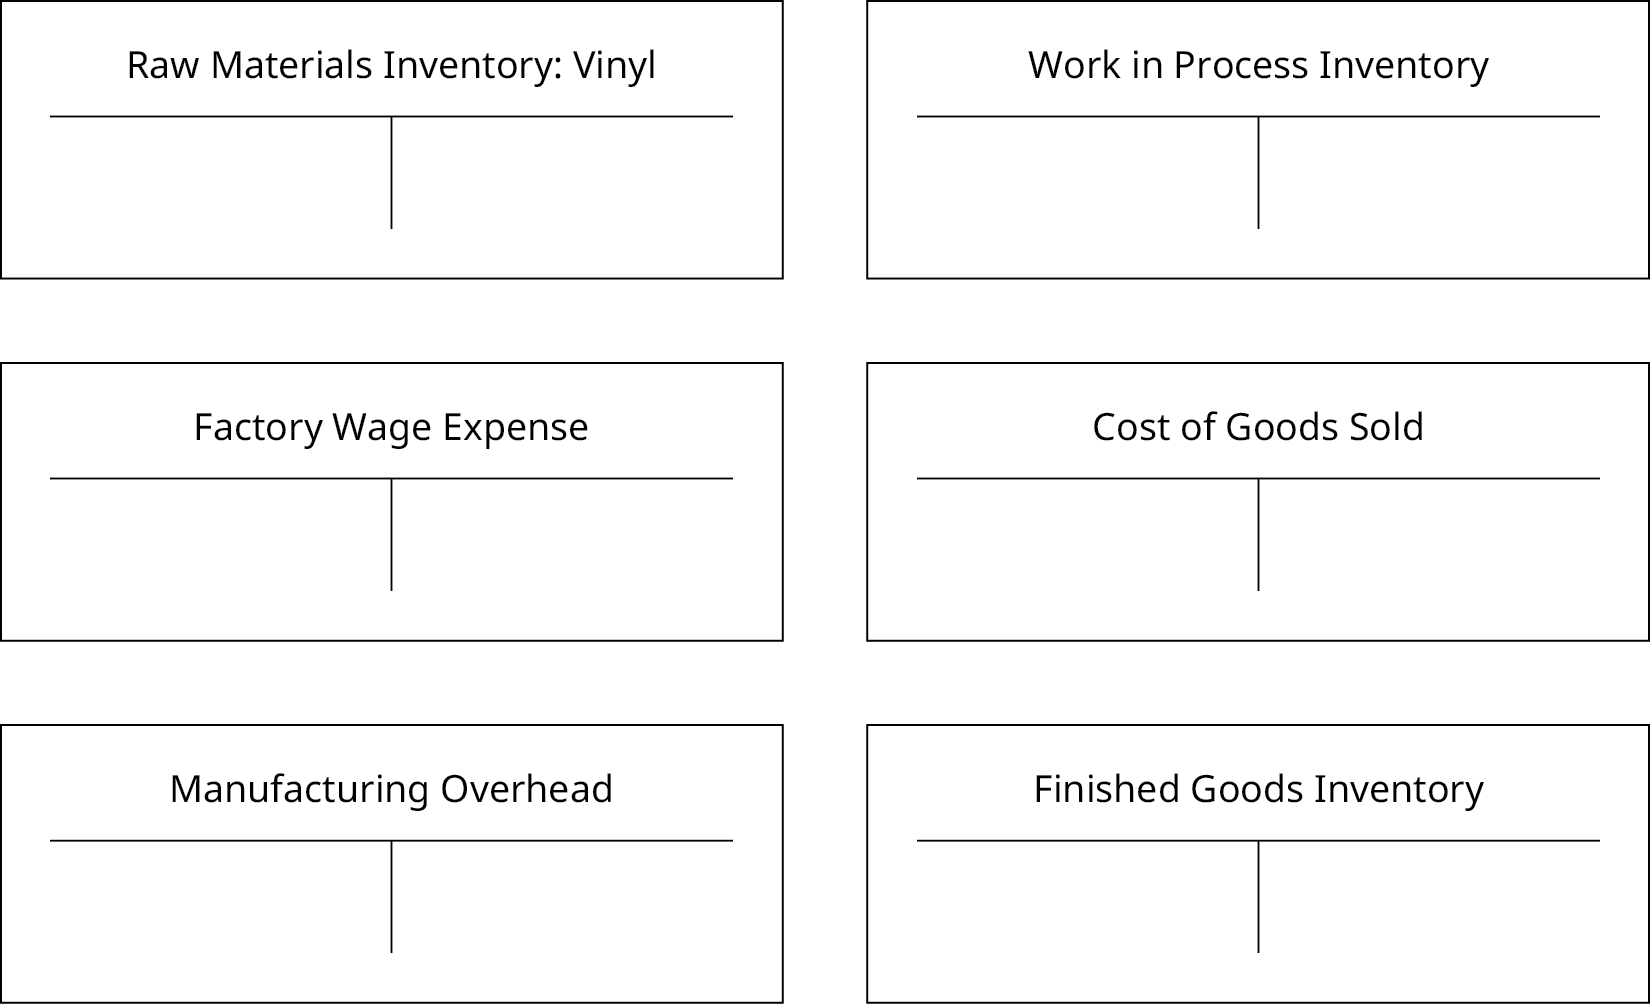
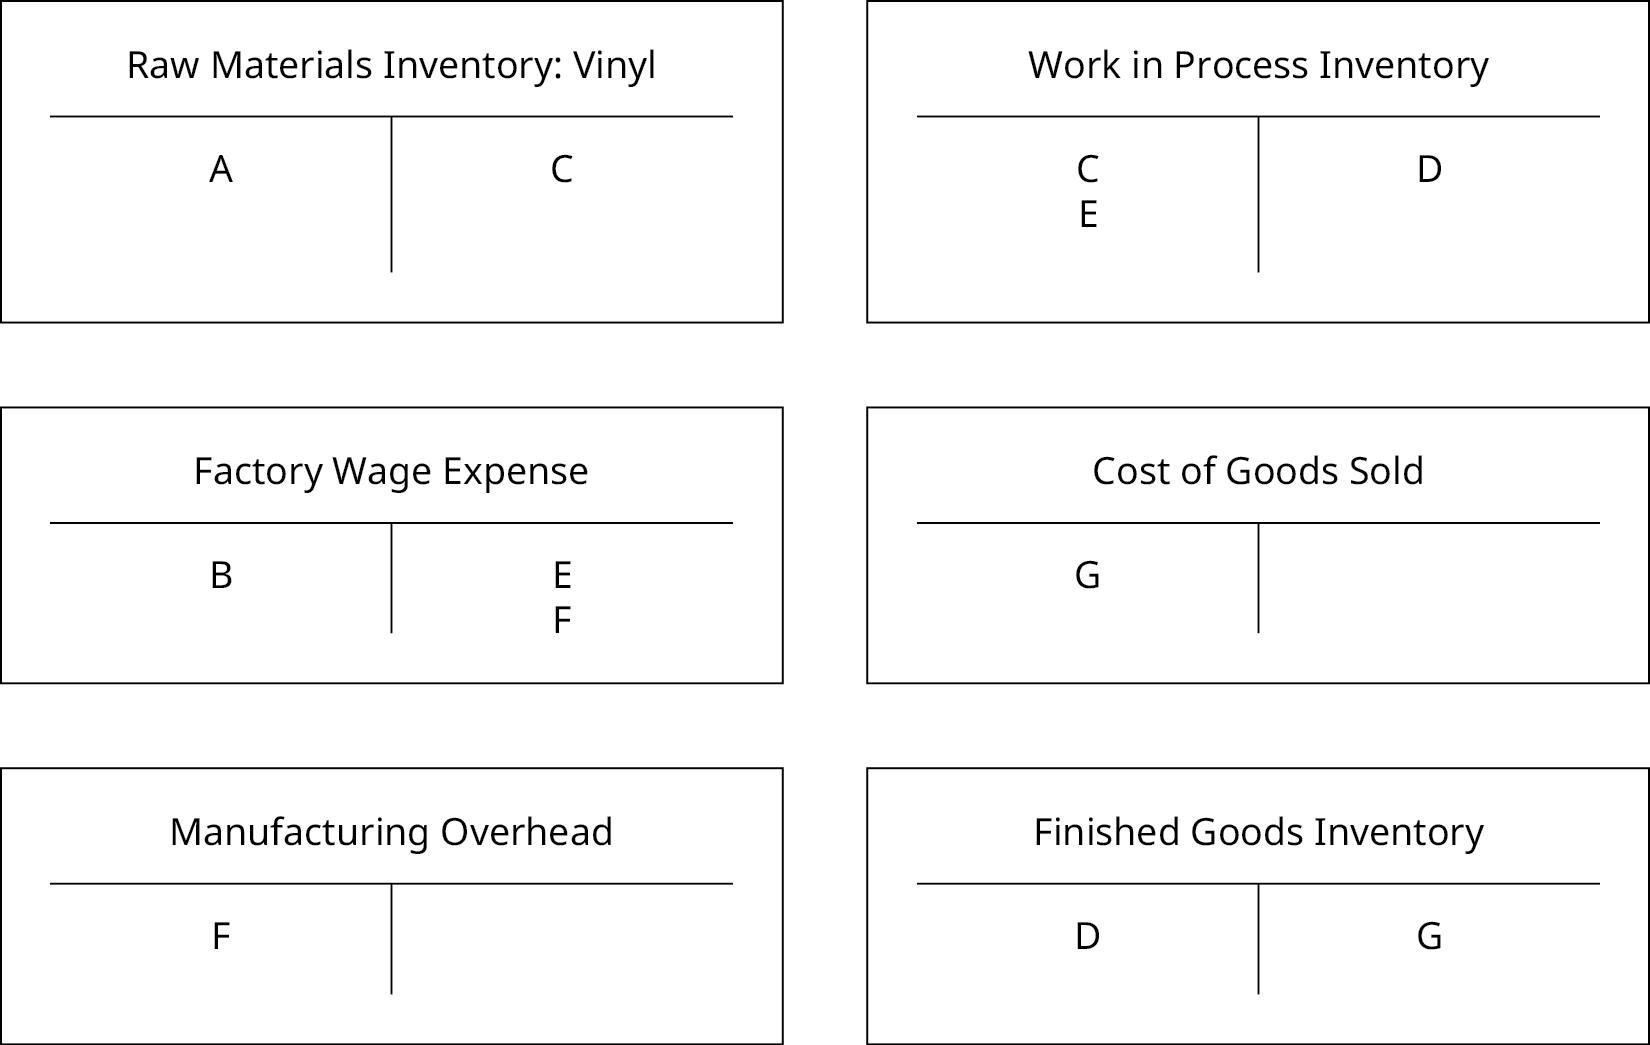
Use the transaction letters to show the flow in and out of the T-accounts. Note: some items may be used more than once. Also, not every possible T-account entry is required in this exercise. For example, for the purchase of raw materials, the credit entry for either cash or accounts payable is not required.

- Purchase raw materials inventory
- Factory wage expense incurred
- Issue raw materials inventory to Job P33
- Factory wage allocated to Job P33
- Factory wage allocated to overhead
- Job P33 completed
- Job P33 sold
Solution

Long Descriptions
A figure of four columns showing the similarity of the calculation of each level of inventory as it moves to the next level. The far left column is the general calculation: Beginning Inventory plus what is brought in equals what is available. Then subtract the ending inventory (what is left) to get the amount used. The next column is this same calculation for Materials inventory: Beginning Raw Materials Inventory plus purchases equals material available for use. Then subtract Ending Raw Materials Inventory to get Materials used in production. There is an arrow from this result pointing to the amount that is added to the Work in Process Inventory, which is the next column’s calculation: Beginning WIP Inventory plus material (from the arrow), labor, and overhead used in production equals Manufacturing Costs Incurred. Then subtract the ending WIP Inventory to get the Cost of goods Manufactured. There is an arrow pointing from this result to the amount that is added to the Finished Goods Inventory, which is calculated in the next column: Beginning Finished Goods Inventory plus Cost of Goods Manufactured (from the arrow) equals Goods Available for Sale. Then subtract Ending Finished Goods Inventory to get Cost of Goods Sold. Return
This figure calculates Cost of goods manufactured during the period (completed): Beginning Work in Process Inventory plus the current manufacturing costs (Direct Materials used in production, Direct Labor, and Overhead) equals Manufacturing costs incurred. Then subtract the ending Work in Process inventory to get Cost of Goods Manufactured. Return
A figure showing the flow of costs. There are three small boxes on the left indicating “Direct Materials”, “Direct Labor” and “Overhead.” There are arrows from each of these boxes to the debit side of each of the T-Accounts showing in the middle column: “Work in Process Inventory: TJR441”, “Work in Process Inventory: MAC001” and “Work in Process Inventory: POR143” – with the exception of overhead to TR441 (which has not yet been finished.) The debit side of each of these T-accounts say “Incurred” in them. The credit side of the T-accounts for MAC001 and POR143 say “To Finished Goods Inventory” and there are arrows pointing from each to the debit side of a T-Account for “Finished Goods Inventory,” which says “From WIP Inventory.” The credit side of the Finished Goods Inventory T-Account says “To Cost of Goods Sold” and there is an arrow pointing from that to the debit side of a T-Account Labeled “Cost of Goods Sold”. This T-Account has the words “From Finished Goods Inventory” on the debit side and “Closing Entries” on the credit side. Return
The six T-Accounts: one each for “Raw Materials Inventory: Vinyl”, “Factory Wage Expense”, “Manufacturing Overhead”, “Work in Process Inventory”, “Cost of Goods Sold”, and “Finished Goods Inventory” are now filled out. “Raw Materials Inventory: Vinyl” has an A on the debit side and a C on the credit side, “Factory Wage Expense” has a B on the debit side, and an E and F on the credit side, “Manufacturing Overhead” has an F on the debit side, “Work in Process Inventory” has a C and E on the debit side and a D on the credit side, “Cost of Goods Sold” has a G on the debit side, and “Finished Goods Inventory” has a D on the debit and G on the credit side. Return

