
Chapter 3: Basic Emotion Theory and Social Constructivist Theory
Physiological Patterns
Physiological changes can include changes in the sympathetic nervous system (SNS) and/or parasympathetic nervous system (PNS). In this component, we will also include changes in the brain, such as frontal lobe activation and brain structure activity.
Basic emotions researchers would hypothesize that for the same emotion, people should experience the same changes in physiology. Because we have so many ways to measure physiological changes, basic emotions researchers look for physiological patterns for each emotion. They expect that for each emotion, we should see a different pattern of physiological changes. The basic emotions view that each emotion should correspond to a different physiological pattern is called the autonomic specificity hypothesis (Ekman, 1992; Levenson, 1992).
Research has utilized the Directed Facial Action Task (for more information, see Ekman (2007)) to identify physiological patterns associated with distinct emotions. In this task, participants contract their facial muscles according to experimenter instructions. Three common methods are used to provide instructions:
- A researcher tells participants to show a certain expression on their face. So, “please smile” or “please frown” or “please put your bottom lip down.”
- A research assistant might arrange the participants facial muscles with their hands
- Participants are instructed to hold a pen with their mouth open (to elicit the emotion joy with by smiling) or with their mouth closed (to elicit the emotion sadness by frowning).
This methodology is based on the facial feedback hypothesis, first proposed by Charles Darwin and then William James! This hypothesis states that the emotions we show on our face cause the emotion we feel. For example, if we are in a neutral state, and then we show a frown on our face, that frown will actually make us feel sadness! So, the Directed Facial Action Task assumes that rearranging facial muscles causes participants to feel the discrete emotion shown on the face.
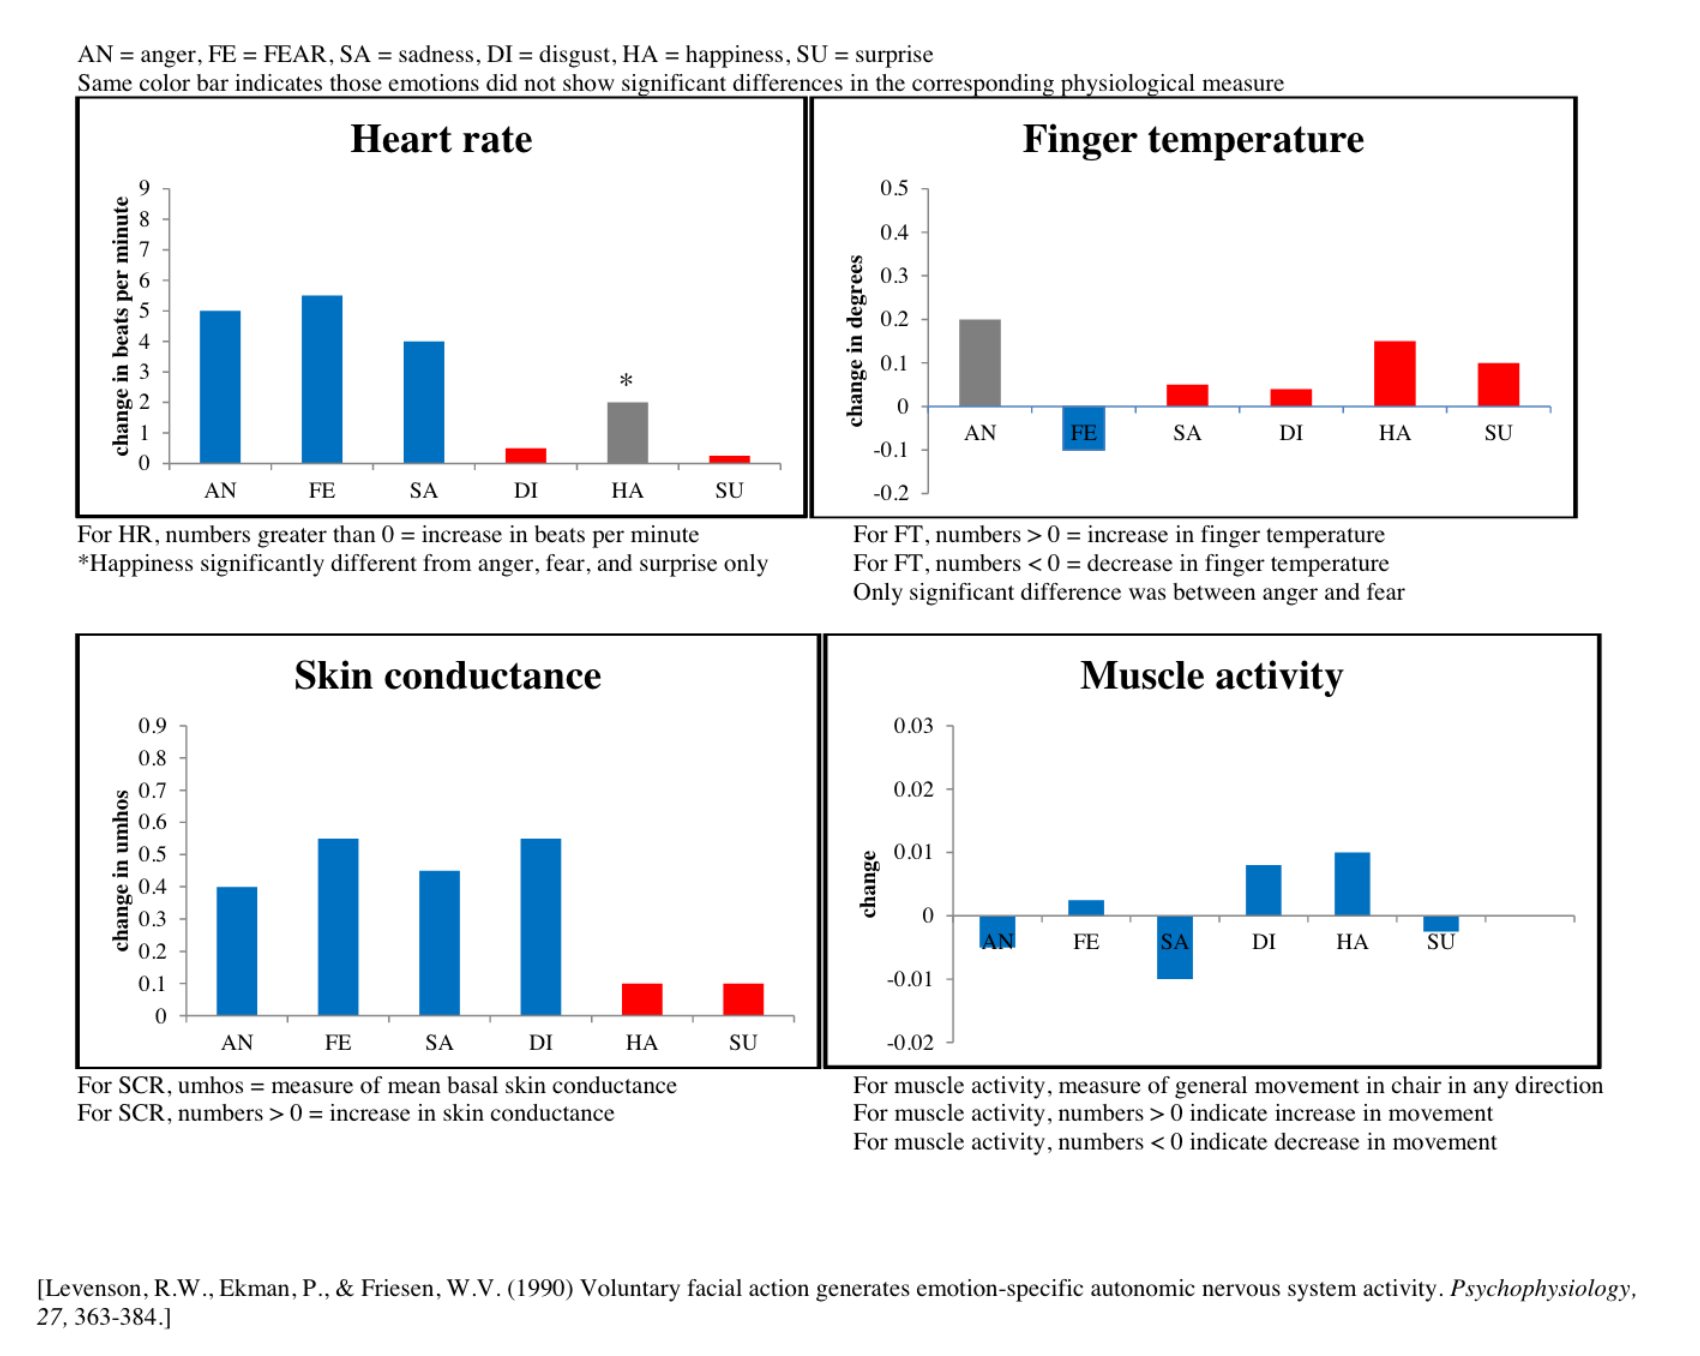
A classic study (Levenson, Ekman, & Friesen, 1990) used the directed facial action task to test the autonomic specificity hypothesis. In this study, participants displayed six different facial expressions: anger, fear, sadness, disgust, happiness, and surprise. After displaying each facial expression, four physiological measures were taken: heart rate, finger temperature, skin conductance, and muscle activity. According to the autonomic specificity hypothesis, each of the six facial expressions should cause a unique pattern of physiological changes.
The figure below demonstrates the results. The x-axis shows the six facial expressions, and the y-axis represents the change in physiology from baseline. Bars of the same color indicates that those emotions did not show significant differences in the corresponding physiological measures. For instance, for heart rate – anger, fear, and sadness resulted in the same increase in heart rate. Bars with different colors represent significant differences between the emotions. For instance, for heart rate – happiness showed a significantly difference change in heart rate from all other emotions except for sadness (as noted).
Figure 15
Physiological Change from Baseline for Six Discrete Emotions
Long Description
The image consists of four bar graphs depicting different physiological measures in response to six emotions: anger (AN), fear (FE), sadness (SA), disgust (DI), happiness (HA), and surprise (SU). The graphs are labeled “Heart rate,” “Finger temperature,” “Skin conductance,” and “Muscle activity.”
- Heart rate: This graph shows an increase in beats per minute for anger, fear, and sadness, represented by tall blue bars, with shorter bars for disgust, happiness, and surprise. A star symbol above the happiness bar indicates a significant difference from anger, fear, and surprise.
- Finger temperature: This graph indicates changes in temperature. The anger bar is in gray showing an increase, and fear is in blue showing a decrease. Other emotions show minimal changes. A note states the only significant difference is between anger and fear.
- Skin conductance: This graph shows changes in umhos, with blue bars for anger, fear, and sadness indicating higher conductance. Disgust also shows a moderate increase, while happiness and surprise are minimal.
- Muscle activity: This graph shows changes indicating general movement. Blue bars indicate changes for each emotion, with a slight increase or decrease, not specified for any particular color.
Each graph includes notes explaining the measurements and significance.
Transcribed Text:
AN = anger, FE = FEAR, SA = sadness, DI = disgust, HA = happiness, SU = surprise
Same color bar indicates those emotions did not show significant differences in the corresponding physiological measure
Heart rate
change in beats per minute
For HR, numbers greater than 0 = increase in beats per minute
*Happiness significantly different from anger, fear, and surprise only
Finger temperature
change in degrees
For FT, numbers > 0 = increase in finger temperature
For FT, numbers < 0 = decrease in finger temperature Only significant difference was between anger and fear Skin conductance change in umhos For SCR, umhos = measure of mean basal skin conductance For SCR, numbers > 0 = increase in skin conductance
Muscle activity
change
For muscle activity, measure of general movement in chair in any direction
For muscle activity, numbers > 0 indicate increase in movement
For muscle activity, numbers < 0 indicate decrease in movement
Physiological Patterns for Each Emotion based on Levenson et al. (1990)
- Anger: ↑HR, ↑Finger Temp, ↑Skin conductance, ↓Muscle Activity
- Fear: ↑HR, ↓Finger Temp, ↑Skin conductance, ↑Muscle Activity
- Sadness: ↑HR, ↑Finger Temp, ↑Skin conductance, ↓Muscle Activity
- Disgust: ↑HR, ↑Finger Temp, ↑Skin conductance, ↑Muscle Activity
- Happiness: ↑HR, ↑Finger Temp, ↑Skin conductance, ↑Muscle Activity
- Surprise: 0 HR, ↑Finger Temp, ↑Skin conductance, ↓Muscle Activity
Some other findings to note:
- The six emotions did not show differences in muscle activity.
- Heart rate and finger temperature demonstrated the most differences between emotions.
- Many of the physiological measures are better at distinguishing among negative emotions than positive emotions.
Finally, keep in mind that Schachter and Singer would state that physiological change only determines our arousal, whereas our cognitive appraisals determine our emotion label.
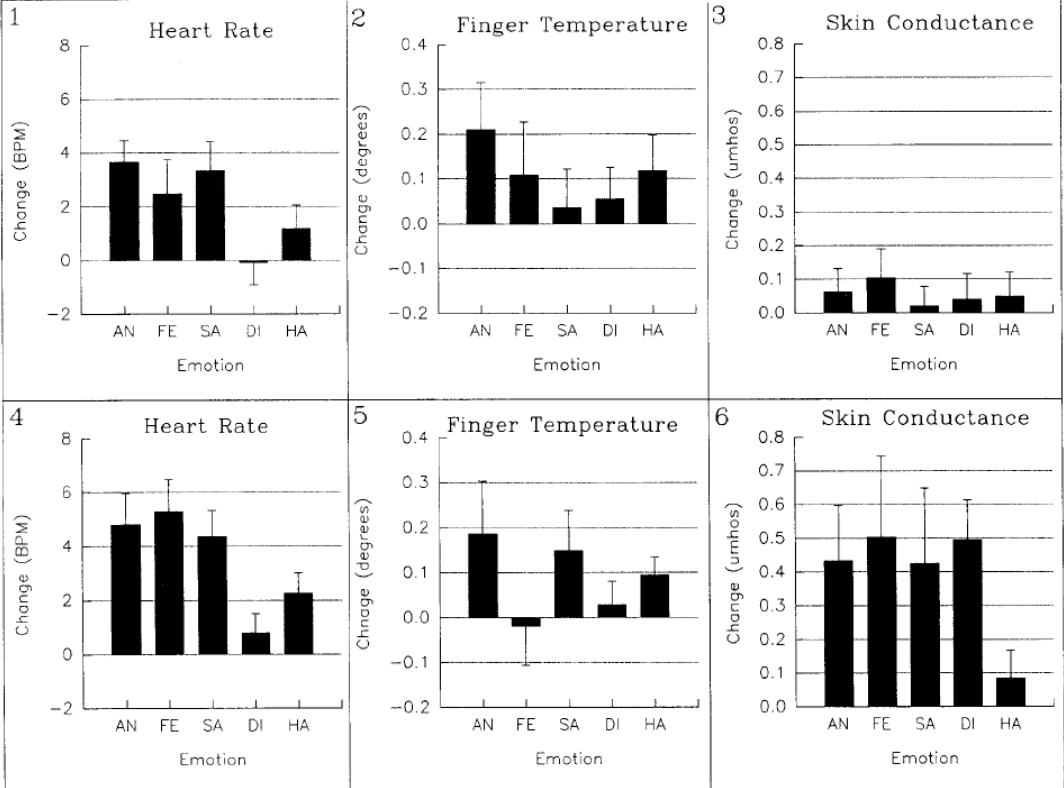
A later study (Levenson, Ekman, Heider, & Friesen, 1992) looked for universality in physiological patterns by recruiting Minangkabau and American participants. Minangkabau is a local tribe located in the Indonesia province of West Sumatera (called Sumatera Beret by locals). Similar to the prior study, participants were instructed to make facial expressions associated with the following distinct emotions: anger, fear, sadness, disgust, and happiness/joy. While holding the facial expression, seven measures of physiology were taken – we will only discuss heart rate, finger temperature, and skin conductance. Results are displayed below. The top row displays the results for Minangkabau participants, while the bottom row displays results for American participants.
Figure 16
Physiological Change from Baseline for Five Discrete Emotions in US and Minangkabau Participants
Long Description
The image contains six bar charts arranged in two rows and three columns. Each chart displays physiological changes associated with different emotions: AN (Anger), FE (Fear), SA (Sadness), DI (Disgust), and HA (Happiness).
The first chart illustrates changes in Heart Rate (BPM) for each emotion. The y-axis ranges from -2 to 8 BPM. Notable increases are shown for Anger and Fear.
The second chart represents changes in Finger Temperature, with the y-axis ranging from -0.2 to 0.4 degrees. Anger shows the highest increase, followed by Fear.
The third chart shows changes in Skin Conductance with the y-axis ranging from 0.0 to 0.8 umhos. Minimal increases are observed for all emotions.
The fourth chart replicates the Heart Rate data, possibly showing another condition or group.
The fifth chart replicates the Finger Temperature data, indicating another set of measurements.
The sixth chart replicates the Skin Conductance data, highlighting larger increases, particularly for Anger and Fear.
Transcribed Text:
Heart Rate Change (BPM) Emotion AN FE SA DI HA
Finger Temperature Change (degrees) Emotion AN FE SA DI HA
Skin Conductance Change (umhos) Emotion AN FE SA DI HA
Heart Rate Change (BPM) Emotion AN FE SA DI HA
Finger Temperature Change (degrees) Emotion AN FE SA DI HA
Skin Conductance Change (umhos) Emotion AN FE SA DI HA
In general, Levenson et al. (1992) concluded that changes in the seven physiological measures were universal for the five emotions. Two additional findings should be highlighted:
- Cross-cultural differences were greatest for skin conductance. Compared to Minangkabau participants, American participants experienced a larger increase in skin conductance from baseline for anger, fear, sadness, and disgust. In fact, the Minangkabau didn’t really show a change in skin conductance for any of the emotions.
- Findings also showed that the differences in heart rate across the emotions approached significance, with the American participants showing greater increases in heart rate.
In conclusion, this study provides evidence of both universality and cross-cultural differences in physiological changes. Why do we see these cross-cultural differences? Well, one explanation might be that Minangkabau truly experience smaller changes in physiology during an emotion episode. A second methodological reason might be that the facial feedback methodology is less effective for Minangkabau participants – maybe this method didn’t elicit the emotions. Or maybe the Minangkabau don’t express emotions as intensely on their faces as Americans do.
