
Chapter 8: Fear, Anxiety, and Stress
S.M. Case Study: Impairment in Recognition
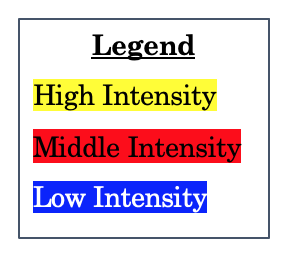
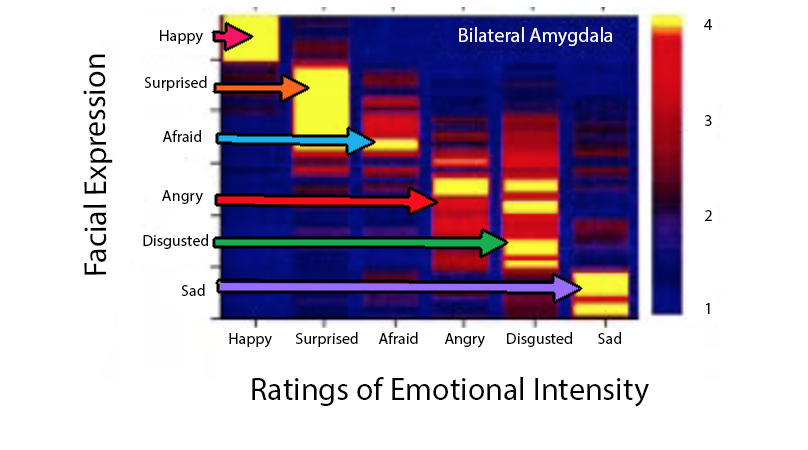
In the first set of tasks, participants were presented with photos of human emotional facial expressions (similar to Ekman’s judgment methodology; Adolphs, Tranel, et al., 1999). Specifically, participants were shown six male and female faces of anger, fear, happiness, surprise, sadness, disgust, and also three neutral faces. While viewing each photo, participants indicated on a scale of 0 to 5 (0 = not at all; 5 = very much) the intensity of six emotions shown on the face: happy, sadness, disgusted, angry, afraid, and surprised. During each trial, participants were asked to rate the intensity of one of the six emotion labels for a group of facial expressions. Figure 11 below displays the findings for three groups of participants. The bilateral amygdala damage group included 9 participants, one of whom was S.M. As indicated in the legend, yellow colors indicate participants selected high intensity (around a 4/5) for the emotion in the face, red indicates moderate intensity (around a 3) and blue indicates low intensity (around a 1/2). To interpret each figure, you should compare the facial expression displayed to participants in the y-axis to the emotional intensity rating (1-5 scale) as reported by the participants. Some findings are described under the figure.
Figure 11
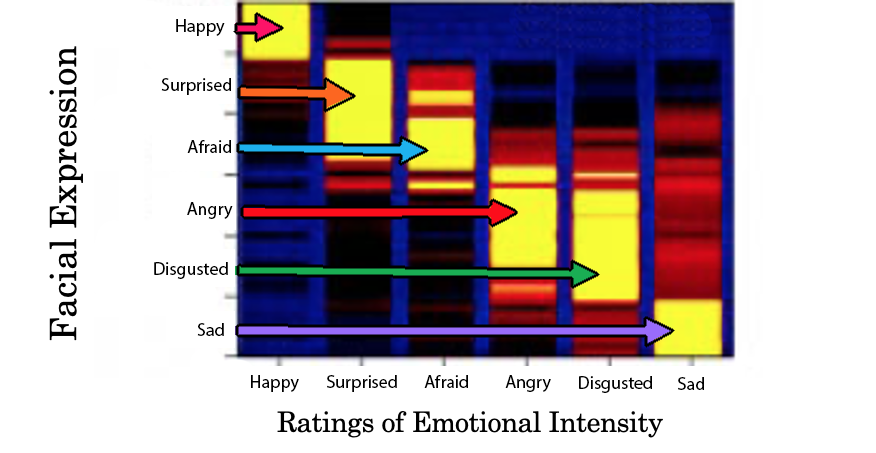
Reproduced from “Recognition of facial emotion in nine individuals with bilateral amygdala damage,” R. Adolphs, D. Tranel, S. Hamann, A.W. Young, A.J. Calder, E.A. Phelps, A. Anderson, G.P. Lee, and A.R. Damasio, 1999 Neuropsychologia, 37, p. 1113, (https://doi.org/10.1016/50028-3932(99)00039-1). Copyright 1999 by Elsevier Science Ltd.
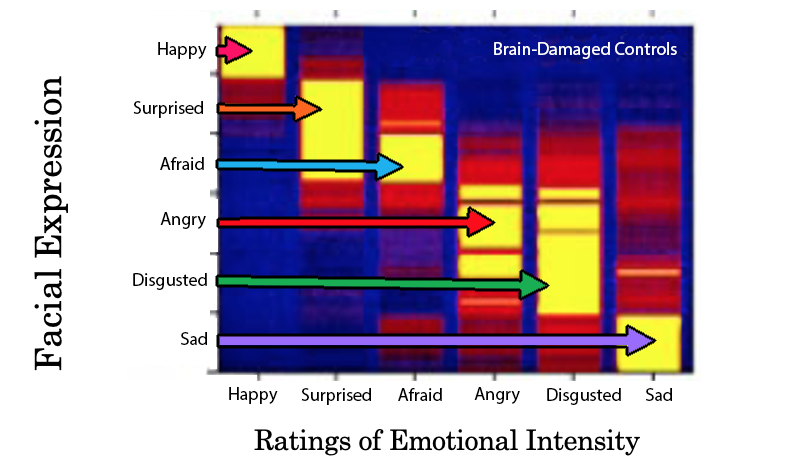
Based on Figure 11, the following conclusions can be made:
- Normal controls and brain-damaged controls showed similar performance. When shown an emotional facial expression, these participants reported the corresponding emotion to be most intense. For instance, when participants saw a disgusted face, they rated the face as intensely disgusting. This demonstrates that control participants were able to identify and recognize the emotional experience in others’ faces.
- When comparing bilateral amygdalae damage patients to the control groups, some of the emotion expressions do not show a corresponding highly intense emotion label. In particular, this is found for faces of fear, anger, and disgust. These findings suggest that impairment to the amygdala may hinder one’s ability to identify how much anger, fear, and disgust a person is showing, but this impairment does not exist for surprise, happy, and sad faces.
- These figures also show that control participants show overlap in their ratings of certain emotion labels for the same face. For example, when controls viewed an angry face, they reported high intensity for the emotions anger and disgust. This overlap is not as intense for bilateral damaged patients.
These initial findings show that amygdala damage does indeed impair recognition of fear in others. But this also shows that amygdala does control the identification of other emotions.
A follow-up study (Spezio et al., 2007) investigated the location of S.M.’s visual gaze when interpreting others’ facial expressions. Before discussing this study, it is important to note that people determine whether someone is experiencing fear mostly from their eyes. Even when someone is smiling, but their eyes are fearful – people interpret the facial expression as fear. In this study, S.M. and several healthy female controls engaged in a face-to-face or live video interaction with a professional actor who maintained a neutral facial expression. During the interaction, the participants wore an eye tracker. Findings (see Figure 12) showed that compared to controls, S.M. spent less time fixated on the actor’s eyes and more time staring at the actor’s mouth. This might suggest when the amygdala is damaged people identify the wrong facial expression because they are looking at the wrong part of the face. These finding have been replicated with still photos as well, but in the still photos S.M. focused more on the center of the face (Adolphs et al., 2005). Finally, although amygdala-damaged patients experience difficulty identifying emotions in facial expressions, their ability to identify an individual from their face is not hindered (Adolphs et al., 1994; 1995). Thus, if S.M. runs into her friend Wang, S.M. would think “This is my friend, Wang,” but she might have trouble interpreting Wang’s facial expressions.
Figure 12
Eye-tracking study comparing S.M. to healthy controls (Spezio et al., 2007)
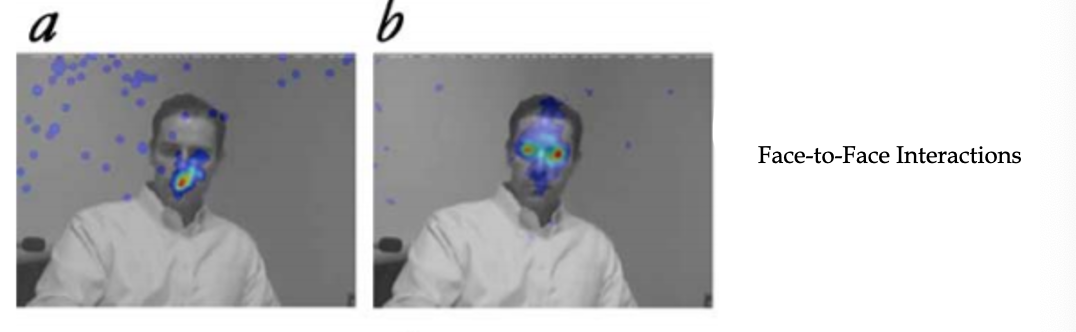

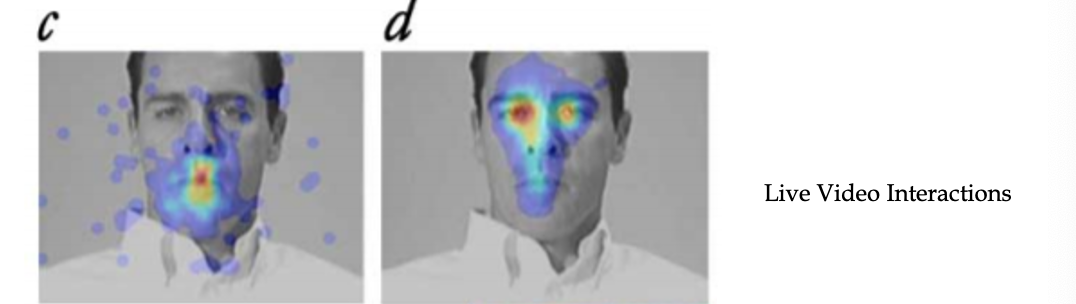
Note. a and b = face-to-face interaction; c and d = over live video. S.M. data in a and c; healthy, female controls data in b and d. Red color indicates participants spent the most time looking at that area of the face. Reproduced from “Amygdala damage impairs eye contact during conversations with real people,” by M.L. Spezio, P.Y.S. Huang, F. Castelli, and R. Adolphs, 2007, Neuroscience, 27(15), p. 3996, (Amygdala Damage Impairs Eye Contact During Conversations with Real People) Copyright 2007 by Society for Neuroscience.
