
Chapter 12: Pride – A Positive Self-Conscious Emotion
Behavior Changes
General Approach Behavior
In line with positive emotions, authentic pride is associated with several types of approach behavior. As stated earlier, experiencing authentic pride is rewarding and thus may motivate us to approach and success on future goals. When we experience pride due to a success, we approach our close others to tell them about our accomplishments (Tracy & Robins, 2007b). Further authentic pride leads to prosocial behaviors like helping others and selflessness (Hart & Matsuba, 2007; Michie, 2009), which can also be categorized as approach behaviors. Further, as mentioned above, authentic pride is associated with adaptive levels of the Big 5 traits – Extraversion, Agreeableness, Openness, Conscientiousness, and Emotional Stability, while hubristic pride is linked to low Agreeableness and low Conscientiousness (Tracy & Robins, 2007c).
Similarly, a loss of hubristic pride, such as when we fail or someone insults us, leads to approach behaviors, but these behaviors differ from authentic pride (Bushman & Baumeister, 1998; Tracy & Robins, 2007b). During loss of hubristic pride, people exhibit aggression and hostility toward others. These findings are in line with work on narcissism – which suggests that narcissists exhibit an over inflated sense of self not tied to specific accomplishments (i.e., hubristic pride) combined with an implicit low self-esteem. When narcissists receive negative feedback, they tend to aggress and lash out to re-establish their self-esteem (Baumeister et al., 2000; Tracy et al., 2009; Tracy & Robins, 2007b).
Facial Expressions
Tracy and Robins (2004b) found support for the existence of a distinct pride facial expression. In their first study, male and females posed expressions of happiness, surprise, and pride. Specifically, the pride expression included a smile, head tilt, expanded posture, and hands on hip or raised above the head. For each photo, participants identified the emotion from the following word labels: happiness, pride, surprise, and no emotion. With chance set at 33%, the majority of participants who selected the correct label are displayed in Table 4:
Table 4
When Viewing Photos, Percentage of Participants who Selected Correct Emotion Label
| Emotion | Range | % Selecting Correct Emotion Label | Significantly Different from 33% |
|---|---|---|---|
| Pride | 73-95% | 83% | Yes |
| Happiness | 63-98% | 79% | Yes |
| Surprise | 95-98% | 96% | Yes |
In their second study, participants were shown the same emotional expressions from Study 1, but this time asked to free label the emotion in the photograph. Then, the researchers used a 1-5 scale to rate whether the word participants provided was related to pride. For all 6 pride photos, pride-related words were provided at above-chance levels. On average, a majority (64%) of the participants stated a pride word.
Finally, study three investigated different types of facial expressions and which bodily changes were most indicative of the emotion pride. This study included four independent variables, and one dependent variable, outlined in the boxes below.
- Between-Subjects IV – Smile Intensity: small smile or large smile
- Between-Subjects IV – Head Tilt: Slight (15°) or Greater Tilt (30°)
- Within-Subjects IV – Arm Position: Above head and On hips
- Within-Subjects IV – Visible Posture: Waist-up and Shoulders-up
Figure 1
Four Participants Groups Based on the Two Between-Subjects Variables
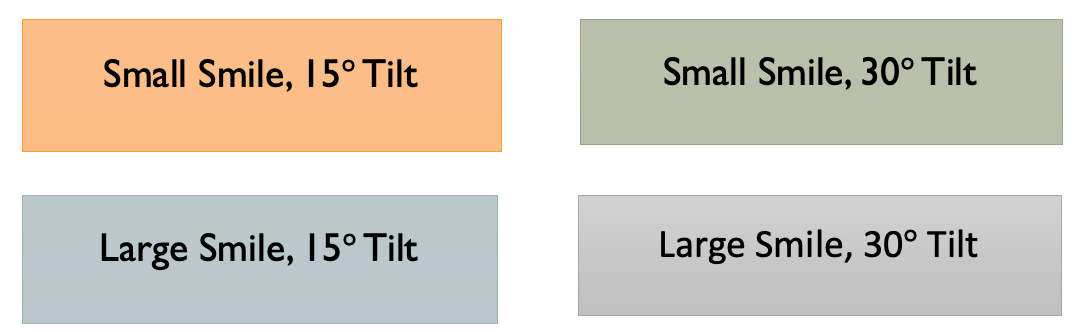
Figure 1
Example of Photos Labeled by Most Participants as Pride
Photo A
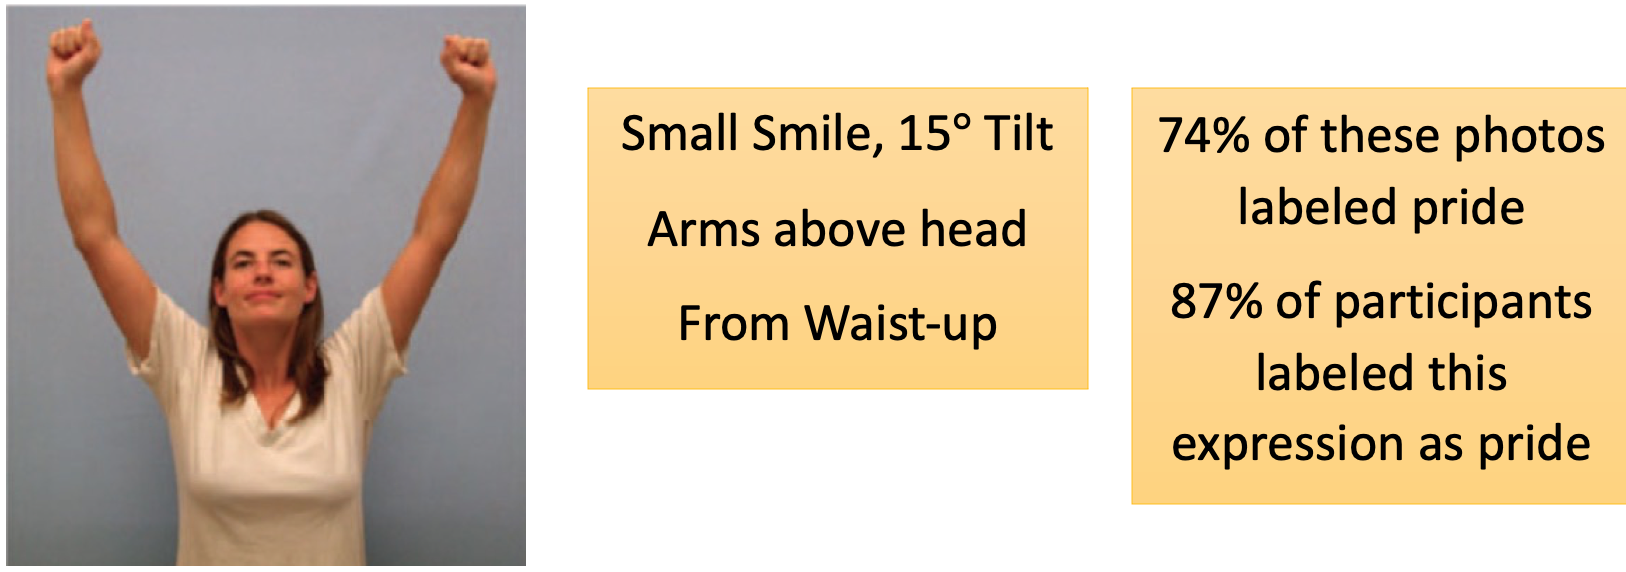
Reproduced from “Show your pride: Evidence for a discrete emotion expression,” by J.L. Tracy and R.W, Robins, R.W, (2004b), Psychological Science, 15(3), p. 196 (https://doi.org/10.1111/j.0956-7976.2004.01503008.x) Copyright 2004 by American Psychological Society.
Photo B
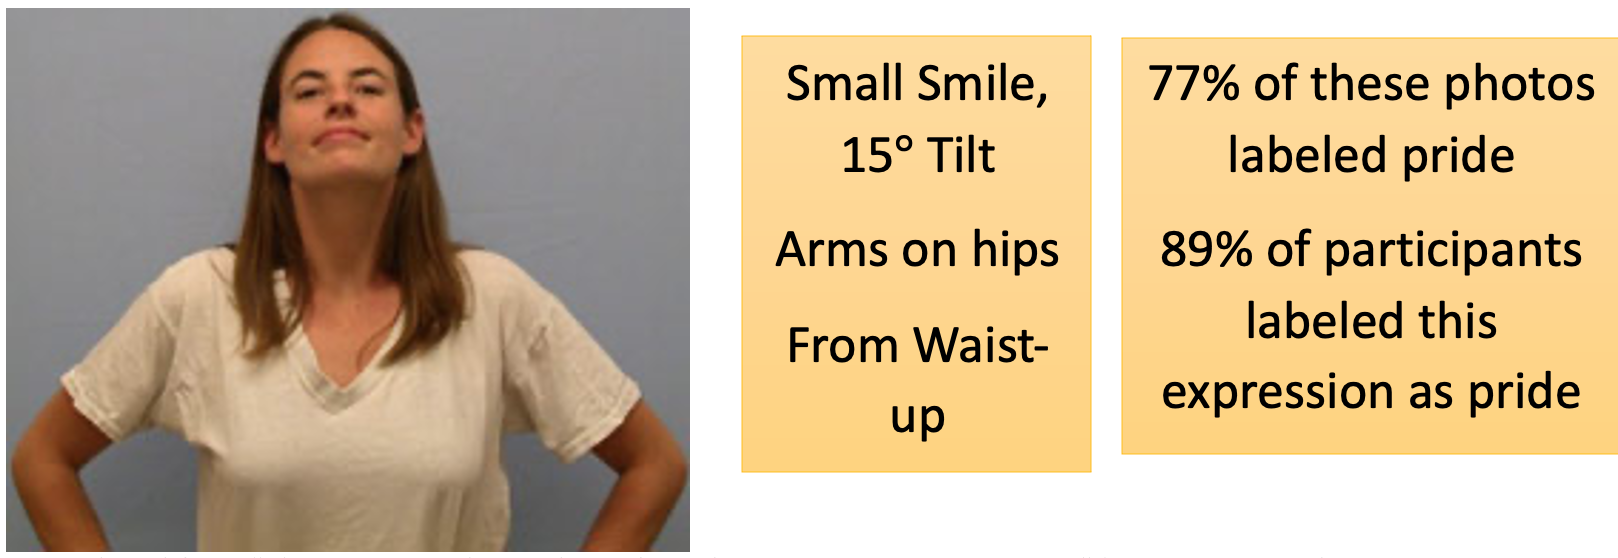
Reproduced from “Show your pride: Evidence for a discrete emotion expression,” by J.L. Tracy and R.W, Robins, R.W, (2004b), Psychological Science, 15(3), p. 196 (https://doi.org/10.1111/j.0956-7976.2004.01503008.x) Copyright 2004 by American Psychological Society.
Figure 2
Percentage of Children Identifying Correct Emotion Label
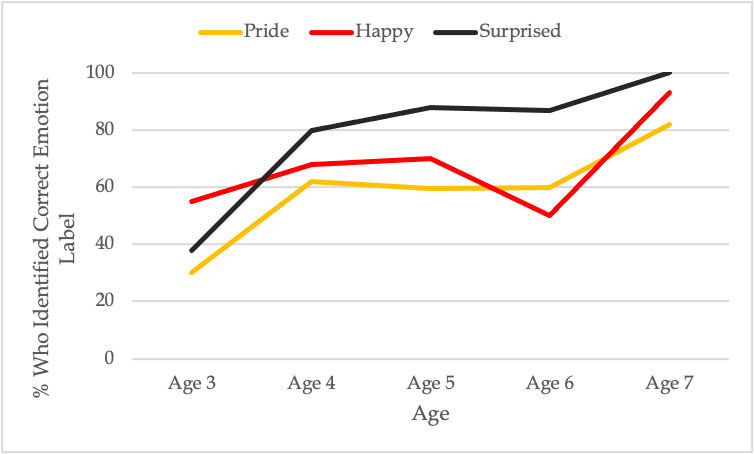
Adapted from “Can children recognize pride?” by J.L. Tracy, R.W. Robins, and K.H. Lagattuta, 2005. Emotion, 5(3), p. 253 (https://doi.org/10.1037/1528-3542.5.3.251) Copyright 2005 by the American Psychological Association.
Figure 3
Recognition Rates for Four Different Samples Across Three Emotions
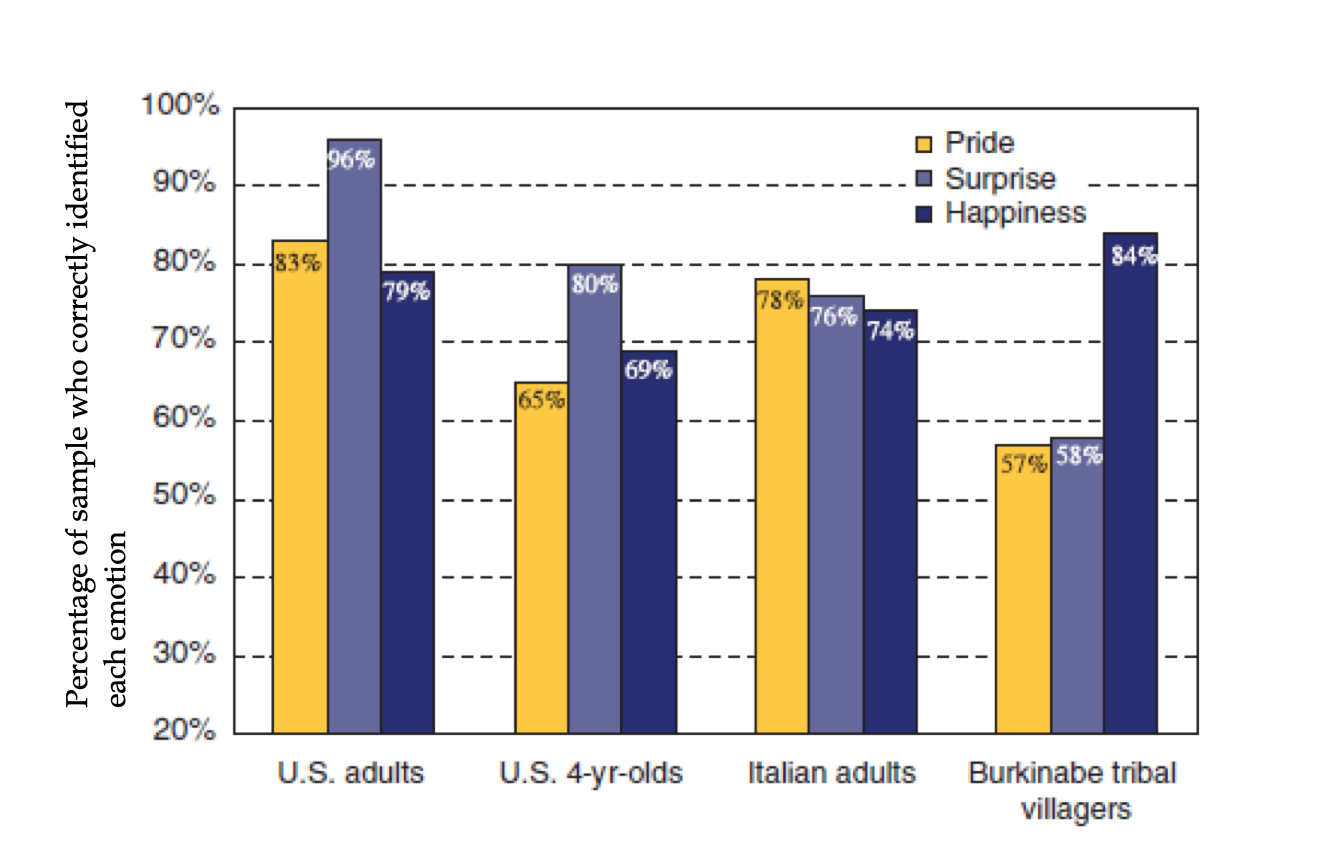
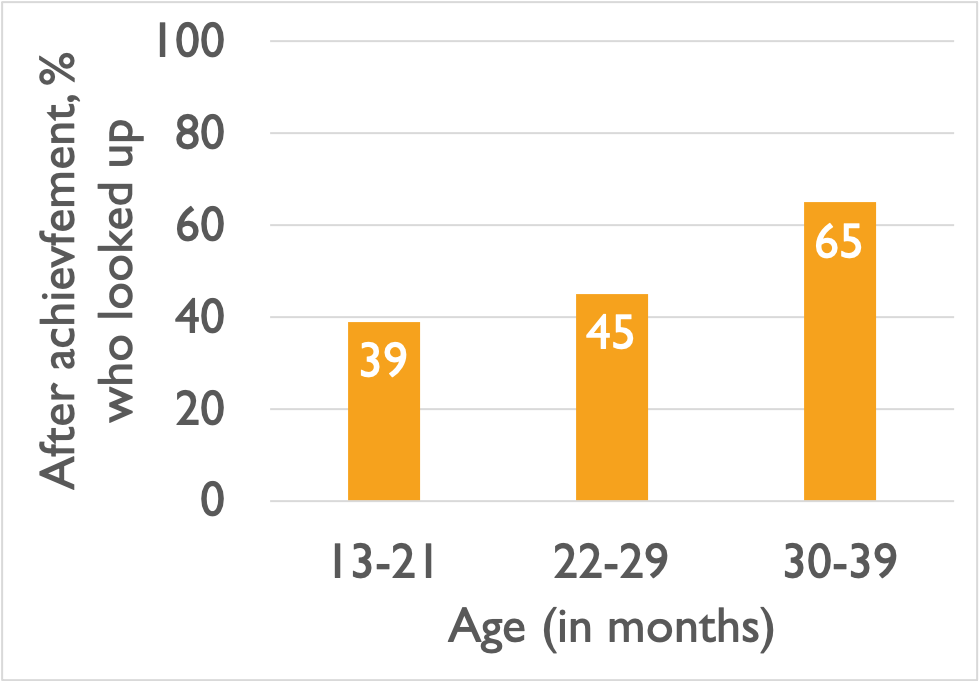
Additional work has found that children show and understand pride. Children first express pride by age 3 years old (Belsky & Domitrovich, 1997; Lewis et al., 1992; Stipek et al., 1992), after they have achieved self-awareness. Children recognize pride facial expression by age 4 (Tracy et al., 2004b) and understand concept of pride by ages 7-9. Developmentally pride differs from other basic emotions which are present in the first two to six months of life (Lewis, 2000; Reissland & Harris, 1991; Stipek et al., 1992). Self-awareness via the mirror-rouge test suggests that children do not differentiate between the self and others until around 18 to 24 months (Lewis, 2000; Lewis & Brooks-Gunn, 1979; Mascolo & Fischer, 1995; Stipek et al., 1992). But, some researchers believe self-recognition is not enough to experience pride and other self-conscious emotions. Some work suggests children cannot experience pride until they have the cognitive complexity to make conscious internal attributions of globality and stability, which may not occur until 2.5 to 3 years old (Mascolo & Fischer, 1995; Stipek et al., 1992).But other researchers believe pride is present before age 2. First, some evidence suggests self-recognition occurs as early as 2 months old (Rochat & Striano, 2002), suggesting pride could occur this early as well. In one study (Stipek, 1992), children of various ages (x-axis) were given the opportunity to achieve a task in the lab. The dependent variable, experience of achievement, is measured simply as whether or not the child looks up and toward mom or dad after achieving task. Findings in Figure 4 show that about 39% of children expressed pride before age 2 (24 months), while most children do express pride by year 2. These findings do suggest that pride may be expressed earlier than we thought – providing some confirmation for evolutionary theory.
Figure 4
Percentage of Children who Expressed Pride by Age Group (in months)
Adapted from “, Self-evaluation in young children,” by D. Stipek, S. Recchia, and S. McClintic, 1992, Monographs of the Society for Research in Child Development, 57(1), Serial No. 226, p. 28. Copyright 1992 by Wiley.
Vocal Changes
Table 5 displays Sauter et al.’s (2010) study (review here ) emotional story and corresponding vocal sound for authentic pride. Recall that in this study Himba and English participants listened to the vocal sound from a Himba voice and an English voice.
| Emotion Described in Story | Correct Vocal Sound |
|---|---|
| Achievement [Pride]
English version: Someone gets a phone call and is offered a job that they really want and they feel like they want to celebrate.
Himba version: Someone manages to kill a lion by themselves and they feel like they want to celebrate. |
Cheers |
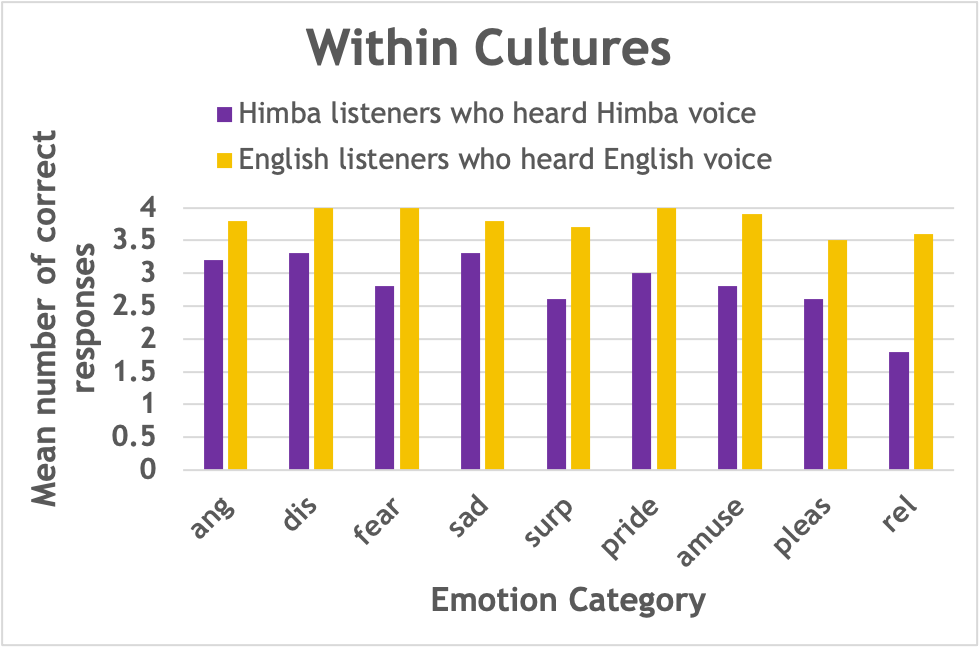
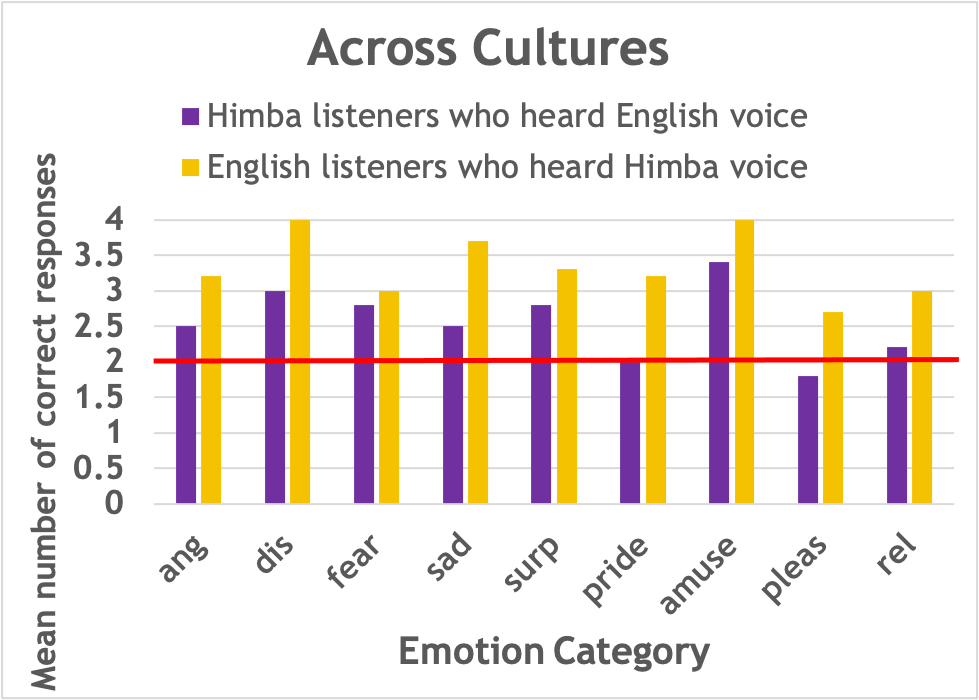
Findings are displayed in Figures 5 and 6. Looking at Figure 5, when participants listened to a voice from their own culture, both Himba and English participants matched sound to story at beyond chance levels. But, when we go to across cultures, Himba do not select the correct sound at beyond chance levels. These findings suggests that the Himba performed better when they listened to cheers from their own culture.
Figure 5
Reproduced from “Cross-cultural recognition of basic emotions through nonverbal emotional vocalizations,” by D.A. Sauter, F. Eisner, F., P. Ekman, and S.K. Scott, S.K., 2010, Proceedings of the National Academy of Sciences (PNAS), 107(6), p. 2410 (https://doi.org/10.1073/pnas.0908239106) Open Access by PNAS.
Figure 6
Mean Number of Correct Emotion Labels for Emotion Stories for Himba and European English Participants
Reproduced from “Cross-cultural recognition of basic emotions through nonverbal emotional vocalizations,” by D.A. Sauter, F. Eisner, F., P. Ekman, and S.K. Scott, S.K., 2010, Proceedings of the National Academy of Sciences (PNAS), 107(6), p. 2410 (https://doi.org/10.1073/pnas.0908239106) Open Access by PNAS.
In Cordaro, Keltner, and colleagues’ (2016) study on vocal change (review here), participants matched the same above story about triumph to a vocal sound. The story was “S/he has just won a very challenging competition and feel triumphant” (Cordaro et al., 2016, Table 3, p. 121). The correct vocal sound for triumph “woo-hoo.” All countries, including Bhutan, matched the vocal sound to the triumph stories at beyond chance levels. The lowest recognition rates were obtained in the US (85.5%) and in Bhutan (about 45%).
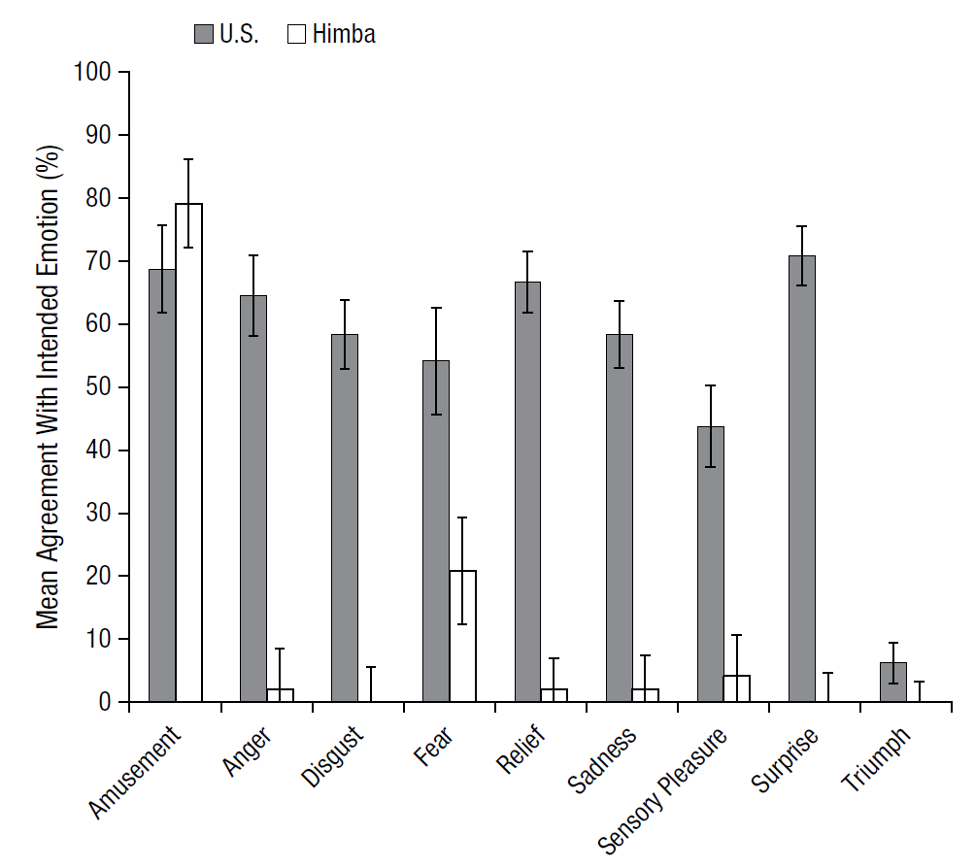
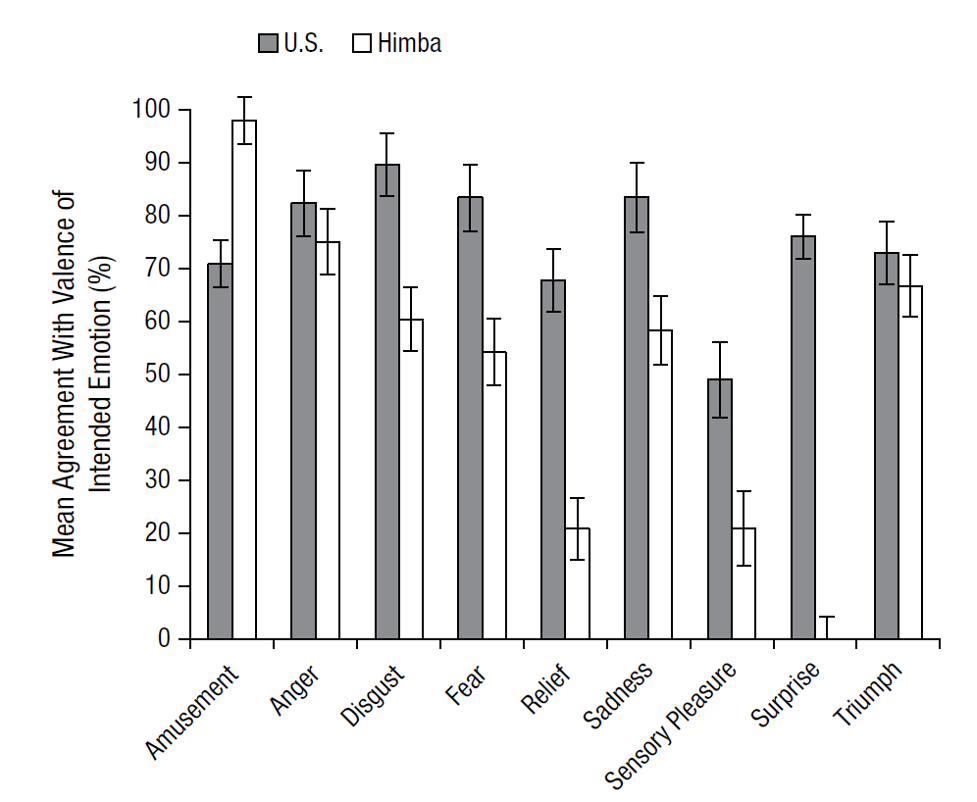
Gendron, Barrett et al. (2014a) (review study here), used the “woo hoo” sound to represent triumph (i.e., achievement). Remember in this study, participants heard the sound and then free-labeled the emotion. Then, researchers coded the free label into an emotion category. Findings in Figure 7 show that a small portion of US participants provided a pride-related word for the “woo-hoo” sound and none of the Himba did. Now, a large group of Himba and US participants did indicate the valence of the “woo hoo” sound was positive (see Figure 8), supporting some constructivist views that emotions are simply a range of valence of arousal. Results showed that Himba participants free label responses for “woo hoo” were either non-emotion related or related to the emotion amusement.
Figure 7
Percentage of Participants who Free Labeled Woo-hoo Sounds as Triumph
Reproduced from “Cultural Relativity In Perceiving Emotion From Vocalizations,” by M. Gendron, D. Roberson, J.M. van der Vyver, and L.F. Barrett, 2014a, Psychological Science, 25(4), p. 914, (https://doi: 10.1177/0956797613517239). Copyright 2014 The Authors.
Figure 8
Self-Reported Valence of Each Emotion
Reproduced from “Cultural Relativity In Perceiving Emotion From Vocalizations,” by M. Gendron, D. Roberson, J.M. van der Vyver, and L.F. Barrett, 2014a, Psychological Science, 25(4), p. 915, (https://doi: 10.1177/0956797613517239). Copyright 2014 The Authors
