Chapter 1: What is an Emotion?
The Duration of an Emotion
Why do emotions seem to last longer than they really do?
A common misperception is that emotions can last for hours or days. In a study (Sonnemans, 1990, as cited in Frijda, Mesquita, Sonnemans, & van Goozen, 1991 ), participants were asked to recall a recent emotional experience. After recalling the emotion episode, participants 1) selected the duration of emotion from a list of time period categories (see Figure 2), and 3) drew a graph to show the onset and length of emotion episode (Figure 3). To determine the length of emotion episode in Figure 3, researchers subtracted the time of emotion onset from the time at which participants’ emotion returned to baseline. Figure 2 shows that 50% of participants reported the emotion lasted for longer than 1 hour, whereas 25% of the sample reported the emotion lasted for more than 10 minutes – up to 1 hour. Only a small percentage (4.32%) accurately reported that the emotion was short-lived. Figure 3 demonstrates that when participants are asked to graph the timing of their emotion episode, 68.64% of the sample reported that their emotion dissipated anywhere from 1-3 hours to more than 1 week after the eliciting event occurred! Only a small portion of the sample (11.35%) accurately drew that they returned to baseline in 10 minutes or less.
As mentioned above, emotions are short-lived changes caused by an eliciting event. So, why are people misperceiving the length of an emotion episode?
Figure 2
Self-reported length of time for recalled emotions
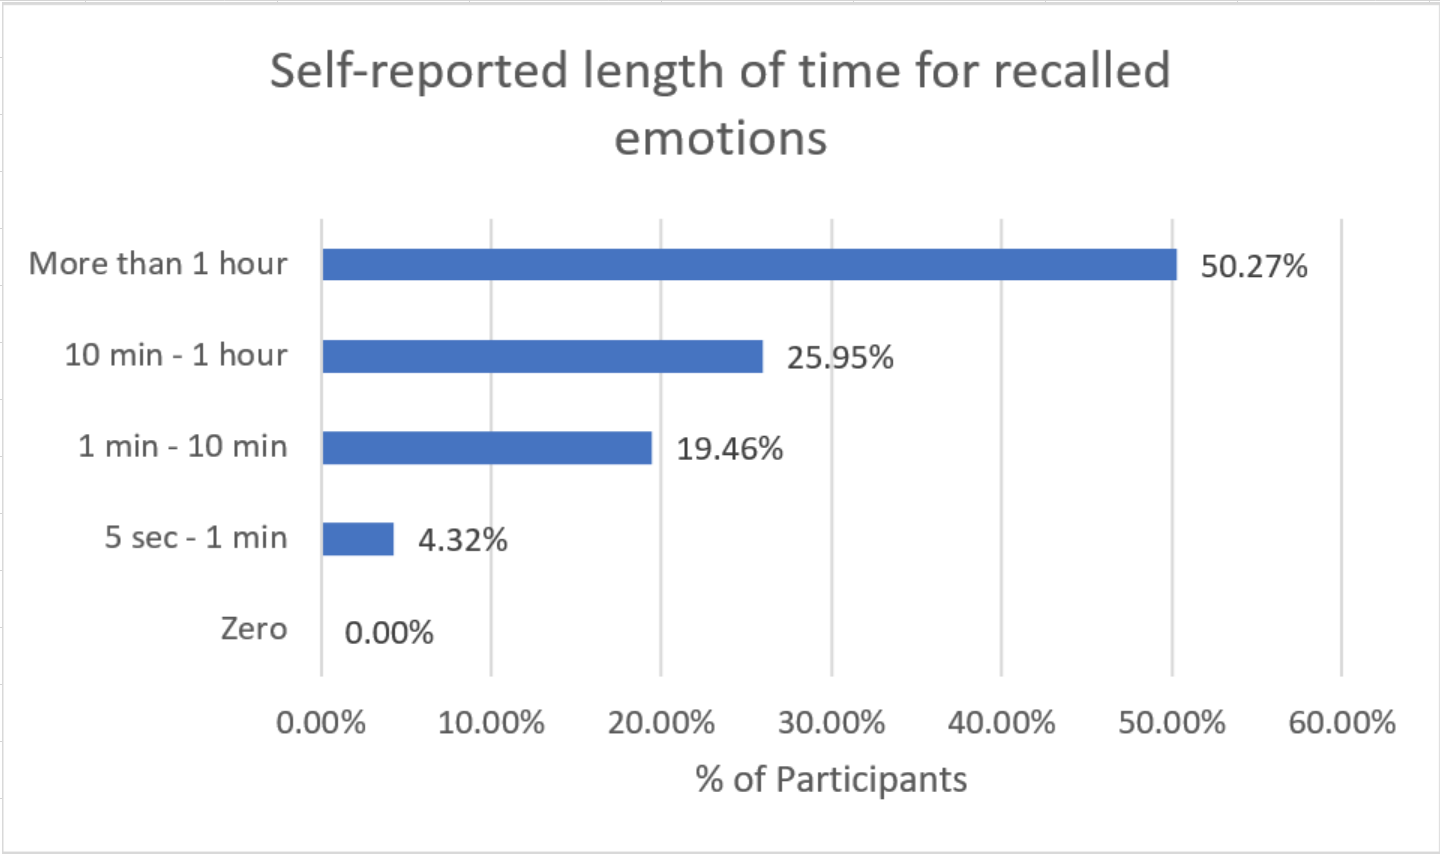
Adapted from “The Duration of Affective Phenomena or Emotions, Sentiments, and Passions,” by N.H. Frijda, B. Mesquita, J. Sonnemans, and S. van Goozen, 1991, in K.T. Strongman (Ed.) International Review of Studies on Emotion, (Vol. 1, pp. 189). Copyright 1991 by John Wiley & Sons.
Figure 3
Participants’ graphed duration of emotion (time at which their emotion returned to baseline minus onset of emotion)

Adapted from “The Duration of Affective Phenomena or Emotions, Sentiments, and Passions,” by N.H. Frijda, B. Mesquita, J. Sonnemans, and S. van Goozen, 1991, in K.T. Strongman (Ed.) International Review of Studies on Emotion, (Vol. 1, pp. 189). Copyright 1991 by John Wiley & Sons.
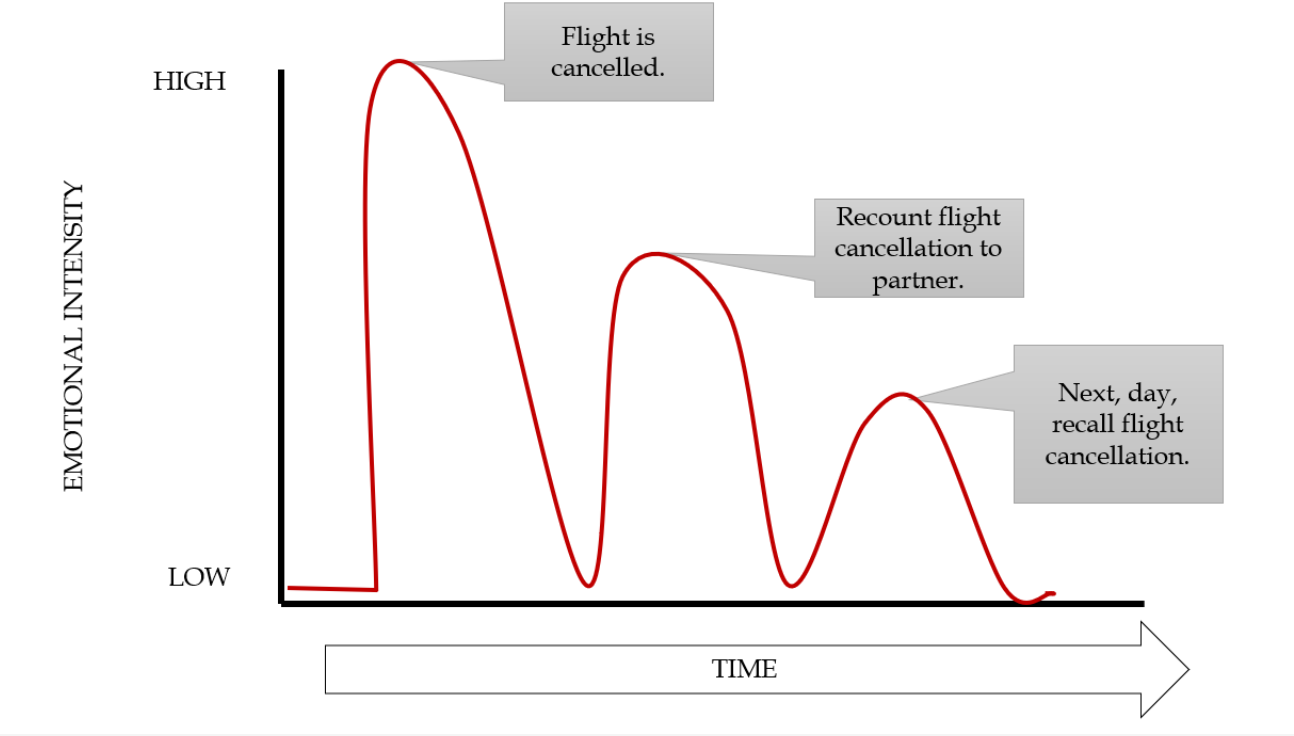
A recurring emotion episode explains why people think emotions last longer than they do. Figure 4 shows people’s perception of the length of an emotion episode. Figure 5 exhibits the actual recurring emotion episode. A recurring emotion episode occurs when we reexperience the eliciting event by recalling the emotion episode multiple times or even by discussing the emotional event with close others. Thus, recalling this event makes it seem like the emotion episode is lasting for hours, as in Figure 4. But, in reality, each time you recall or discuss the eliciting event, you are eliciting the emotion all over again! Hence, the term recurring emotion episodes! So, each time you recall the eliciting event should be considered a separate emotion episode.
A recurring emotion episode has some interesting characteristics. First, when we experience a recurring emotion episode, the intensity of the emotion, label attributed to the emotion, and the eliciting event change. For instance, let’s say your flight is cancelled so you miss an important work function. When you first learn your flight is cancelled (the eliciting event), you experience high levels of rage. So, then an hour later, you call your significant other and recount the eliciting event to them, and experience this same emotion again, although this time your emotion would be less intense and now you might label the emotion anger. Then, the next day you recall the flight cancellation again, and still experience a negative emotion, but this time the emotion is less intense and you now label it annoyance. In total, each time you recall the original eliciting event, the felt intensity of the emotion decreases, the emotion label changes (rage, to anger, to annoyance). In addition, the cause of the emotion changes. In the original episode, you experienced the eliciting event of the flight cancellation. Following this original episode, the eliciting event changed to your conversation, and then your recalled memory. The figure below demonstrates how intensity of the emotion would change as the emotion episode recurs.
Figure 4
People’s perception of emotion episode
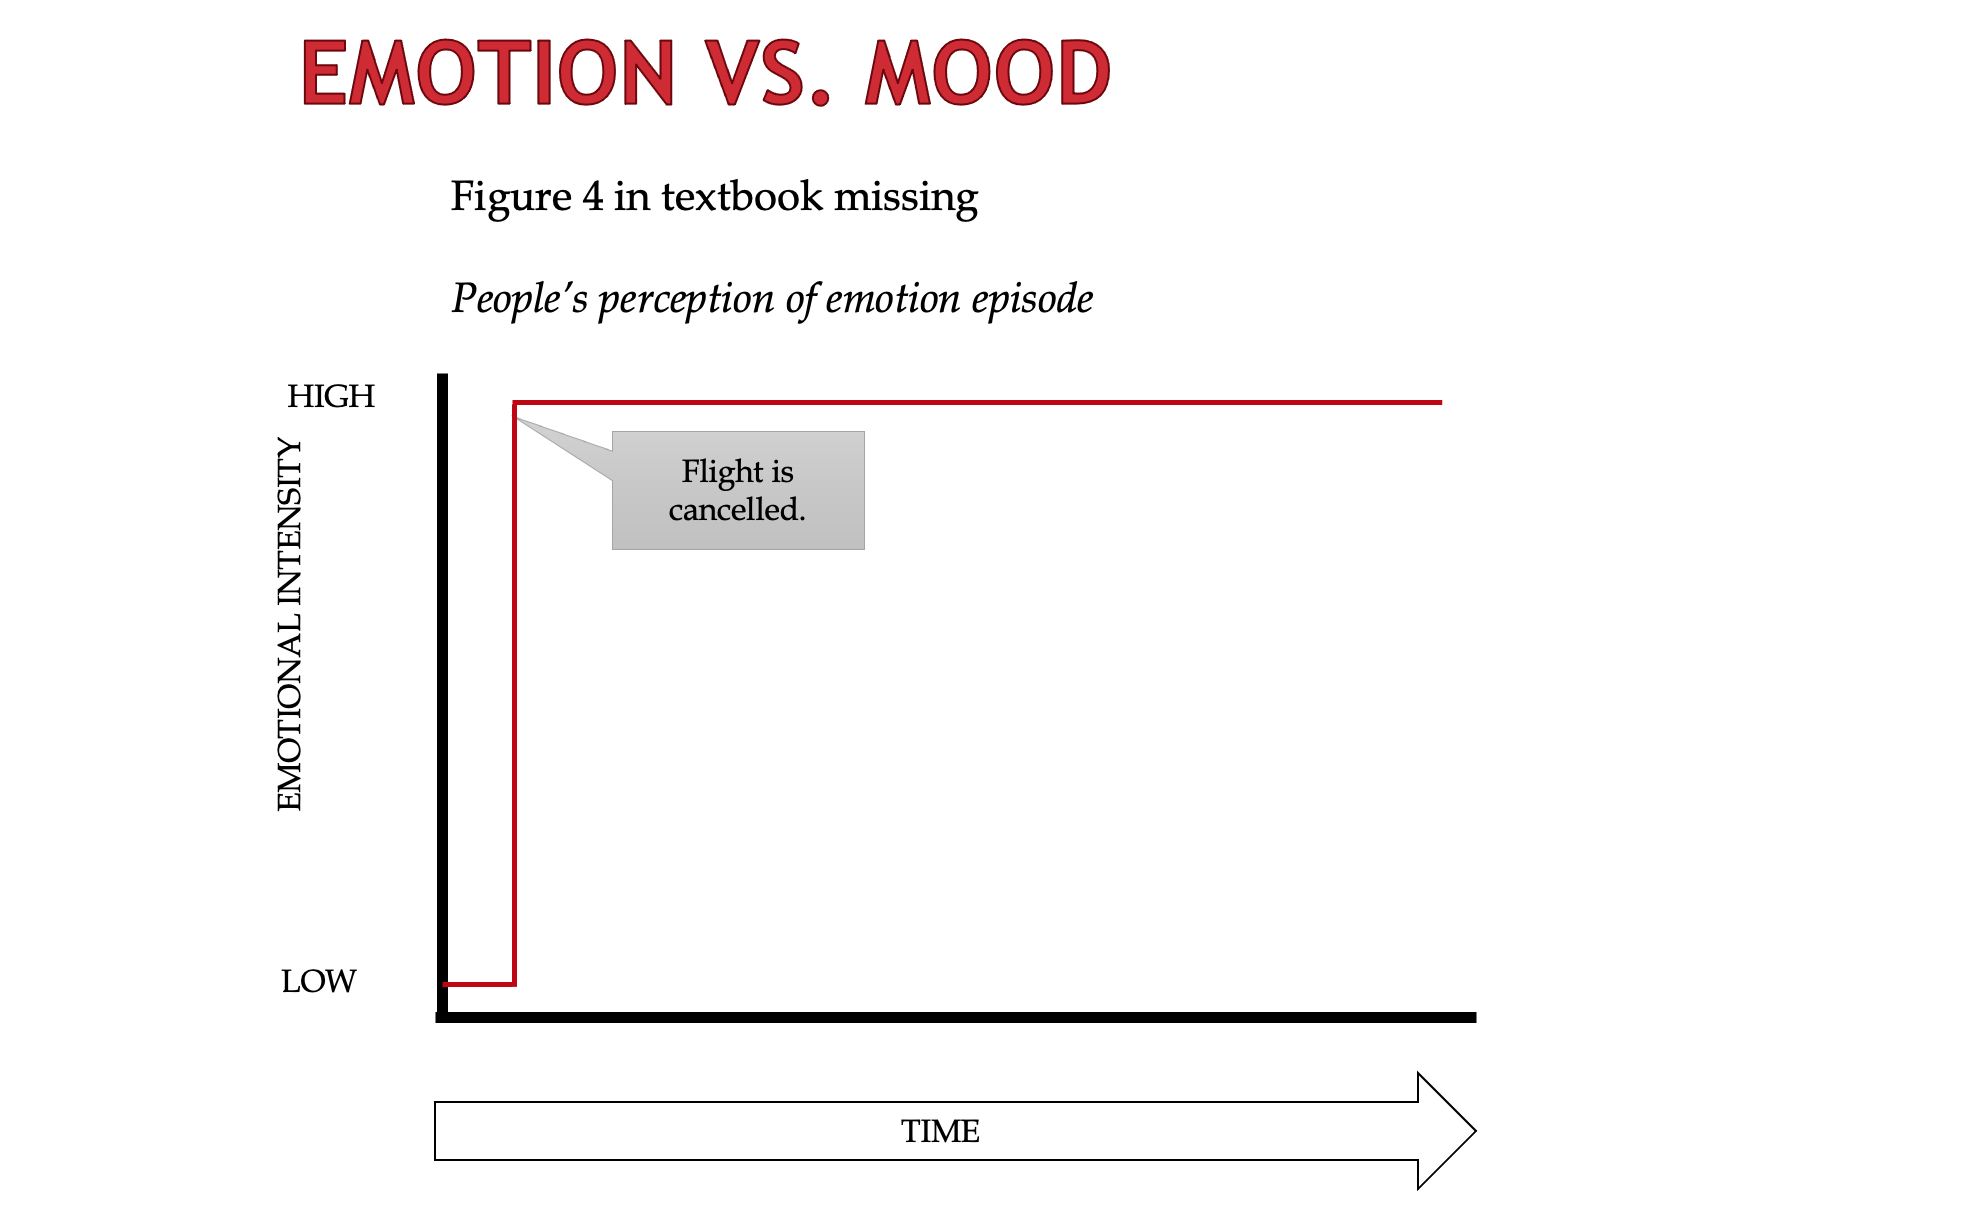
Figure 5
Visual of recurring emotion episode