
Chapter 13: Positive Emotions
Vocal Changes
Next, we will discuss vocal changes associated with positive emotions. First, let’s discuss Sauter et al.’s (2010) study, which you can review here. Pay attention to any limitations discussed about this study.
In this study, participants matched an emotional story to a corresponding vocal sound for positive and negative emotions. Recall that in this study Himba and English participants listened to the vocal sound from a Himba voice and an English voice. In this study, positive emotions or feelings could be achievement/pride, amusement, sensual pleasure, and relief. In Figures 8 and 9, note that all positive emotions met the 2 out of 4 threshold, except for relief (Figure 8) and sensory pleasure (Figure 9). Why would relief and sensory pleasure not be universally recognized? It could be a methodological problem – maybe the story or the voice did not accurately convey the emotion. Alternatively, it could be sensory pleasure and relief are not universal emotions.
Table 17
Emotional Stories and Corresponding sounds from Sauter et al. (2010)
| Emotion Described in Story | Correct Vocal Sound |
|---|---|
| Achievement [Pride]
English Version: Someone gets a phone call and is offered a job that they really want and they feel like they want to celebrate. Himba Version: Someone manages to kill a lion by themselves and they feel like they want to celebrate. |
Cheers |
| Amusement
Someone is being tickled by a child and finds it very funny |
Laughs |
| Anger
Someone is being treated in a rude way deliberately, and is very angry about it. |
Growl |
| Disgust
Someone has just eaten rotten food and feels very disgusted. |
Retches [vomiting] |
| Fear
Someone is suddenly faced with a dangerous animal and feels very scared. |
Screams |
| Sensual Pleasure
Someone is having sex and enjoying it very much. |
Moans |
| Relief
Someone has just found their child after it was lost and they feel very relieved. |
Sighs |
| Sadness
Someone finds out that a member of their family has died and they feel very sad. |
Sobs |
| Surprise
Someone sees a bright light in the middle of the night and is very surprised. |
Sharp Inhalation |
Figure 8
Mean Number of Correct Emotion Labels for Emotion Stories for Himba and European English Participants – Within Cultures
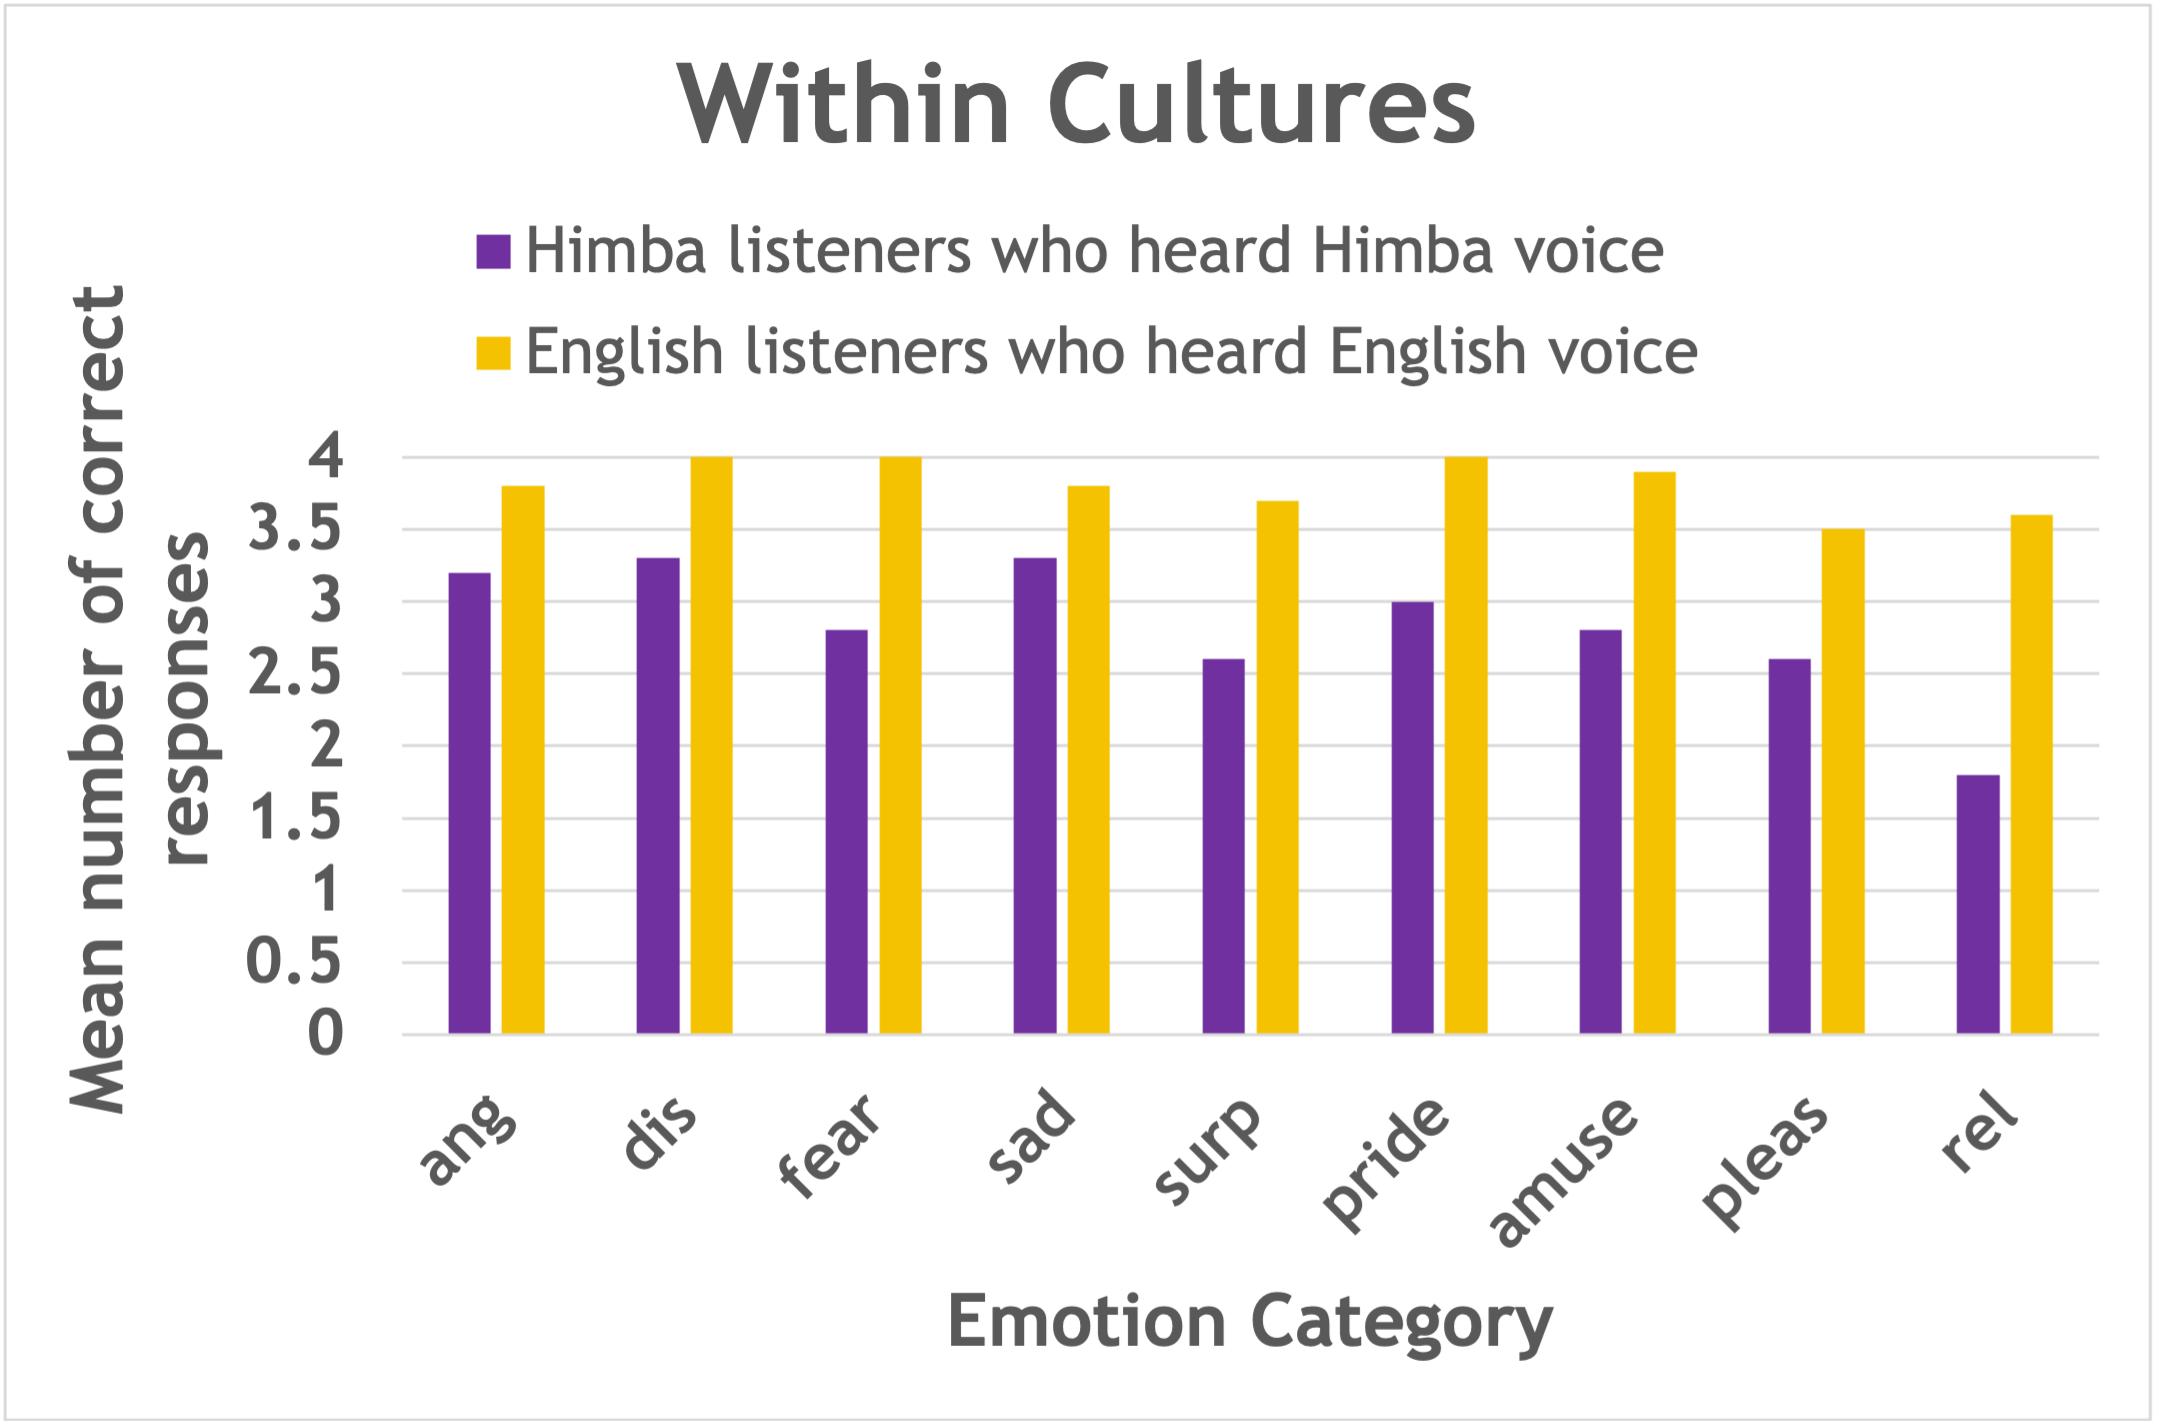
Reproduced from “Cross-cultural recognition of basic emotions through nonverbal emotional vocalizations,” by D.A. Sauter, F. Eisner, F., P. Ekman, and S.K. Scott, S.K., 2010, Proceedings of the National Academy of Sciences (PNAS), 107(6), p. 2410 (https://doi.org/10.1073/pnas.0908239106) Open Access by PNAS.
Figure 9
Mean Number of Correct Emotion Labels for Emotion Stories for Himba and European English Participants – Across Cultures
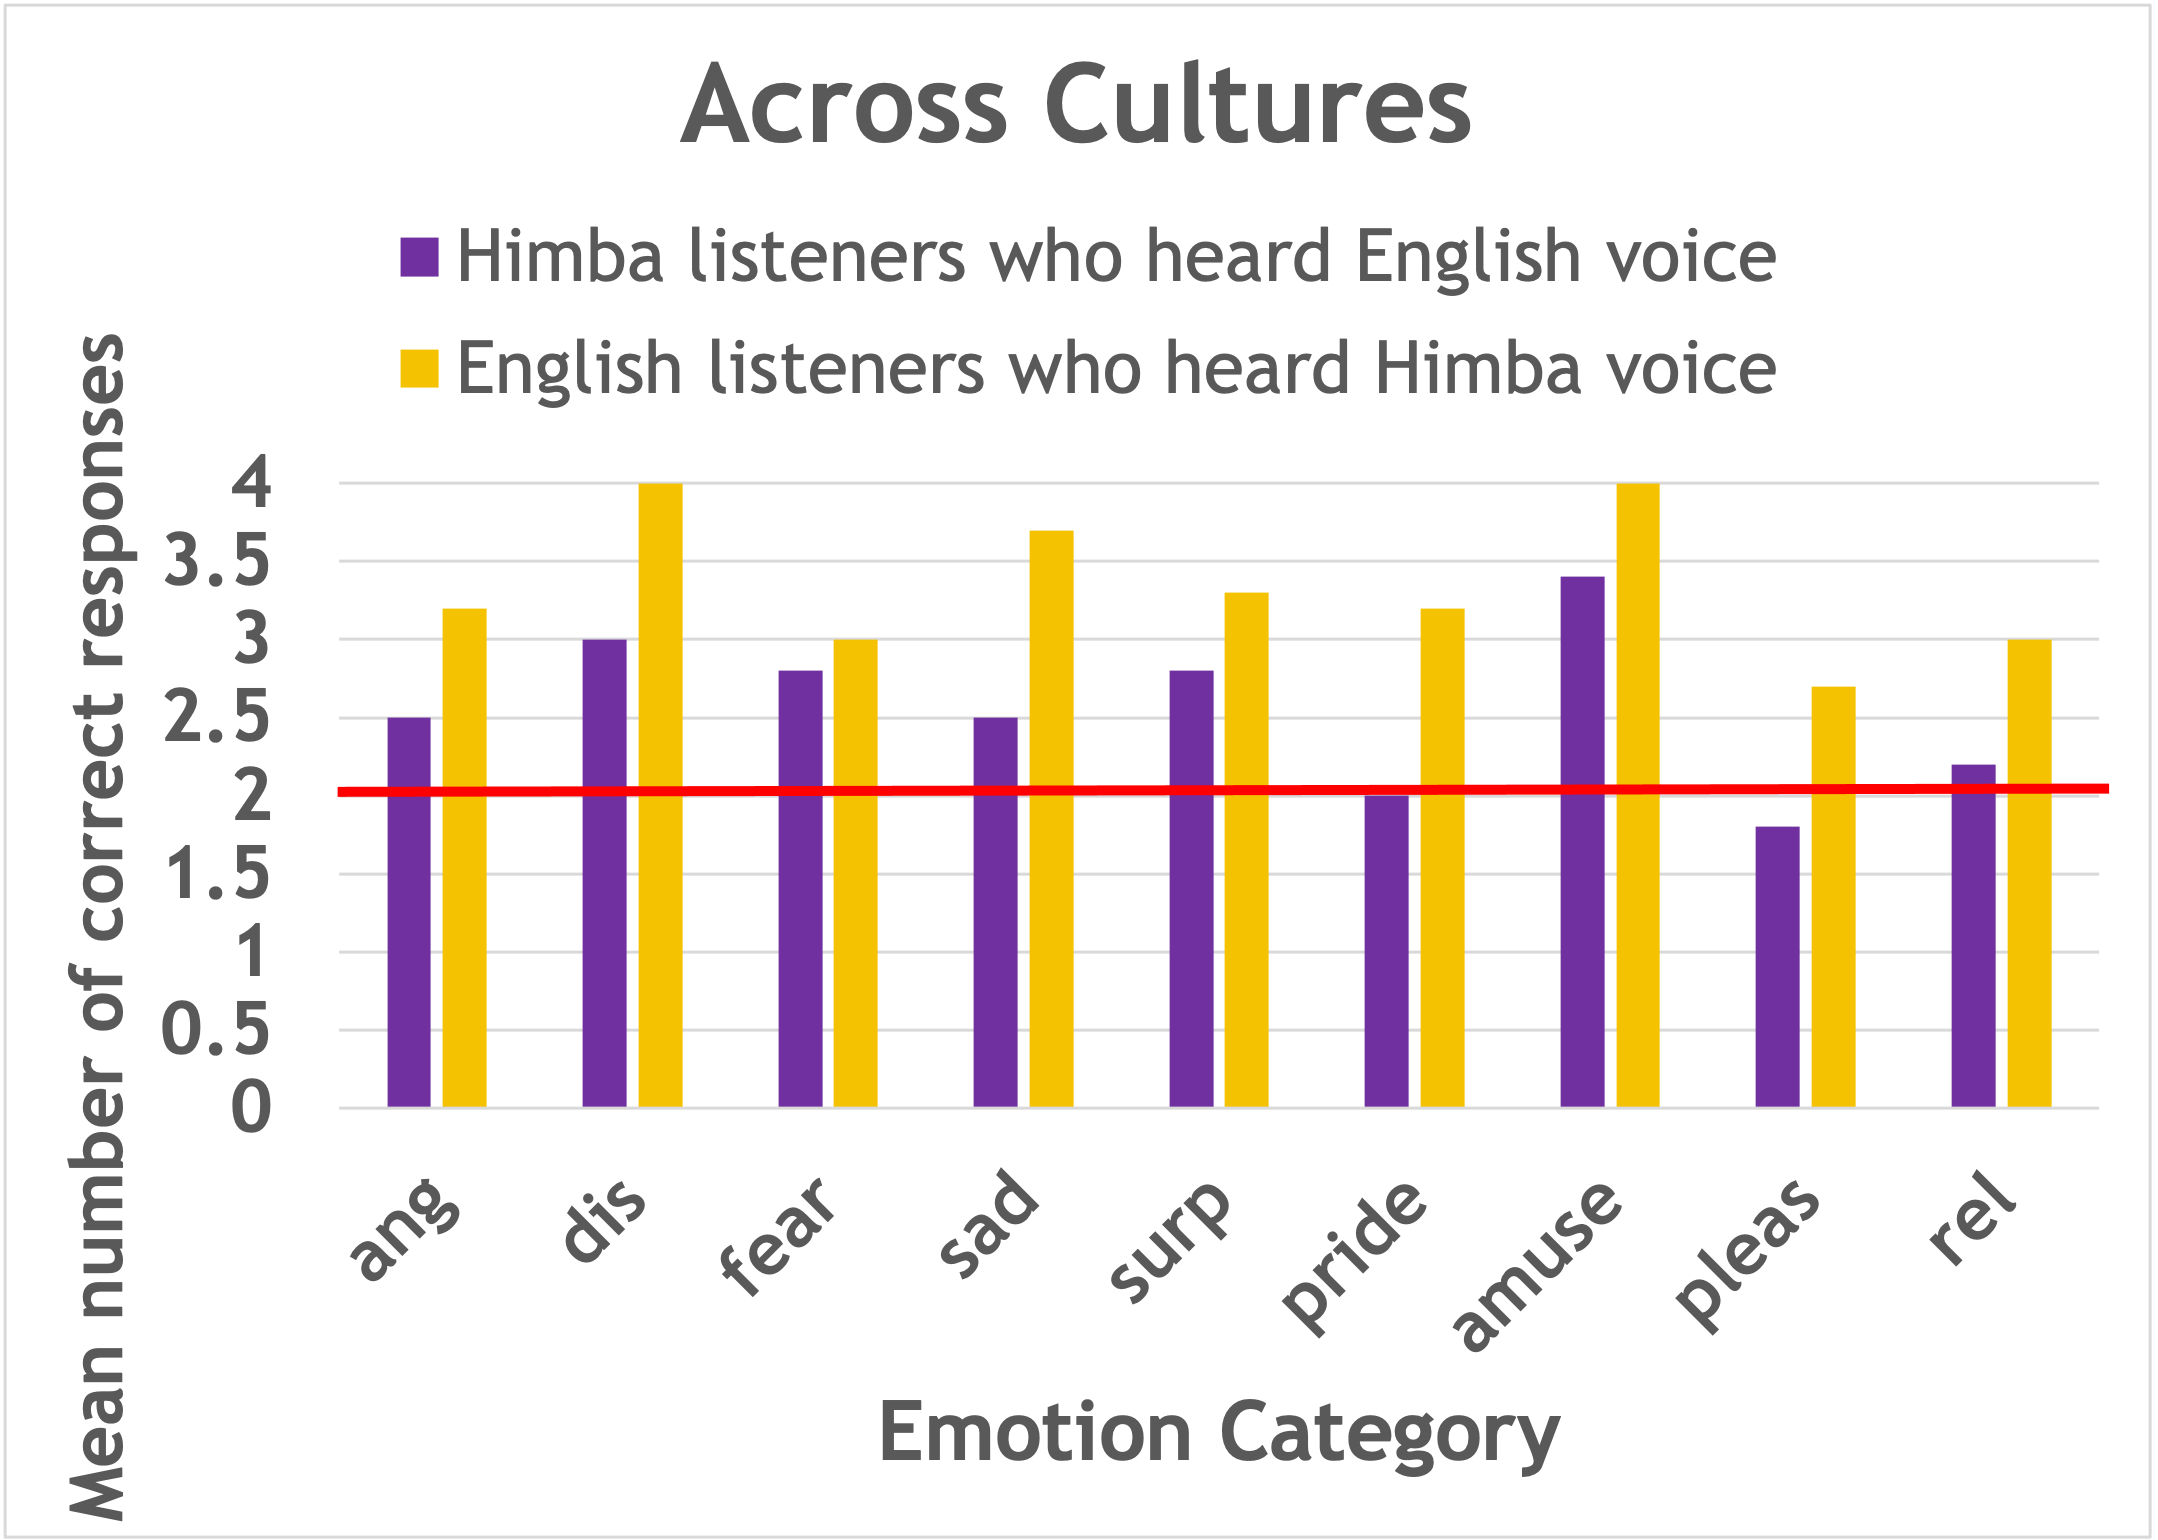
Reproduced from “Cross-cultural recognition of basic emotions through nonverbal emotional vocalizations,” by D.A. Sauter, F. Eisner, F., P. Ekman, and S.K. Scott, S.K., 2010, Proceedings of the National Academy of Sciences (PNAS), 107(6), p. 2410 (https://doi.org/10.1073/pnas.0908239106) Open Access by PNAS.
In Cordaro, Keltner, and colleagues’ (2016) study on vocal change (review here), participants in 10 industrialized countries (Table 17) and Bhutanese participants (Figure 10) again matched stories to a vocal sound . Most of the percentages are above 50%, which in general would suggest that each of these nine feeling states have a universal vocal sound. Look at figures 10, and 11. Which positive emotion showed the lowest recognition rates? Which countries showed recognition rates lower than 50 and for which emotion?
Figure 10
Percentage Correctly Matched for 9 Positive Emotions or Feeling States
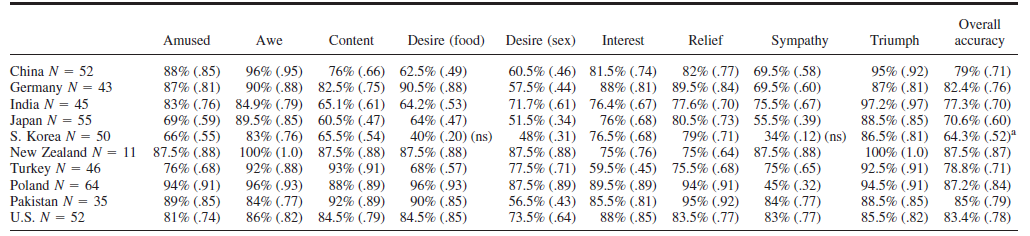
Note. Values marke as not significant (ns) represent nonverbal vocal bursts that were not recognized at above-chance rates. Footnotes indicate cultural differences in composit accuracy rating at p < .01.
Significant differences in effect sizes were found between Germany > S. Korea (.24), NZ > S. Korea (.35), Poland > S. Korea (.32), Pakistan > S. Korea (.27), U.S. > S. Korea (.26)
Figure 11
Percentage Correct for Bhutanese participants across 17 constructs
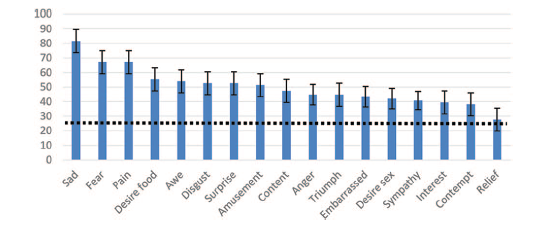
Average recognition rates for remote Bhutanese villagers in the vocal burst recognition task. The hashed line represents chance for the nonparametric t test. Error bars are shown at the 95% confidence level. See the online article for the color version of this figure.
Reproduced from D.T., Cordaro, D. Keltner, S. Tshering, D. Wangchuk, and L.M. Flynn, 2016, The voice conveys emotion in ten globalized cultures and one remote village in Bhutan. Emotion, 16(1), p. 123 (https://doi.org/10.1037/emo0000100). Copyright 2015 American Psychological Association.
Participants first completed a categorization task in which they heard the non-verbal vocal sound and then selected one emotion label from a list of five options: achievement/triumph, amusement, contentment, sensual pleasure, and relief. Each emotion label was shown with the corresponding emotion scenario (see Table 18). Following the categorization task, participants listened to each vocal sound and rated how much each sound represented each of the five emotions on a 1 to 7 scale.
Table 18
Emotional Scenarios for each Emotion (Sauter & Scott, 2007)
| Emotion | Emotion Scenario |
|---|---|
| Achievement | You get a phone call offering you a job you really want |
| Amusement | You are being tickled and find it really funny. |
| Contentment | You are sitting on the beach watching the sunset. |
| Pleasure | Your boyfriend/girlfriend is touching you in a sensual way. |
| Relief | You thought you had lost your keys but find them again. |
Adapted from “More Than One Kind of Happiness: Can We Recognize Vocal Expressions Of Different Positive States?” by D.A. Sauter and S.K. Scott, 2007, Motivation and Emotion, 31(3), p. 198 (https://doi.org/10.1007/s11031-007-9065-x) Copyright 2007 by Springer
Table 19
Percentage of British Participants who Selected each Emotion Label when Hearing each Vocal Sound
| Vocal Sound Participants Heard | Selected Label – Achievement | Selected Label – Amusement | Selected Label – Contentment | Selected Label – Pleasure | Selected Label – Relief |
|---|---|---|---|---|---|
| Achievement | 88.4 | 4.7 | 1.9 | 1.9 | 3.2 |
| Amusement | 1.9 | 90.4 | 1.6 | 3.9 | 2.3 |
| Contentment | 7.9 | 5.0 | 52.4 | 25.2 | 9.5 |
| Pleasure | 0.3 | 0.4 | 29.9 | 61.6 | 7.9 |
| Relief | 0.3 | 0.3 | 10.1 | 5.3 | 83.9 |
Percentage of Swedish Participants who Selected each Emotion Label when Hearing each Vocal Sound
| Vocal Sound Participants Heard | Selected Label – Achievement | Selected Label – Amusement | Selected Label – Contentment | Selected Label – Pleasure | Selected Label – Relief |
|---|---|---|---|---|---|
| Achievement | 70.9 | 14.4 | 4.5 | 1.9 | 8.8 |
| Amusement | 2.5 | 80.6 | 4.1 | 5.3 | 7.2 |
| Contentment | 8.8 | 2.8 | 47.8 | 26.9 | 12.5 |
| Pleasure | 0.9 | 1.3 | 32.8 | 56.9 | 8.1 |
| Relief | 5.3 | 0.3 | 13.1 | 13.1 | 67.8 |
Note. Red bolded percentages indicate the correct answer.
Reproduced from “More Than One Kind of Happiness: Can We Recognize Vocal Expressions Of Different Positive States?” by D.A. Sauter and S.K. Scott, 2007, Motivation and Emotion, 31(3), p. 194 (https://doi.org/10.1007/s11031-007-9065-x) Copyright 2007 by Springer
Participants’ self-reported emotions for each vocal sound are displayed in Figure 11. For most vocal sounds, participants rated the correct emotion as the highest. For the contentment sound, British participants rated pleasure as the highest whereas Swedish participants rated achievement, sensory pleasure, and amusement higher than contentment. For relief, Swedish participants rated the relief sound as higher on achievement than relief.
Figure 11
Self-reported Ratings on Five Positive Emotions for Each Vocal Sound
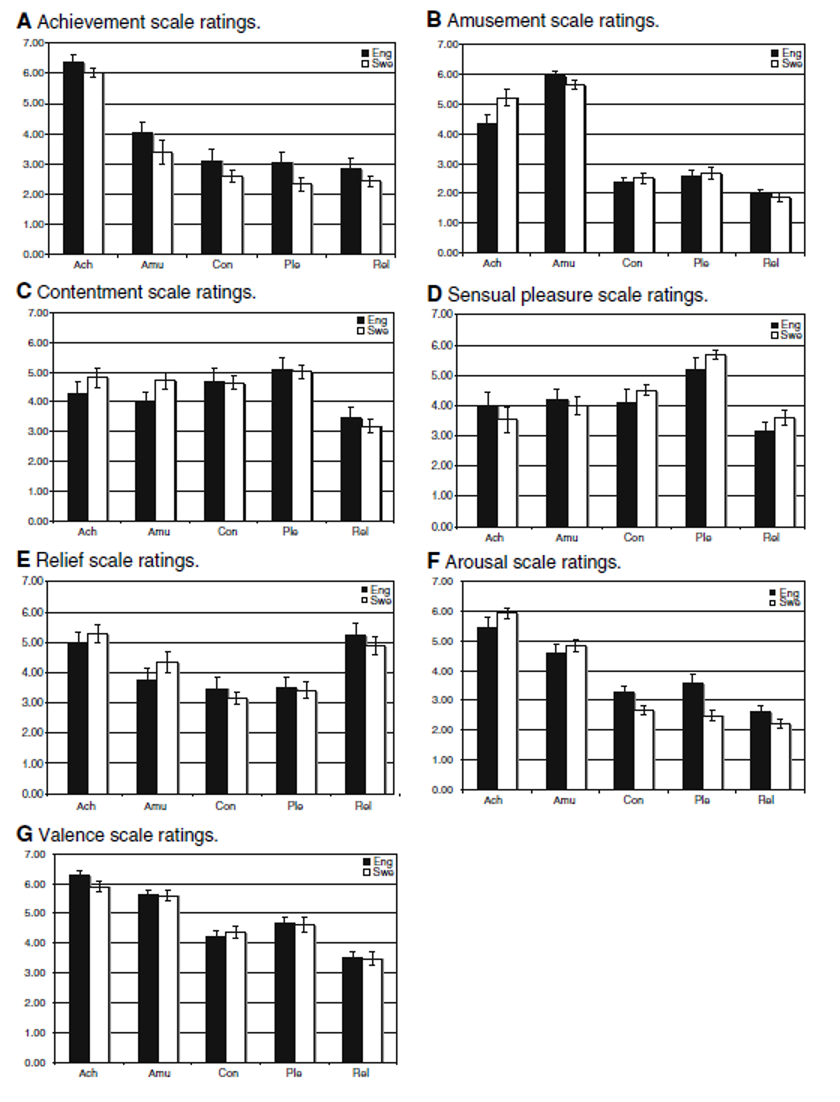
Reproduced from “More Than One Kind of Happiness: Can We Recognize Vocal Expressions Of Different Positive States?” by D.A. Sauter and S.K. Scott, 2007, Motivation and Emotion, 31(3), p. 196 (https://doi.org/10.1007/s11031-007-9065-x) Copyright 2007 by Springer
This study provides evidence that participants in two cultures correctly identified several positive emotions. Two exceptions seem to be contentment and relief. Sauter and Scott (2007) suggest contentment was not recognized because contentment is either part of the sensory pleasure emotion or because contentment is a low intensity emotion. It might be that low intensity positive emotions like pleasure and contentment are harder to recognize than high intensity emotions. Although these emotions were recognized in two cultures, both cultures are Western European countries. This work should be further tested in additional cultures to provide evidence for universality.
Gendron, Barrett et al. (2014a) (review study here) looked at vocal changes for positive emotions – amusement, relief, sensory pleasure, and triumph/pride. Remember in this study, participants heard the sound and then free-labeled the emotion. Then, researchers coded the free label into an emotion category. The vocal sounds used for each emotion are displayed in Table 20.
Table 20
Vocal Sounds and Corresponding Emotion from Gendron et al. (2014a)
| Descrete Emotion Portrayed | Vocalization |
|---|---|
| Amusement | Giggle, Laughter |
| Anger | Guttural yell, growl |
| Disgust | “Ewww” |
| Fear | Scream |
| Relief | Sigh |
| Sadness | Cry |
| Sensory Pleasure | “Mmm mmm” |
| Surprise | “Ahhh-ahhh” |
| Triumph | “Woohoo” |
Findings in Figure 12 show that amusement was the only positive emotion identified by both groups. A majority of U.S. participants correctly identified relief, but the Himba did not. For sensory pleasure and triumph, researchers did not find that a majority U.S. or Himba participants correctly identified the vocal sound. Results showed that Himba participants free labeled responses for “woo hoo” were either non-emotion related or related to the emotion amusement. For the feelings relief and sensory pleasure, a majority of Himba participants labeled the sound as no emotion.
Figure 12
Percentage of Participants who Free Labeled Each Emotion Correctly
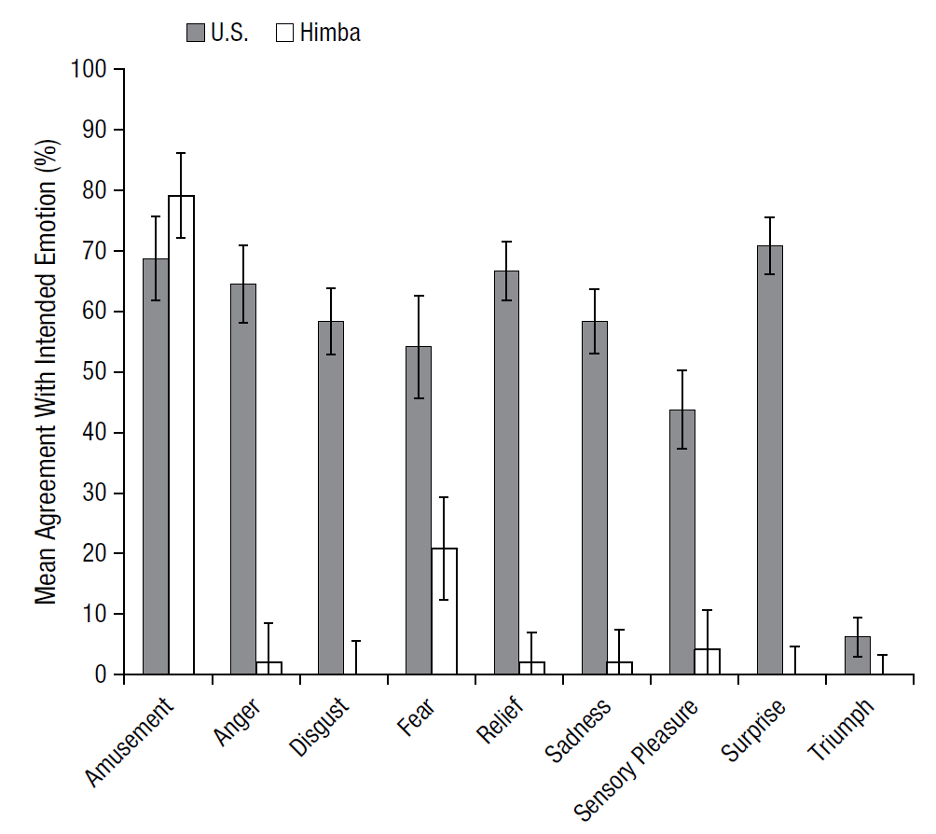
Reproduced from “Cultural Relativity in Perceiving Emotion From Vocalizations,” by M. Gendron, D. Roberson, J.M. van der Vyver, and L.F. Barrett, 2014a, Psychological Science, 25(4), p. 914, (https://doi: 10.1177/0956797613517239). Copyright 2014 The Authors.
Now, a large group of Himba and US participants did identify the positive valence of the sounds for amusement and triumph (see Figure 13), supporting some constructivist views that emotions are simply a range of valence and arousal. For relief, only a majority of the U.S. participants agreed the relief sound was positive in valence. For sensory pleasure, the researchers did not find that a majority of U.S. or Himba participants agreed the “mmm-mmm” sound was positive.
Figure 13
Self-Reported Valence of Each Emotion
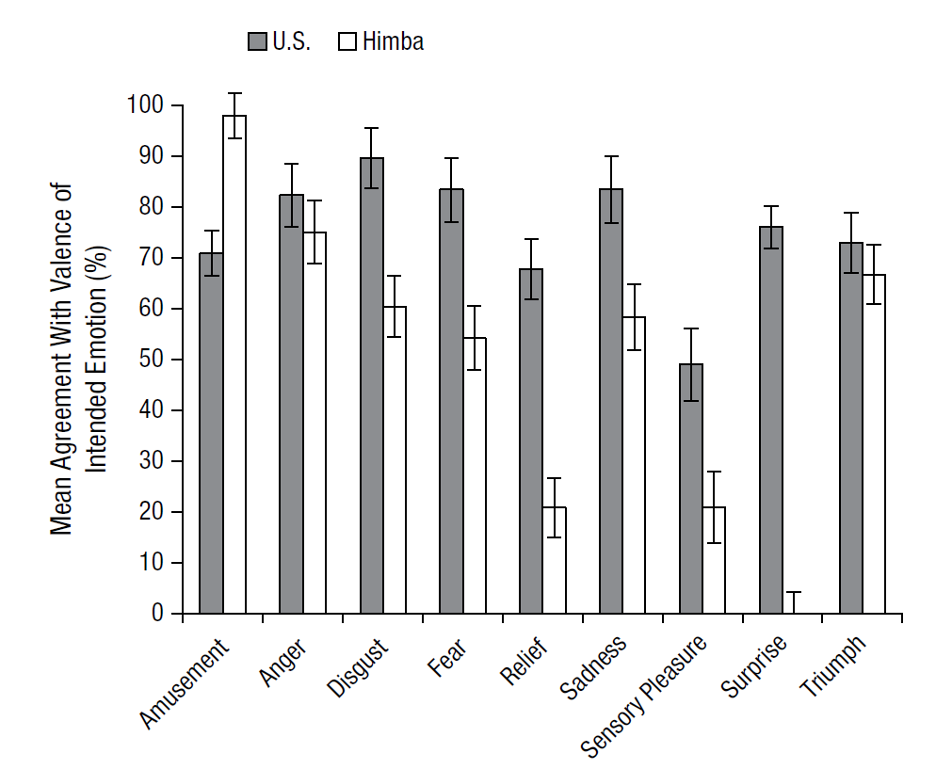
Reproduced from “Cultural Relativity in Perceiving Emotion From Vocalizations,” by M. Gendron, D. Roberson, J.M. van der Vyver, and L.F. Barrett, 2014a, Psychological Science, 25(4), p. 915, (https://doi: 10.1177/0956797613517239). Copyright 2014 The Authors.
